
(The following commentary is a summary of discussions among members of the Breckinridge Capital Advisors Investment Committee as they reviewed monthly activity in the markets and investment returns. All data is as of August 31, 2026, unless otherwise noted. The members of the Investment Committee, under the leadership of Co-Chief Investment Officers Matthew Buscone and Jeffrey Glenn, CFA, are Co-Heads of Research, Nicholas Elfner and Adam Stern, J.D., M.P.A.; and Portfolio Manager and Director, Corporate Research, Josh Perez, CFA.)
Market Review
August market activity reflected resilient economic growth, inflation that remained above the Federal Reserve's (Fed) target, and heightened expectations for tighter monetary policy. July headline personal consumption expenditures (PCE) inflation was 3.7 percent year over year (Y/Y) and core PCE was 3.3 percent, both unchanged from June and above the Fed's 2 percent target. The Atlanta Fed's GDPNow estimate called for third-quarter 2026 gross domestic product (GDP) growth of 4.6 percent, supported by consumer spending and nonresidential fixed investment, including artificial intelligence (AI)-related spending.
Labor data were softer. The number of employed people declined by 23,000, but the unemployment rate improved to 4.1 percent, as labor force participation fell to 61.4 percent. The Breckinridge Investment Committee (IC) noted that government employment accounted for much of the payroll weakness, while private payrolls continued to increase. Separately, the IC expects tariffs imposed on approximately $20 billion of Canadian goods to have a limited effect on overall U.S. consumption and inflation.
The Treasury curve flattened during the month, following Fed Chair Kevin Warsh's comments at the annual Jackson Hole, WY, conference, reinforcing the Fed's 2 percent inflation target. Yields on 2-, 5-, and 10-year Treasuries increased, while 20- and 30-year yields declined (See Figure 1). The Bloomberg U.S. Treasury Index returned 0.31 percent for August. The IC continues to expect one 25bp rate increase before year-end and maintains a 4.25 percent to 4.75 percent range for the 10-year Treasury through the end of 2026.

Long-term yields remained elevated. The 10-year Treasury reached a year-to-date high during the month, and the 30-year Treasury moved above 5.20 percent, its highest level since 2007. The IC observed that the Treasury Department's increase in long-end repurchases to approximately $4 billion per operation had not meaningfully supported long-end prices.
Bond market volatility was generally steady, with the ICE Bank of America MOVE Index remaining near but below its 200-day moving average of 72.32 (See Figure 2).

Municipal Market Review
Municipal bonds produced mixed results in August as elevated primary supply, high dealer inventories, rising bids-wanted volume, and higher front-end Treasury yields weighed on the market. Shorter maturities fared better: the Bloomberg Managed Money Short/Intermediate Municipal Index returned 0.43 percent. High-yield municipals were the strongest performing rating category, while AAA-rated bonds lagged.
Municipal yields declined 8bps and 4bps at the 2- and 5-year maturities, respectively, were unchanged at 10 years and increased 9bps at 30 years (See Figure 3).

Municipal/Treasury (M/T)1 ratios were lower in shorter maturities and higher from 10 years and out, ending August at 58 percent, 64 percent, 71 percent, and 88 percent at the 2-, 5-, 10- and 30-year maturities, respectively (See Figure 4).

Primary issuance reached approximately $66.0 billion in August, up from about $50 billion in July. Dealer inventories exceeded $11 billion, their highest level in several years. Continued investor demand helped absorb supply, with municipal funds recording approximately $3.6 billion of net inflows during the month.
The IC noted that major state revenues were generally in line with or above forecasts. Looking ahead, attractive absolute and tax-equivalent yields may support demand, but reduced reinvestment activity in September and October and continued heavy issuance could remain headwinds. A slowdown in new issue supply approaching the election and year-end could improve the technical backdrop.
Corporate Market Review
IG corporate bonds generated positive total and excess returns in August. The Bloomberg U.S. Investment Grade Corporate Index returned 0.43 percent and outperformed duration-matched Treasuries by 12bps. The Index's option-adjusted spread was unchanged at 78bps. AA-rated spreads widened 1bp, while A- and BBB-rated spreads tightened 1bp, contributing to modest underperformance by higher-rated issuers.
August gross issuance totaled approximately $170.7 billion, a record for the month and 44 percent above August 2025 issuance. After $93.2 billion of redemptions, net issuance was approximately $77.5 billion. Taxable bond mutual funds and ETFs recorded approximately $65.1 billion of net inflows, demonstrating continued investor demand despite heavy supply.
Cable Satellite, Wirelines, Independent Oil Companies, and Oil Refining were the best-performing corporate sectors. Property and Casualty Insurance, Health Insurance, and Tobacco were the weakest performers.
Strong earnings growth and record margins continue to support stable-to-improving credit fundamentals. U.S. IG credit rating upgrades have exceeded downgrades by approximately 6-to-1 year to date. However, AI infrastructure investment is driving negative free cash flow at select hyperscalers, while merger and acquisition activity has increased 45 percent Y/Y. These trends warrant continued attention, even as debt and earnings before interest, taxes, depreciation, and amortization (EBITDA) growth remain broadly aligned.
Securitized Market Review
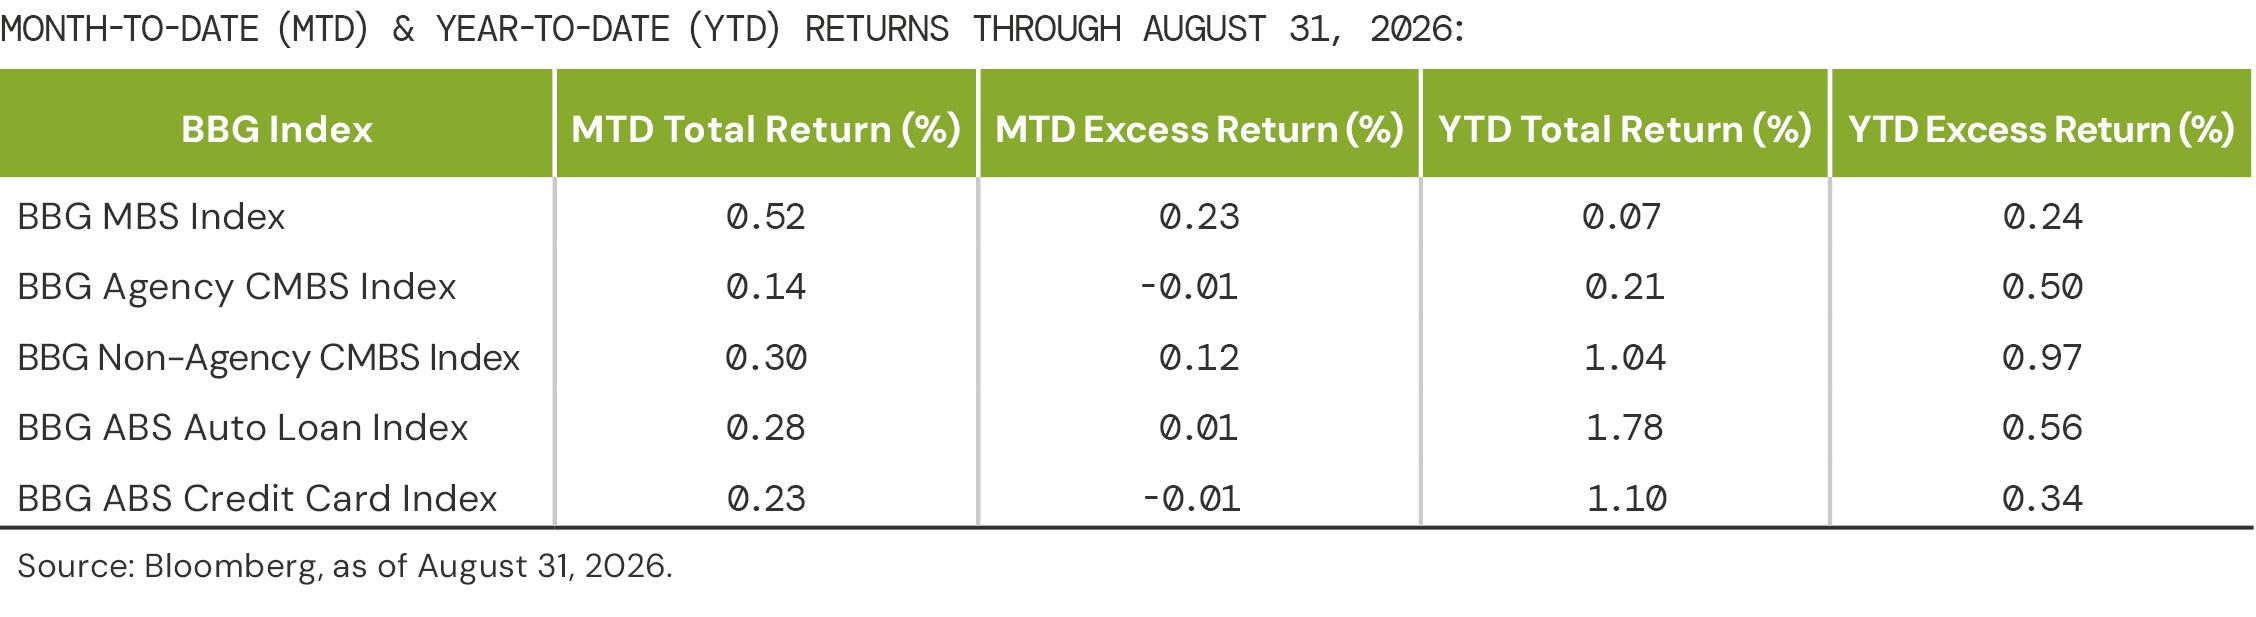
Securitized sectors delivered positive total returns in August. The Bloomberg MBS Index returned 0.52 percent and produced 23bps of excess return, as agency MBS spreads tightened 2bps and intermediate-term coupons outperformed. The broad commercial mortgage-backed securities (CMBS) index returned 0.22 percent, with agency CMBS returning 0.14 percent and non-agency CMBS returning 0.30 percent.
The Bloomberg ABS Index returned 0.28 percent and generated flat excess return. Auto loan ABS returned 0.28 percent and credit card ABS returned 0.23 percent. AAA ABS spreads widened 2bps, but the IC noted that technicals and fundamentals remained supportive ahead of a heavier post-Labor Day issuance calendar. CMBS spreads were broadly stable, while issuance was up approximately 20 percent Y/Y, led by single-asset, single-borrower, data center, and agency CMBS transactions.
Equity Market Review
U.S. equities rebounded in August, with the S&P 500 advancing 2.72 percent after a nearly flat July. Growth outperformed value: the Russell 1000 Growth Index gained 3.73 percent, compared with a 2.03 percent return for the Russell 1000 Value Index. High beta was the strongest factor, while quality lagged.
Energy (7.02 percent), Information Technology (6.25 percent) and Materials (5.97 percent) led sector performance. Higher crude oil prices supported Energy, strong earnings benefited Information Technology, and supply constraints alongside higher gold and copper prices supported Materials. Utilities (-4.77 percent), Industrials (-2.56 percent) and Real Estate (-1.87 percent) were the weakest sectors. Elevated interest rates weighed on Utilities and Real Estate, while broad airline weakness pressured Industrials.
The Chicago Board Options Exchange Volatility Index (VIX) decreased modestly during August and ended below its 200-day moving average of 18.27 (See Figure 5).

The forward S&P 500 Index price-to-earnings ratio declined to approximately 19.4 times, reflecting strong expected earnings growth, but remained above its 30-year average of approximately 17.2 times. The 10 largest companies represented 39 percent of the Index and traded at approximately 20 times forward earnings, compared with approximately 19 times for the remaining constituents. The IC continues to view several valuation measures as stretched, including cyclically adjusted earnings, dividend yield, and the earnings yield spread relative to BBB-rated corporate bonds.
[1] The Municipal/Treasury (M/T) ratio compares yields of municipal bonds with those of U.S. Treasury bonds of the same maturity. M/T ratios can show the relative value of municipal bonds compared with taxable bonds, by indicating when yields for municipal bonds exceed the after-tax yields on taxable bonds.
#490989 (9/8/2026)
DISCLAIMERS:
This material provides general information and should not be construed as a solicitation or offer of services or products or as legal, tax or investment advice. Nothing contained herein should be considered a guide to security selection, asset allocation or portfolio construction.
All information and opinions are current as of the dates indicated and are subject to change. Breckinridge believes the data provided by unaffiliated third parties to be reliable, but investors should conduct their own independent verification prior to use. Some economic and market conditions contained herein have been obtained from published sources and/or prepared by third parties, and in certain cases have not been updated through the date hereof.
There is no assurance that any estimate, target, projection or forward-looking statement (collectively, “estimates”) included in this material will be accurate or prove to be profitable; actual results may differ substantially. Breckinridge estimates are based on Breckinridge's research, analysis and assumptions. Other events that were not considered in formulating such projections could occur and may significantly affect the outcome, returns or performance.
Yields and other characteristics are metrics that can help investors in valuing a security, portfolio or composite. Yields do not represent performance results, but they are one of several components that contribute to the return of a security, portfolio or composite. Yields and other characteristics are presented gross of advisory fees.
Index results are shown for illustrative purposes and do not represent the performance of any specific investment. Indices are unmanaged and investors cannot directly invest in them. They do not reflect any management, custody, transaction or other expenses, and generally assume reinvestment of dividends, income and capital gains. Performance of indices may be more or less volatile than any investment strategy.
Fixed income investments have varying degrees of credit risk, interest rate risk, default risk, and prepayment and extension risk. In general, bond prices rise when interest rates fall and vice versa.
Equity investments are volatile and can decline significantly in response to investor reception of the issuer, market, economic, industry, political, regulatory or other conditions.
BLOOMBERG® is a trademark and service mark of Bloomberg Finance L.P. and its affiliates (collectively “Bloomberg”). Bloomberg does not approve or endorse this material or guarantee the accuracy or completeness of any information herein, or make any warranty, express or implied, as to the results to be obtained therefrom and, to the maximum extent allowed by law, neither shall have any liability or responsibility for injury or damages arising in connection therewith.
The S&P 500 Index (“Index”) and associated data is a product of S&P Dow Jones Indices LLC, its affiliates and/or their licensors and has been licensed for use by Breckinridge. © 2026 S&P Dow Jones Indices LLC, its affiliates and/or their licensors. All rights reserved. Redistribution or reproduction in whole or in part are prohibited without written permission of S&P Dow Jones Indices LLC. For more information on any of S&P Dow Jones Indices LLC's indices, please visit www.spdji.com.
S&P® is a registered trademark of Standard & Poor's Financial Services LLC (“SPFS”) and Dow Jones® is a registered trademark of Dow Jones Trademark Holdings LLC (“Dow Jones”).
Neither S&P Dow Jones Indices LLC, SPFS, Dow Jones, their affiliates nor their licensors (“S&P DJI”) make any representation or warranty, express or implied, as to the ability of any index to accurately represent the asset class or market sector that it purports to represent, and S&P DJI shall have no liability for any errors, omissions or interruptions of any index or the data included therein.


Subscribe to Insights
Sign up to receive curated insights directly in your inbox.


