
The following commentary is a summary of discussions among members of the Breckinridge Capital Advisors Investment Committee as they reviewed monthly activity in the markets and investment returns. All data is as of July 31, 2026, unless otherwise noted. The members of the Investment Committee, under the leadership of Co-Chief Investment Officers Matthew Buscone and Jeffrey Glenn, CFA, are Co-Heads of Research, Nicholas Elfner and Adam Stern, J.D., M.P.A.; and Portfolio Manager and Director, Corporate Research, Josh Perez, CFA.
Market Review
July was characterized by rising long-term interest rates, evolving monetary policy expectations, and starting and stopping of military action in Iran. The Federal Reserve (Fed) left the federal funds rate unchanged, citing stable employment, moderating inflation, and continued economic growth. However, three dissents favoring an immediate rate increase underscored growing concern about persistently above-target inflation. Market participants ended the month pricing roughly a 60 percent probability of a September rate hike. The Breckinridge Investment Committee (IC) now expects one additional rate increase before year-end and raised the lower end of its expected 10-year Treasury range to 4.25 percent with the higher end at 4.75 percent.
Treasury yields moved higher and the curve steepened, as investors weighed inflation risks, elevated government borrowing needs, and resilient economic data. The 10-year Treasury reached a year-to-date high while the 30-year Treasury yield climbed above 5.20 percent, its highest level since 2007. Treasury yields increased 12 basis points (bps), 22bps, 27bps, and 32bps across the 2-, 5-, 10-, and 30-year maturities, respectively (See Figure 1).

Economic data was mixed. Personal Consumption Expenditures (PCE) inflation slowed to 3.7 percent year over year, with core PCE declining to 3.3 percent, although both remained well above the Fed’s 2 percent objective. Second-quarter gross domestic product (GDP) growth slowed to 1.5 percent, reflecting weaker net exports and inventories, while consumer spending remained resilient despite the savings falling below 3 percent. Labor market conditions continued to appear healthy, with continuing unemployment claims remaining near multiyear lows and wage data showing modest firming.
Geopolitical developments also contributed to market volatility. U.S. military action involving Iran, wider regional concerns over key global shipping routes, and new tariff measures announced late in the month heightened inflation concerns and supported higher commodity prices. Bond market volatility increased during July, with the ICE BofA MOVE Index ending the month above its recent levels (See Figure 2).

Municipal Market Review
Municipal bonds experienced a challenging month under pressure from higher Treasury yields, elevated issuance, and increased dealer inventories. July marked a departure from typical seasonal patterns, with negative returns across the municipal yield curve. The Bloomberg (BBG) Managed Money Short/Intermediate Municipal Index returned -1.34 percent during the month. Municipal yields increased 28bps, 32bps, 41bps, and 31bps across the 2-, 5-, 10-, and 30-year maturities, respectively (See Figure 3).

Municipal/Treasury (M/T) ratios1 ended the month higher at 61 percent, 66 percent, 70 percent, and 86 percent across the same maturities (See Figure 4).

Primary issuance remained elevated at approximately $49.9 billion during July, contributing to growing dealer inventories and weighing on market technicals. Despite several days of outflows early in the month, municipal funds recorded net inflows of approximately $4.4 billion by month-end, and the IC expects August reinvestment demand to provide technical support in the near term.
Credit fundamentals generally remained stable, with increases in state and local tax collections. The IC noted increasing pressure on education sectors and Moody's revision of its local government sector outlook to negative due to inflationary and expenditure risks. Looking ahead, the IC continues to favor the intermediate portion of the municipal curve, particularly the 5- to 10-year segment, which has lagged year to date while offering attractive absolute and tax-equivalent yields.
Corporate Market Review
IG corporate bonds produced negative returns during July, as rising Treasury yields and wider credit spreads offset healthy corporate fundamentals. The BBG U.S. IG Corporate Index returned -1.67 percent, underperforming Treasuries by 26bps. Option-adjusted spreads widened 4bps during the month to 78bps, with AA-rated issuers underperforming A- and BBB-rated issuers.
Primary issuance remained robust, totaling approximately $162.2 billion during July, twice the level of July 2025, while net issuance reached $61.8 billion after $100.4 billion of bond redemptions. Taxable bond funds recorded net inflows of roughly $49.6 billion, reflecting continued investor demand amidst higher yields.
Performance varied meaningfully across sectors. Refining, Chemicals, Financial Companies, Paper, and Automotive were among the strongest-performing sectors, while Cable Satellite, Media Entertainment, Wirelines, Technology, and Wireless lagged. The IC noted that credit fundamentals remain broadly stable, supported by strong earnings growth, although increased borrowing associated with artificial intelligence (AI) infrastructure investments and accelerating merger and acquisition activity warrants continued monitoring.
Securitized Market Review
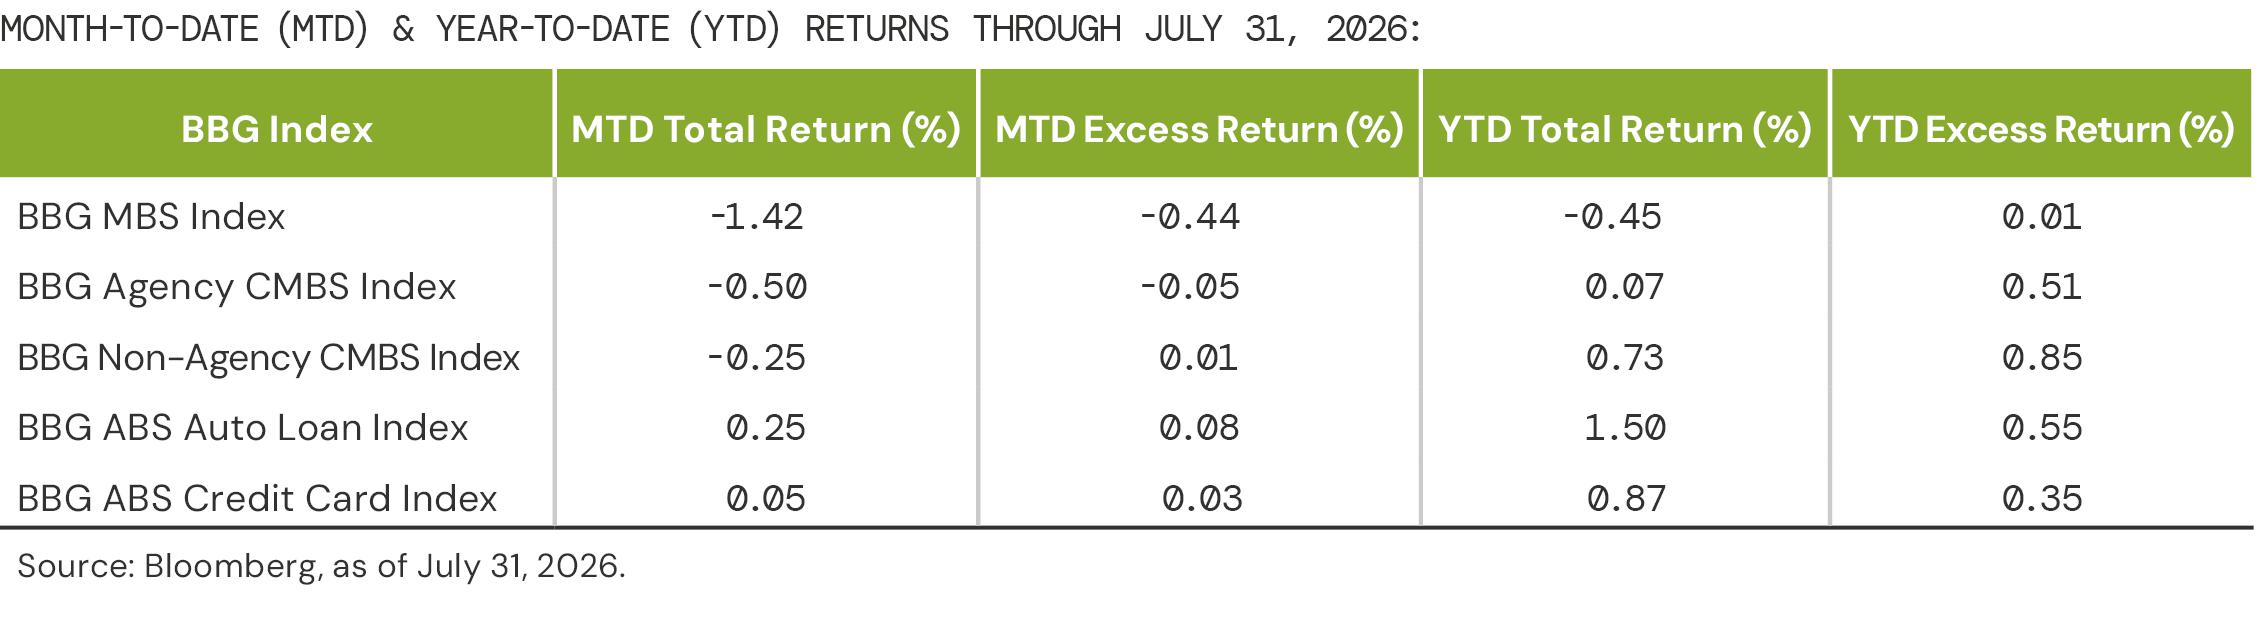
Securitized sectors delivered mixed results during July. MBS securities had negative returns, as rising Treasury yields and a steeper yield curve pressured valuations, contributing to a -1.42 percent total return for the BBG MBS Index. Agency CMBS and Non-Agency CMBS produced more modestly negative total returns.
ABS continued to outperform most spread sectors. The broad BBG ABS Index returned -0.11 percent, while generating positive excess returns. Auto loan ABS led performance with a positive 0.25 percent return, followed by credit card ABS at 0.05 percent. The IC noted that ABS spreads tightened modestly during the month, with prime auto loan ABS continuing to benefit from strong investor demand.
Equity Market Review
U.S. equities finished July little changed overall, although sector dispersion shifted meaningfully beneath the surface. The S&P 500 declined 0.06 percent, as growth-oriented technology companies came under pressure following concerns on valuations, spending and returns in the AI trade. The Russell 1000 Value Index gained 3.82 percent while the Russell 1000 Growth Index declined 4.76 percent.
The Chicago Board Options Exchange Volatility Index (VIX) remained relatively stable throughout July, finishing below its 200-day moving average of 18.63 at 16 (See Figure 5).

Sector performance was led by Energy (12.60 percent), Financials (6.16 percent), and Real Estate (2.52 percent). Information Technology (-3.43 percent), Industrials (-3.01 percent), and Utilities (-2.23 percent) were among the weakest performing sectors. Value and Leverage factors outperformed during the month, while growth, momentum, and high-beta factors lagged.
The IC noted that earnings season remained constructive, with more than 60 percent of companies having reported results and earnings growth approaching 50 percent. However, elevated valuations within portions of the Technology sector and continued uncertainty surrounding inflation and monetary policy contributed to increased market rotation during the month.
[1] The Municipal/Treasury (M/T) ratio compares yields of municipal bonds with those of U.S. Treasury bonds of the same maturity. M/T ratios can show the relative value of municipal bonds compared with taxable bonds, by indicating when yields for municipal bonds exceed the after-tax yields on taxable bonds.
BCAI-08102026-gqaigu0a (8/11/2026)
DISCLAIMERS:
This material provides general information and should not be construed as a solicitation or offer of services or products or as legal, tax or investment advice. Nothing contained herein should be considered a guide to security selection, asset allocation or portfolio construction.
All information and opinions are current as of the dates indicated and are subject to change. Breckinridge believes the data provided by unaffiliated third parties to be reliable but investors should conduct their own independent verification prior to use. Some economic and market conditions contained herein have been obtained from published sources and/or prepared by third parties, and in certain cases have not been updated through the date hereof.
There is no assurance that any estimate, target, projection or forward-looking statement (collectively, “estimates”) included in this material will be accurate or prove to be profitable; actual results may differ substantially. Breckinridge estimates are based on Breckinridge’s research, analysis and assumptions. Other events that were not considered in formulating such projections could occur and may significantly affect the outcome, returns or performance.
Yields and other characteristics are metrics that can help investors in valuing a security, portfolio or composite. Yields do not represent performance results but they are one of several components that contribute to the return of a security, portfolio or composite. Yields and other characteristics are presented gross of advisory fees.
Index results are shown for illustrative purposes and do not represent the performance of any specific investment. Indices are unmanaged and investors cannot directly invest in them. They do not reflect any management, custody, transaction or other expenses, and generally assume reinvestment of dividends, income and capital gains. Performance of indices may be more or less volatile than any investment strategy.
Fixed income investments have varying degrees of credit risk, interest rate risk, default risk, and prepayment and extension risk. In general, bond prices rise when interest rates fall and vice versa.
Equity investments are volatile and can decline significantly in response to investor reception of the issuer, market, economic, industry, political, regulatory or other conditions.
BLOOMBERG® is a trademark and service mark of Bloomberg Finance L.P. and its affiliates (collectively “Bloomberg”). Bloomberg does not approve or endorse this material or guarantee the accuracy or completeness of any information herein, or makes any warranty, express or implied, as to the results to be obtained therefrom and, to the maximum extent allowed by law, neither shall have any liability or responsibility for injury or damages arising in connection therewith.
The S&P 500 Index (“Index”) and associated data is a product of S&P Dow Jones Indices LLC, its affiliates and/or their licensors and has been licensed for use by Breckinridge. © 2026 S&P Dow Jones Indices LLC, its affiliates and/or their licensors. All rights reserved. Redistribution or reproduction in whole or in part are prohibited without written permission of S&P Dow Jones Indices LLC. For more information on any of S&P Dow Jones Indices LLC’s indices, please visit www.spdji.com. S&P® is a registered trademark of Standard & Poor’s Financial Services LLC (“SPFS”) and Dow Jones® is a registered trademark of Dow Jones Trademark Holdings LLC (“Dow Jones”). Neither S&P Dow Jones Indices LLC, SPFS, Dow Jones, their affiliates nor their licensors (“S&P DJI”) make any representation or warranty, express or implied, as to the ability of any index to accurately represent the asset class or market sector that it purports to represent and S&P DJI shall have no liability for any errors, omissions, or interruptions of any index or the data included therein.


Subscribe to Insights
Sign up to receive curated insights directly in your inbox.


