

Investment Review and Outlook
IG Credit Generated Solid Positive Returns in the Second Quarter
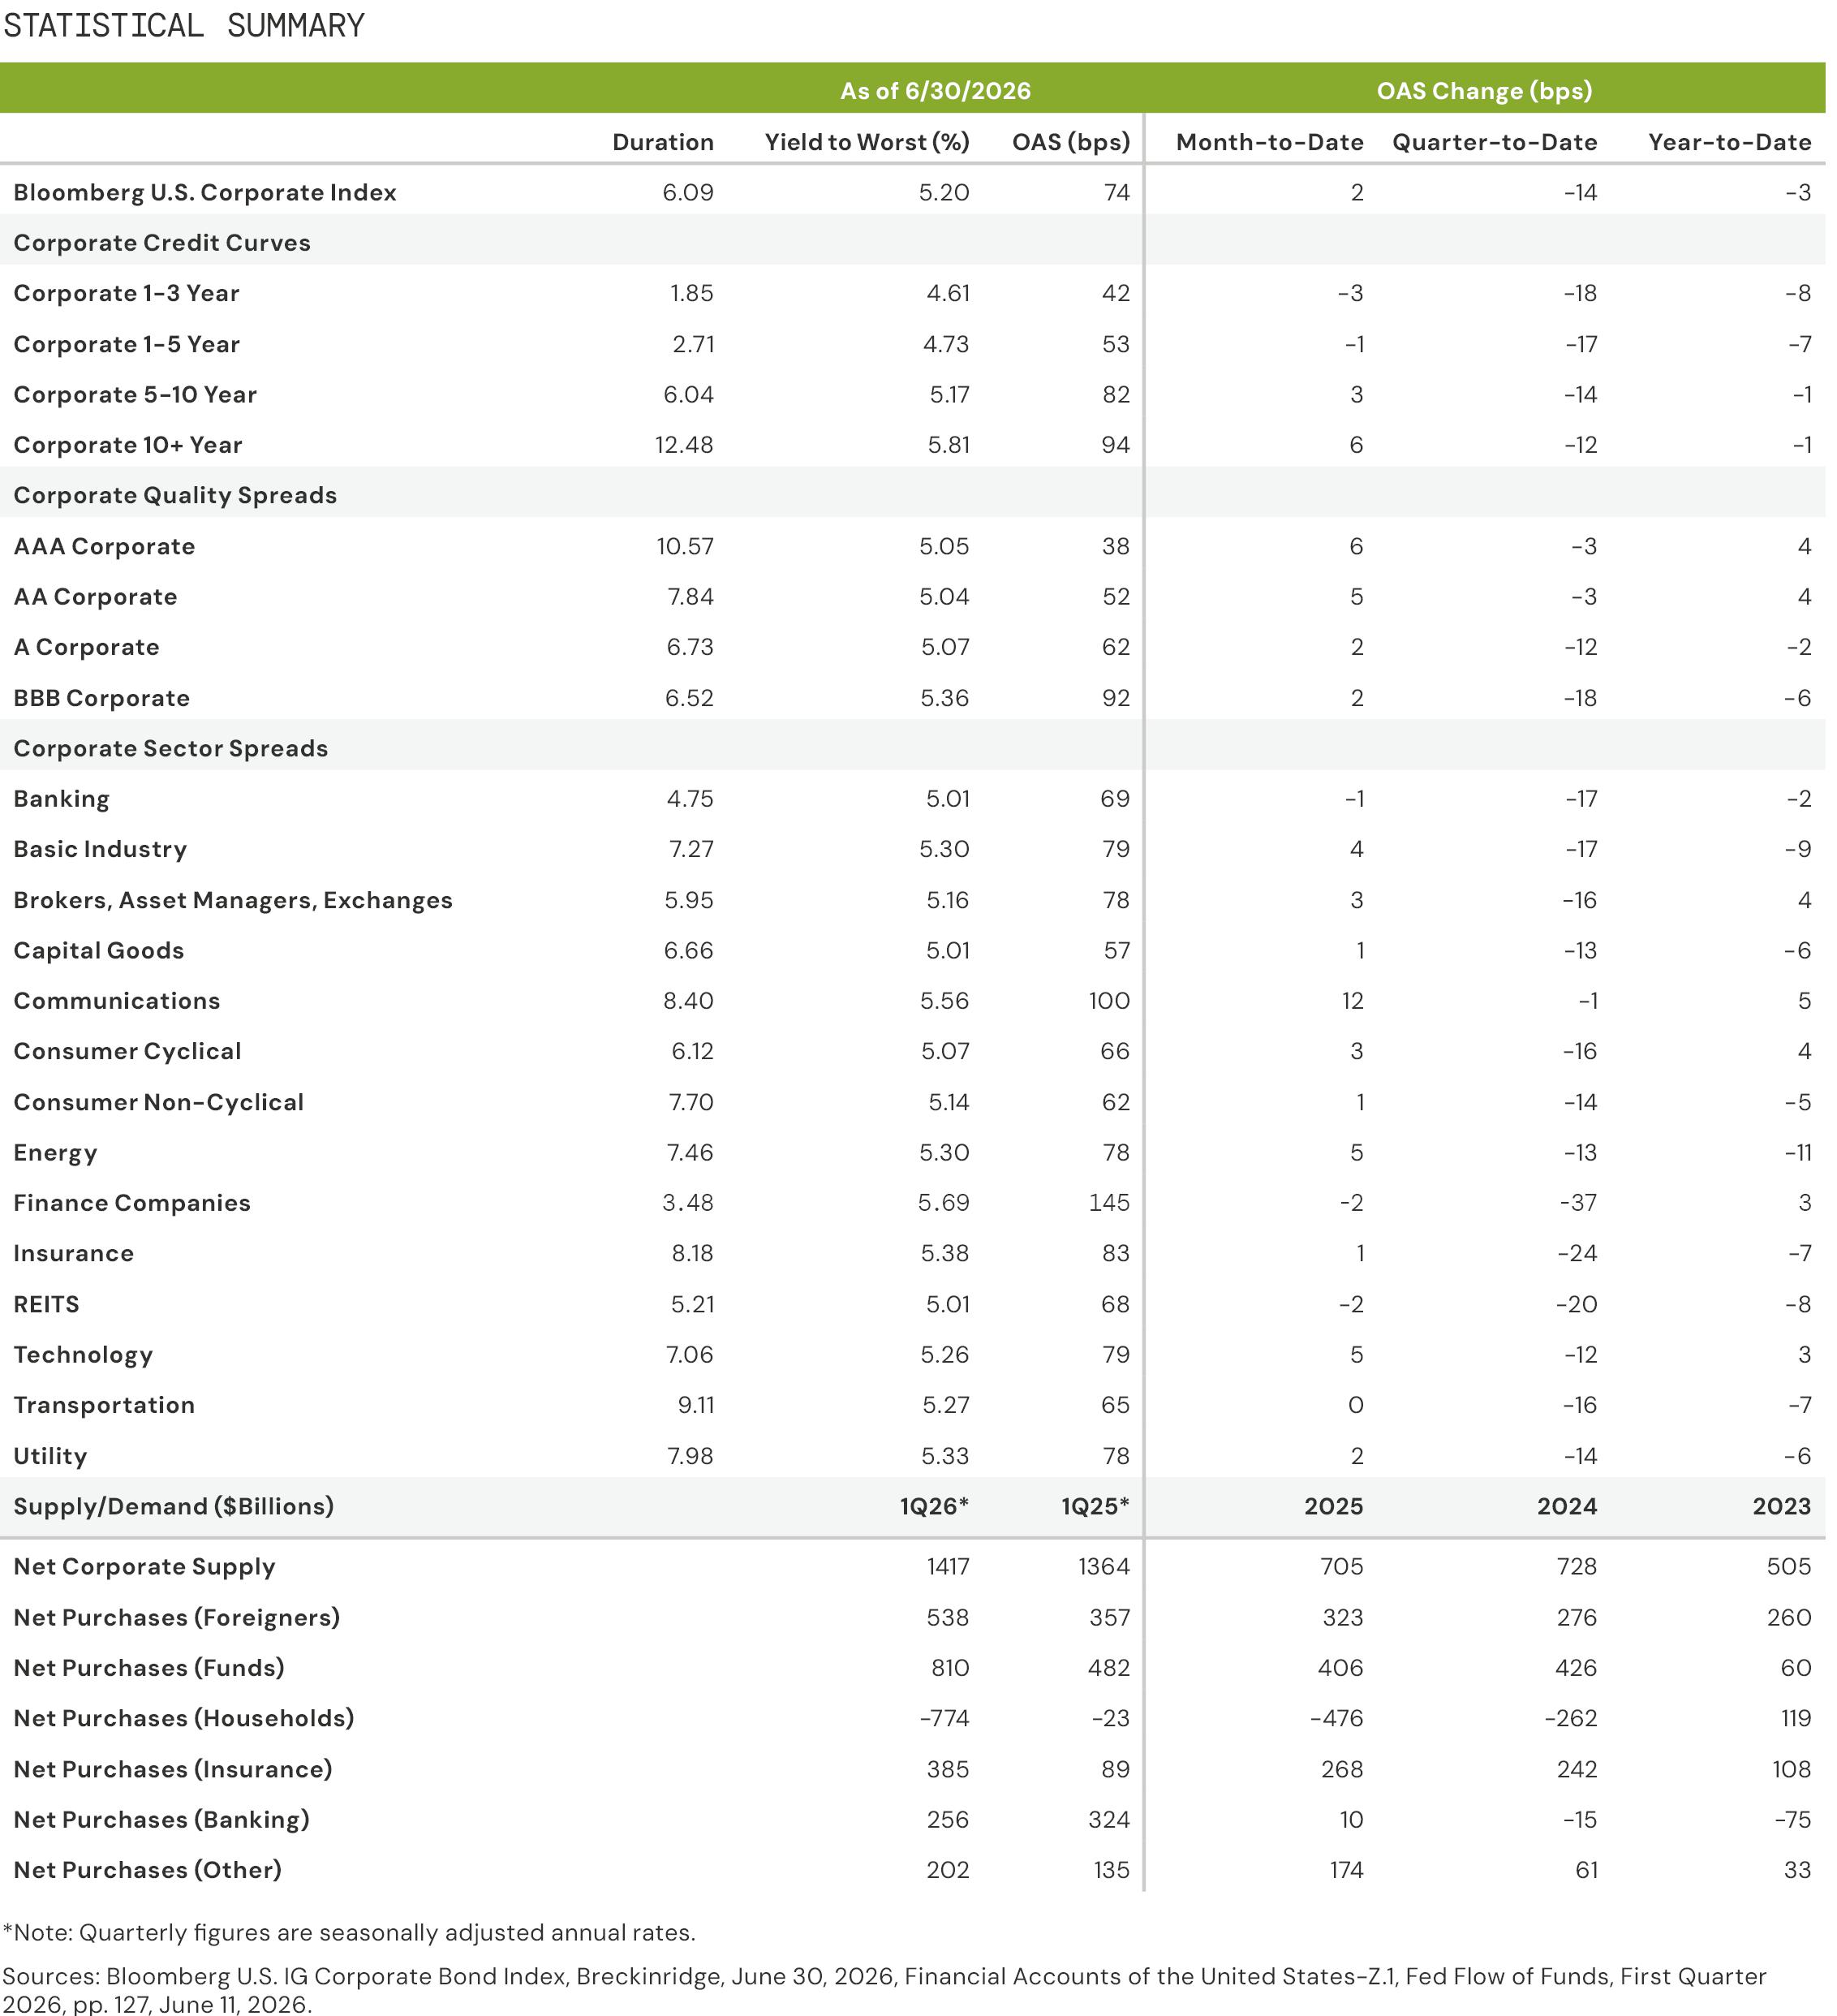
After widening 11bps in the first quarter on heightened geopolitical risk and an oil shock, corporate bond spreads staged a comeback on a ceasefire in Iran, solid U.S. economic data, and a strong first-quarter earnings cycle. With spread tightening of 14bps, the Index finished at an option-adjusted spread (OAS) of +74bps at 2Q26. Selective risk-taking was rewarded, reinforcing the value of active credit selection during transient risk-off periods. At present, IG spreads are back to the 1st percentile over a 20-year lookback, with full valuations necessitating careful selection. Positive total returns and above average all-in yields in the 74th percentile continue to drive strong demand and fund flows.
With the risk-on tone in equities, credit quality spreads compressed in 2Q26. The A/BBB quality spread differential tightened 6bps to 30bps with a z-score of negative 1.1 compared to the five-year average.4 With underperformance in the first quarter, more favorable relative value emerged in Financials, which contributed to outperformance compared to the Index in 2Q26. We favor Financials bonds relative to Industrials on incremental spread pickup versus comparably rated Industrials issuers. Spreads on short (1-3 year), intermediate (5 year), and long corporate (10+ year) BBG indices tightened by 18bps, 16bps, and 12bps, respectively, as credit curves steepened. While credit spreads are tight, we continue to think short- to intermediate-term bonds offer slightly better relative value over longer maturities.5
The Breckinridge Investment Committee’s base case macro outlook for the U.S. economy is for moderate real gross domestic product (GDP) growth in 2026. The Tech and AI-related capex boom is contributing to GDP growth directly in investment and secondarily in a wealth effect via consumer spending.6 Prospectively, AI-related capex is likely to keep growth and inflation above target, though lower energy prices are an offset. The labor market has sent mixed signals but, although revised downward at the end of June, job growth continued in 2Q26. Geopolitical developments add uncertainty and are a downside risk to the outlook. Our Investment Committee thinks the Federal Reserve (Fed) will remain on hold for the rest of this year.
Above-average yields, solid investor demand, and stable credit fundamentals are counterbalanced by tight spreads, high bond issuance, stress in private credit, and geopolitical risks driving a modest overweight to IG corporate credit with a defensive posture. We view the income proposition for IG credit as attractive with the Index yield over five percent at 2Q26
Valuations: Tight Spreads and Above-Average Yields

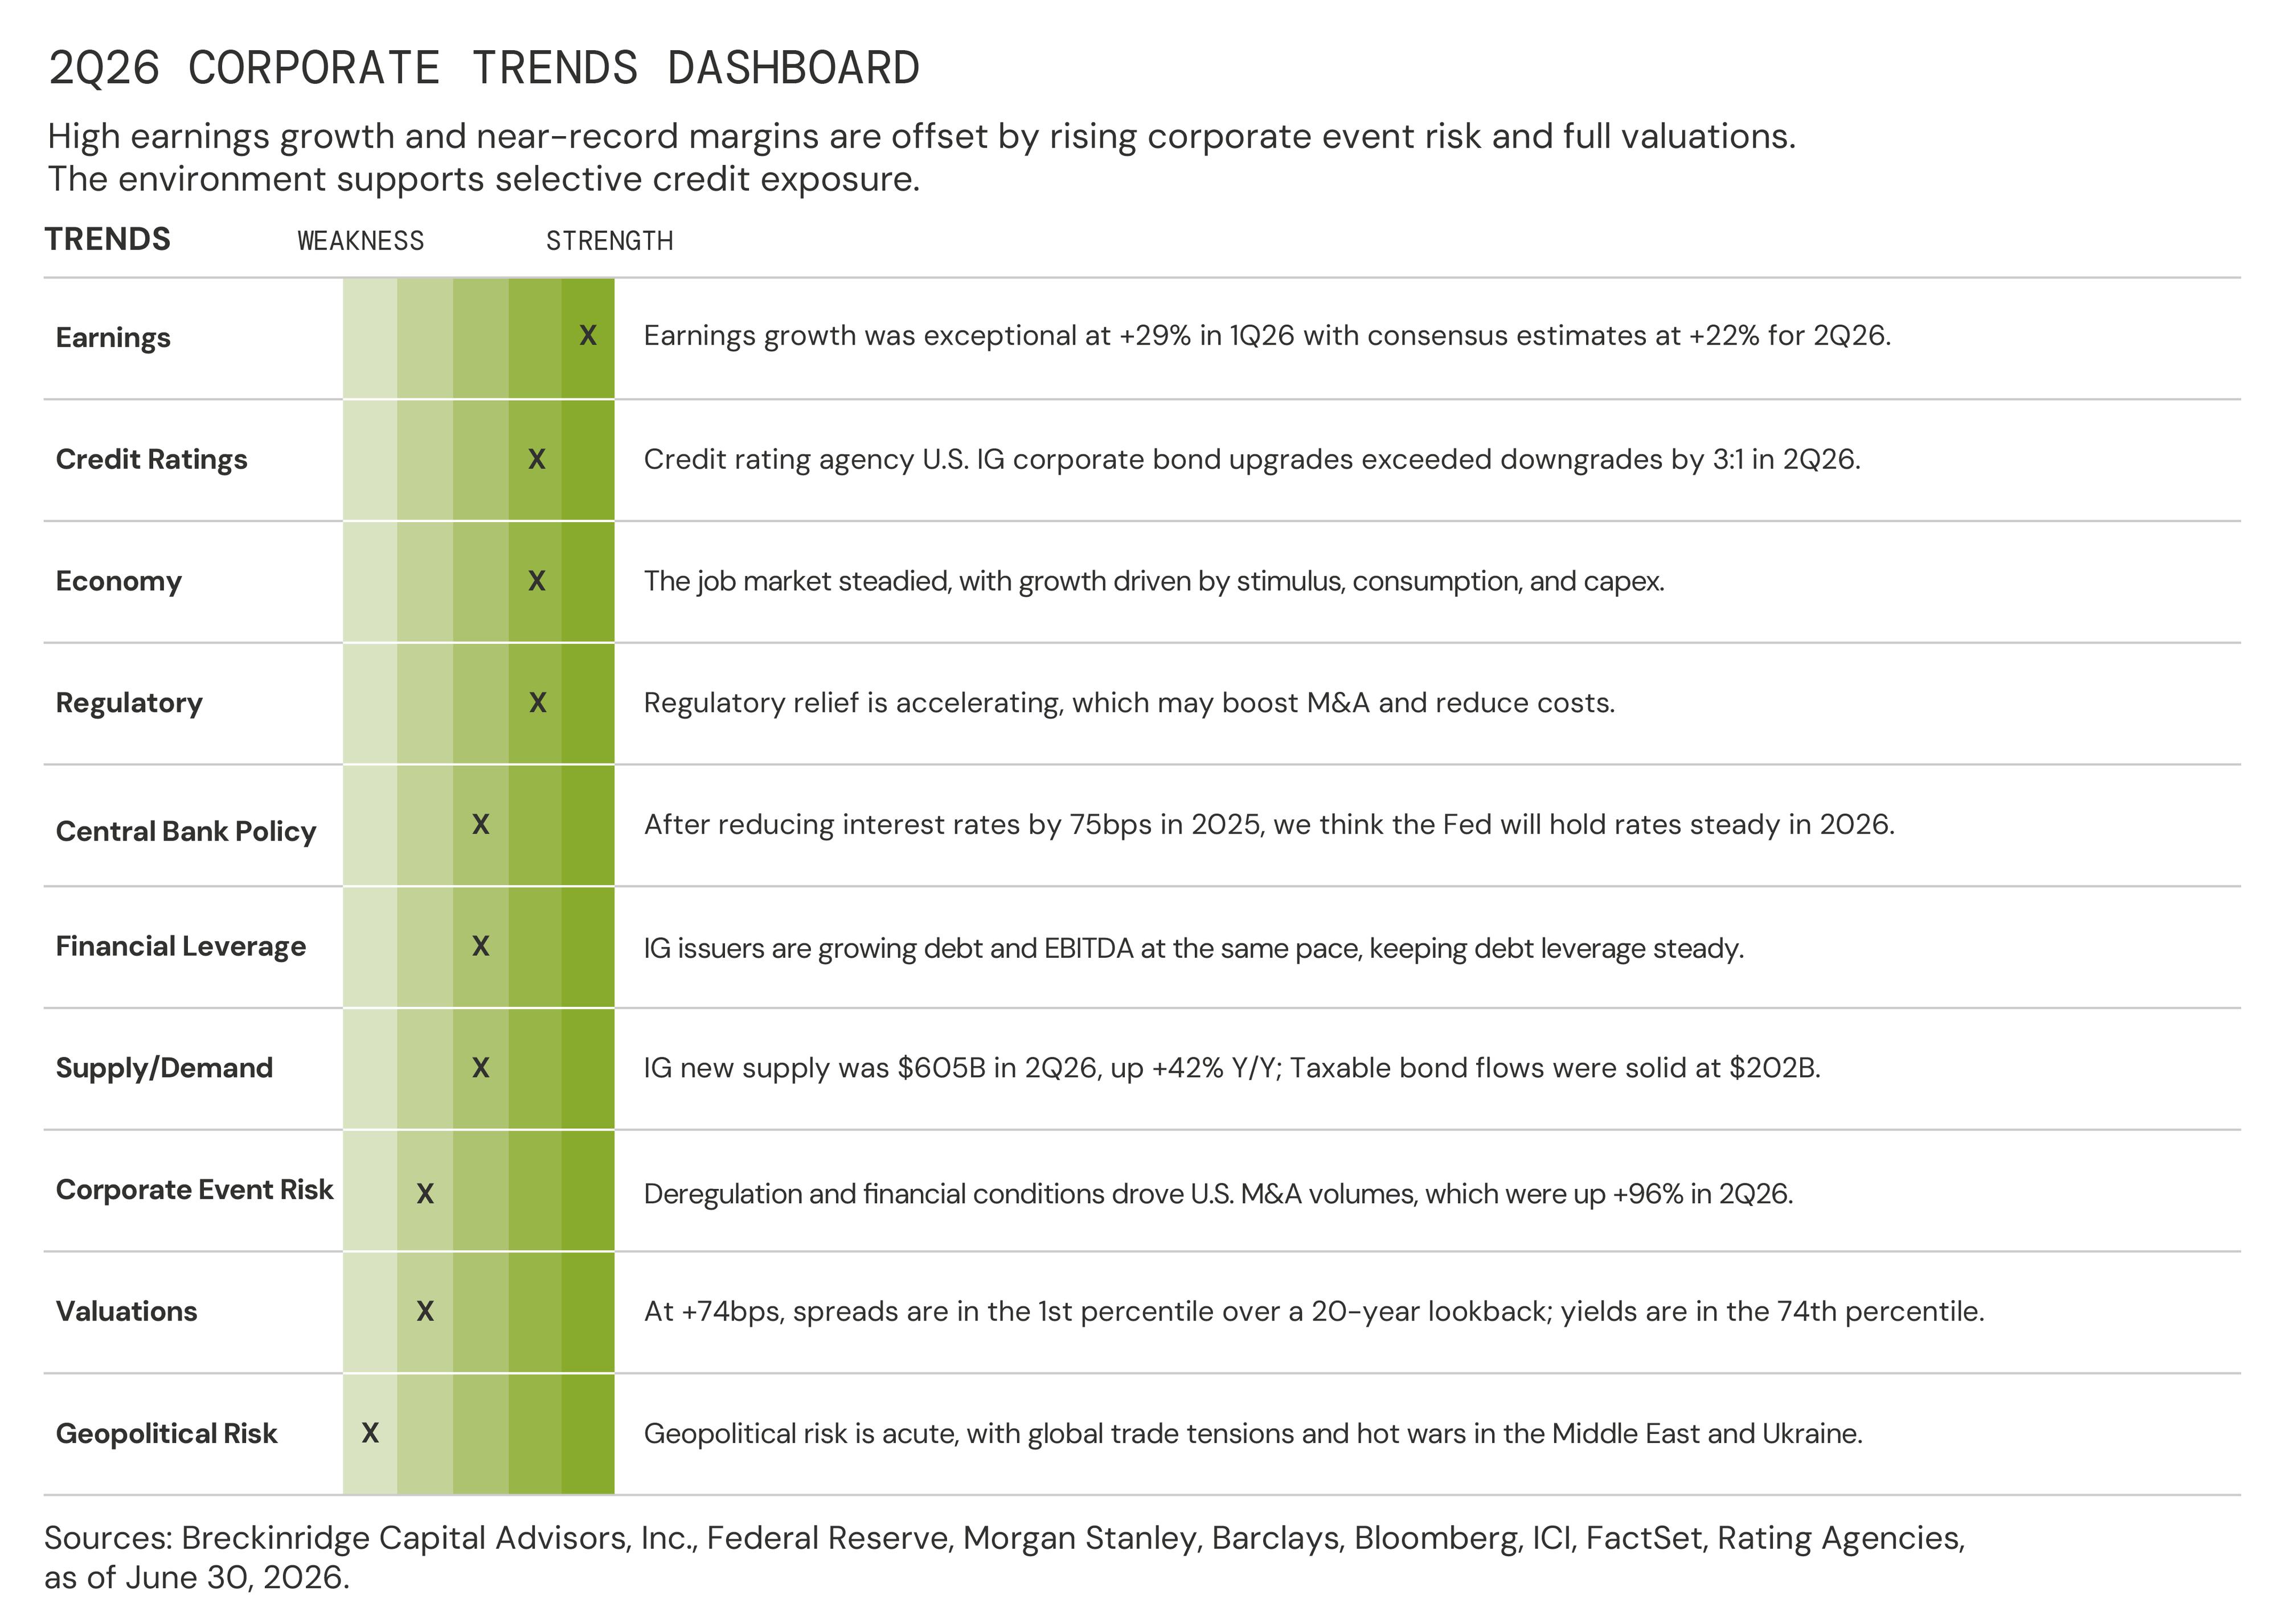
Corporate spreads were 14bps tighter in 2Q26, closing at an OAS of +74bps. Both IG total and excess returns were positive at 1.40 percent and 1.17 percent in 2Q26, respectively. Spreads are in the first percentile over a 20-year lookback. Valuations argue for a defensive stance, while an IG yield over 5 percent, in the 74th percentile, is supportive of investor demand.
Changes in spreads showed that AAA/AA corporate bonds (-3bps) meaningfully underperformed A-rated (-12bps) and BBB-rated (-18bps) corporates in 2Q26, respectively. Financials (-19bps) outperformed Industrials (-12bps) and Utilities (-14bps) in 2Q26. Finance, which includes Business Development Companies (BDCs) tightened by 37bps, while Insurance (-24bps) also did well. Cable Satellite and Media Entertainment both underperformed, widening 8bps and 3bps, respectively on elevated merger and acquisition (M&A)-related supply.
Technicals: Elevated Supply and Robust Demand

High IG issuance in 2Q26 was driven by high refinancing activity and rising AI-related capex, including data center and infrastructure buildout. Gross IG supply was $605 billion in 2Q26, up 42 percent y/y. Net issuance, after $351 billion of bond redemptions, was $254 billion. Taxable bond fund flows were $202 billion in 2Q26, per the Investment Company Institute (ICI). Foreign buying of corporates was $144 billion, year-to-date (YTD), through April 30, 2026.7
After an active first-quarter, AI-related U.S. dollar ($USD) unsecured issuance remained high in the second quarter. The Communications sector was the second largest borrower, issuing $101 billion in bonds, followed by the Utilities sector at $61 billion, and the Technology sector at $44 billion. The market value of the Technology Index at 10.2 percent is the third largest sub-sector of the IG market, up from 9.5 percent one year ago. These figures exclude non-$USD bond issuance, project financing, operating and finance leases, asset-backed deals, private IG borrowing, equity issuance, and other alternative sources being tapped by hyperscalers8 to fund AI capex.9 At $268 billion, the Financials sector issued the most bonds in 2Q26.
Fundamentals: Steady Leverage, Near-Record Margins

Strong earnings growth and near-record margins support stable-to-improving fundamentals and suggest a constructive backdrop in credit. Earnings growth was exceptional at 29 percent in 1Q26, with consensus estimates among analysts at 22 percent for 2Q26.10 Industrials margins are near-record territory and corporate investments in AI may drive additional cost savings and productivity gains.11
Credit rating agency U.S. IG corporate bond upgrades exceeded downgrades by 3:1 in 2Q26.12 Deregulation and financial conditions drove U.S. M&A volumes, which were up +96 percent Y/Y in 2Q26.13 M&A is rising and may strain metrics if heavily debt-funded, although, to date with financing sources, have been balanced. IG issuers have grown debt and earnings before interest, taxes, depreciation, and appreciation (EBITDA) at roughly the same pace, keeping financial leverage steady over the trailing five-year period.14 Debt-funded AI-related capex is high, although exposed sectors have partially mitigated credit and leverage impacts by issuing hybrids and common equity.
Capex is accelerating, with the IG cohort spending $349 billion in 1Q26 and $1.3 trillion over the last 12 months.15 Hyperscaler and Technology cap ex are projected to break $1 trillion and exceed all non-financial IG issuers by 20 percent in 2027.16 Sharply rising cap ex is a risk to AI-exposed sectors such as Technology, Communications, and Utilities, although high credit ratings, strong balance sheets, and regulated business models mitigate added leverage, respectively.
Bank credit looks stable to us, with strong market-sensitive revenues and steady net interest income from lending. Pressure on lower-income consumers is affecting subprime auto and credit card loans, as delinquencies remain elevated, albeit a smaller sub-segment for most IG Banks. BDCs with high software exposures are seeing rising non-performing loans, higher payment-in-kinds (PIKs), and redemption pressures, and banks have experienced strong loan growth to non-depository financial institutions (NDFIs).17
[1] Barclays FICC Research, Credit Strategy, US Investment Grade Corporate Update, June 2026, 7/1/26.
[2] Treasury International Capital (TIC), TIC Data for April 2026, Net Corporate Bond Cross-Border Flows, 6/18/26.
[3] Barclays FICC Research, U.S. Investment Grade Credit Metrics – Q1 26 Update: Stable Metrics, 6/5/26.
[4] A z-score is a statistical measurement that indicates how far away a data point is from the mean of a dataset, measured in terms of standard deviations. It standardizes a raw score, allowing for comparisons between different datasets or populations.
[5] Bloomberg, Will I Lose Money? Credit Buyers Turn to Break evens for Clues, Ronan Martin, October 1, 2025. Breakeven credit spread widening refers to calculating the amount a bond’s spread can increase before the bond’s total return becomes negative. For example, a bond earning 100 bps (1%) but with a 2-year spread duration can withstand a 50 bps (0.5%) widening before breaking even on its spread return.
[6] Bureau of Economic Analysis, 6/25/26. Info Tech sector was the leading contributor to the increase in real GDP.
[7] Treasury International Capital (TIC), TIC Data for April 2026, Net Corporate Bond Cross-Border Flows, 6/18/26.
[8] Hyperscalers are large cloud service providers that own and operate outsized global data centers that offer on-demand computing, storage, and networking resources.
[9] Barclays Research, Data Center Bond Comp Sheet, AI Data Center Bonds Outstanding are c.$90 billion, 6/25/26.
[10] Earnings are projected to grow 22 percent in 2Q26, Earnings Insight, FactSet, June 12, 2026.
[11] Barclays Research, Credit Strategy, US Investment Grade Credit Metrics – Q1 26 Update: Stable Metrics, 6/5/26.
[12] Bloomberg, U.S. IG Agency rating upgrades exceeded downgrades by 3:1 in 2Q26, RATT <GO> on BBG, 6/30/26.
[13] Bloomberg, Merger, and acquisitions were up 96 percent in 2Q26, MA <GO> on BBG, 6/30/26.
[14] Barclays Research, Credit Strategy, US Investment Grade Credit Metrics – Q1 26 Update: Stable Metrics, 6/5/26.
[15] Morgan Stanley US Credit Strategy: 1Q26 Fundamentals, Broad-Based Earnings Growth, June 17, 2026.
[16] Ibid.
[17] Federal Deposit Insurance Corporation, Banking Issues in Focus, February 2026. “From 2010 to 2024, outstanding balances of bank loans to NDFIs, reported quarterly on bank Consolidated Reports of Condition and Income (Call Reports), rose at a compound annual growth rate of 21.9 percent, almost three times as high as the next-fastest-growing segment.”
BCAI-07072026-tnhgvn75 (7/7/2026)
DISCLAIMER:
All data is as of June 30, 2026, unless otherwise noted.
The content is intended for investment professionals and institutional investors.
This material provides general information and should not be construed as a solicitation or offer of services or products or as legal, tax, or investment advice. Nothing contained herein should be considered a guide to security selection, asset allocation, or portfolio construction.
All information and opinions are current as of the dates indicated and are subject to change. Breckinridge believes the data provided by unaffiliated third parties to be dependable, but investors should conduct their own independent verification prior to use. Some economic and market conditions contained herein have been obtained from published sources and/or prepared by third parties, and in certain cases have not been updated through the date hereof.
There is no assurance that any estimate, target, projection, or forward-looking statement (collectively, “estimates”) included in this material will be accurate or prove to be profitable; actual results may differ substantially. Breckinridge estimates are based on Breckinridge’s research, analysis, and assumptions. Other events that were not considered in formulating such projections could occur and may significantly affect the outcome, returns or performance.
Not all securities or issuers mentioned represent holdings in client portfolios. Some securities have been provided for illustrative purposes only and should not be construed as investment recommendations. Any illustrative engagement or sustainability analysis examples are intended to demonstrate Breckinridge’s research and investment process.
Yields and other characteristics are metrics that can help investors in valuing a security, portfolio, or composite. Yields do not represent performance results, but they are one of several components that contribute to the return of a security, portfolio, or composite. Yields and other characteristics are presented gross of advisory fees.
All investments involve risk, including loss of principal. No investment or risk management strategy, including diversification, can guarantee positive results or risk elimination in any market.
Past performance is not indicative of future results. Breckinridge makes no assurances, warranties, or representations that any strategies described herein will meet their investment objectives or incur any profits. Performance results for Breckinridge’s investment strategies include the reinvestment of interest and any other earnings, but do not reflect any brokerage or trading costs a client would have paid. Results may not reflect the impact that any material market or economic factors would have had on the accounts during the time period. Due to differences in client restrictions, objectives, cash flows, and other such factors, individual client account performance may differ substantially from the performance presented.
Actual client advisory fees may differ from the advisory fee used to calculate net performance results. Client returns will be reduced by the advisory fees and any other expenses incurred in the management of their accounts. For example, an advisory fee of 1 percent compounded over a 10-year period would reduce a 10 percent return to a 9 percent annual return. Additional information on fees can be found in Breckinridge’s Form ADV Part 2A.
Index results are shown for illustrative purposes and do not represent the performance of any specific investment. Indices are unmanaged and investors cannot directly invest in them. They do not reflect any management, custody, transaction, or other expenses, and generally assume reinvestment of dividends, income, and capital gains. Performance of indices may be more or less volatile than any investment strategy.
There is no guarantee that the strategies or approaches discussed will achieve their objectives, lower volatility or be profitable. All investments involve risk, including loss of principal. Diversification cannot assure a profit or protect against loss. No investment or risk management strategy can guarantee positive results or risk elimination in any market.
Fixed income investments have varying degrees of credit risk, interest rate risk, default risk, and prepayment and extension risk. In general, bond prices rise when interest rates fall and vice versa.
Equity investments are volatile and can decline significantly in response to investor reception of the issuer, market, economic, industry, political, regulatory, or other conditions.
When integrating sustainability analysis with traditional financial analysis, Breckinridge’s investment team will consider material sustainability factors but may conclude that other attributes outweigh the sustainability considerations when making investment decisions.
There is no guarantee that integrating sustainability analyses will improve risk-adjusted returns, lower portfolio volatility over any specific time period, or outperform the broader market or other strategies that do not utilize these analyses when selecting investments. The consideration of sustainability factors may limit investment opportunities available to a portfolio. In addition, data for sustainable factors often lacks standardization, consistency, and transparency and for certain companies such data may not be available, complete, or accurate.
Breckinridge’s sustainability analysis is based on third party data and Breckinridge analysts’ internal analysis. Analysts will review a variety of sources such as corporate sustainability reports, data subscriptions, and research reports to obtain available metrics for internally developed frameworks. A high sustainability rating does not mean it will be included in a portfolio, nor does it mean that a bond will provide profits or avoid losses.
Investments in thematic customizations will subject the portfolio to proportionately higher risk exposure of any sectors or regions in which the investments target. In addition, the investments held in thematic customizations may not meet the desired positive impact or become subject to negative publicity; these types of events may cause the customizations to have poor performance due to the concentration of assets. There is no assurance that the customizations or the strategies will meet their objectives.
BLOOMBERG® is a trademark and service mark of Bloomberg Finance L.P. and its affiliates (collectively “Bloomberg”). Bloomberg does not approve or endorse this material or guarantees the accuracy or completeness of any information herein, or makes any warranty, express or implied, as to the results to be obtained therefrom and, to the maximum extent allowed by law, neither shall have any liability or responsibility for injury or damages arising in connection therewith.
The S&P500 Index (“Index”) and associated data is a product of S&P Dow Jones Indices LLC, its affiliates and/or their licensors and has been licensed for use by Breckinridge. © 2025 S&P Dow Jones Indices LLC, its affiliates, and/or their licensors. All rights reserved. Redistribution or reproduction in whole or in part are prohibited without written permission of S&P Dow Jones Indices LLC. For more information on any of S&P Dow Jones Indices LLC’s indices please visit www.spdji.com. S&P® is a registered trademark of Standard & Poor’s Financial Services LLC (“SPFS”) and Dow Jones® is a registered trademark of Dow Jones Trademark Holdings LLC (“Dow Jones”). Neither S&P Dow Jones Indices LLC, SPFS, Dow Jones, their affiliates nor their licensors (“S&P DJI”) make any representation or warranty, express or implied, as to the ability of any index to accurately represent the asset class or market sector that it purports to represent and S&P DJI shall have no liability for any errors, omissions, or interruptions of any index or the data included therein.


Subscribe to Insights
Sign up to receive curated insights directly in your inbox.


