
The following commentary is a summary of discussions among members of the Breckinridge Capital Advisors Investment Committee as they reviewed monthly activity in the markets and investment returns. The members of the Investment Committee, under the leadership of Co-Chief Investment Officers Matthew Buscone and Jeffrey Glenn, CFA, are Co-Heads of Research, Nicholas Elfner and Adam Stern, J.D., M.P.A.; and Portfolio Manager and Director, Corporate Research, Josh Perez, CFA.
Market Review
Market sentiment in March was shaped by geopolitical developments, most notably the escalation of the conflict involving Iran, which contributed to a sharp increase in oil prices and renewed inflation concerns. Crude oil prices surpassed $100 per barrel at times, adding upward pressure to headline inflation and complicating the macroeconomic outlook. At the same time, underlying economic data pointed to a slowing but still resilient U.S. economy. Labor market conditions remained mixed, with payroll growth exceeding expectations one month, but falling short in another, while consumer spending showed signs of moderation and business investment trends were mixed.
The U.S. Treasury curve shifted higher across the maturity spectrum with yields rising approximately 40bps in the 2- through 10-year range and 30bps on the long end (See Figure 1). The move reflected persistent inflation pressures and a shift in market sentiment regarding the lower likelihood of a Federal Reserve (Fed) cut in 2026.

Rate volatility increased meaningfully during the month, with the ICE Bank of America/Merrill Lynch Option Volatility Estimate (MOVE) Index,6 reaching its highest levels since April 2025 (See Figure 2), reflecting uncertainty around inflation, monetary policy, and geopolitical risks.

The Investment Committee expects the Fed to remain on hold, maintaining a target Fed funds range of 3.50 percent to 3.75 percent, with the 10-year Treasury expected to trade within a range of 4.00 percent to 4.50 percent. Elevated oil prices introduce the risk of stagflation, particularly in energy-importing regions, while U.S. growth is expected to be less impacted and improve from the low-level growth in Q4 2025.
Municipal Market Review
The BBG Managed Money Short/Intermediate Index7 posted a negative return in March, as yields rose sharply across the curve. The 10-year maturity underperformed other tenors, with yields increasing by nearly 60bps (See Figure 3).

Supply remained elevated, with approximately $55 billion in issuance during the month, bringing year-to-date totals ahead of last year’s record setting pace. Heavy issuance, combined with seasonal tax-related outflows and slower reinvestment demand, created unfavorable technical conditions.
M/T ratios increased by 5 to 8 percentage points across the curve, reflecting the sector’s underperformance relative to Treasuries (See Figure 4).

Fund flows remained positive but moderated, with municipal funds recording approximately $6.5 billion in inflows during the month, according to the Investment Company Institute (ICI). Despite near-term weakness, higher absolute yields and improved relative value are expected to support municipal performance over the remainder of the year.
Corporate Market Review
The BBG U.S. Corporate Investment Grade Index returned -1.98 percent in March, with spreads widening modestly by approximately 5bps to 89bps. Performance varied across sectors, with Chemicals, Life, and Pharmaceuticals among the best performers, while Leisure, Automotive, and Home Construction lagged.
Issuance remained robust at $228 billion for the month, representing a year-over-year increase of approximately 12 percent. Net issuance totaled $96.8 billion after accounting for redemptions. Fund flows were supportive, with taxable bond inflows reaching $53 billion over the past 30 days.
Credit fundamentals remain stable, supported by solid earnings, revenue growth, and cost discipline. However, risks are emerging in lower-quality segments, particularly in subprime lending and private credit markets, while increased merger and acquisition activity may pressure credit quality over time.
Securitized Market Review
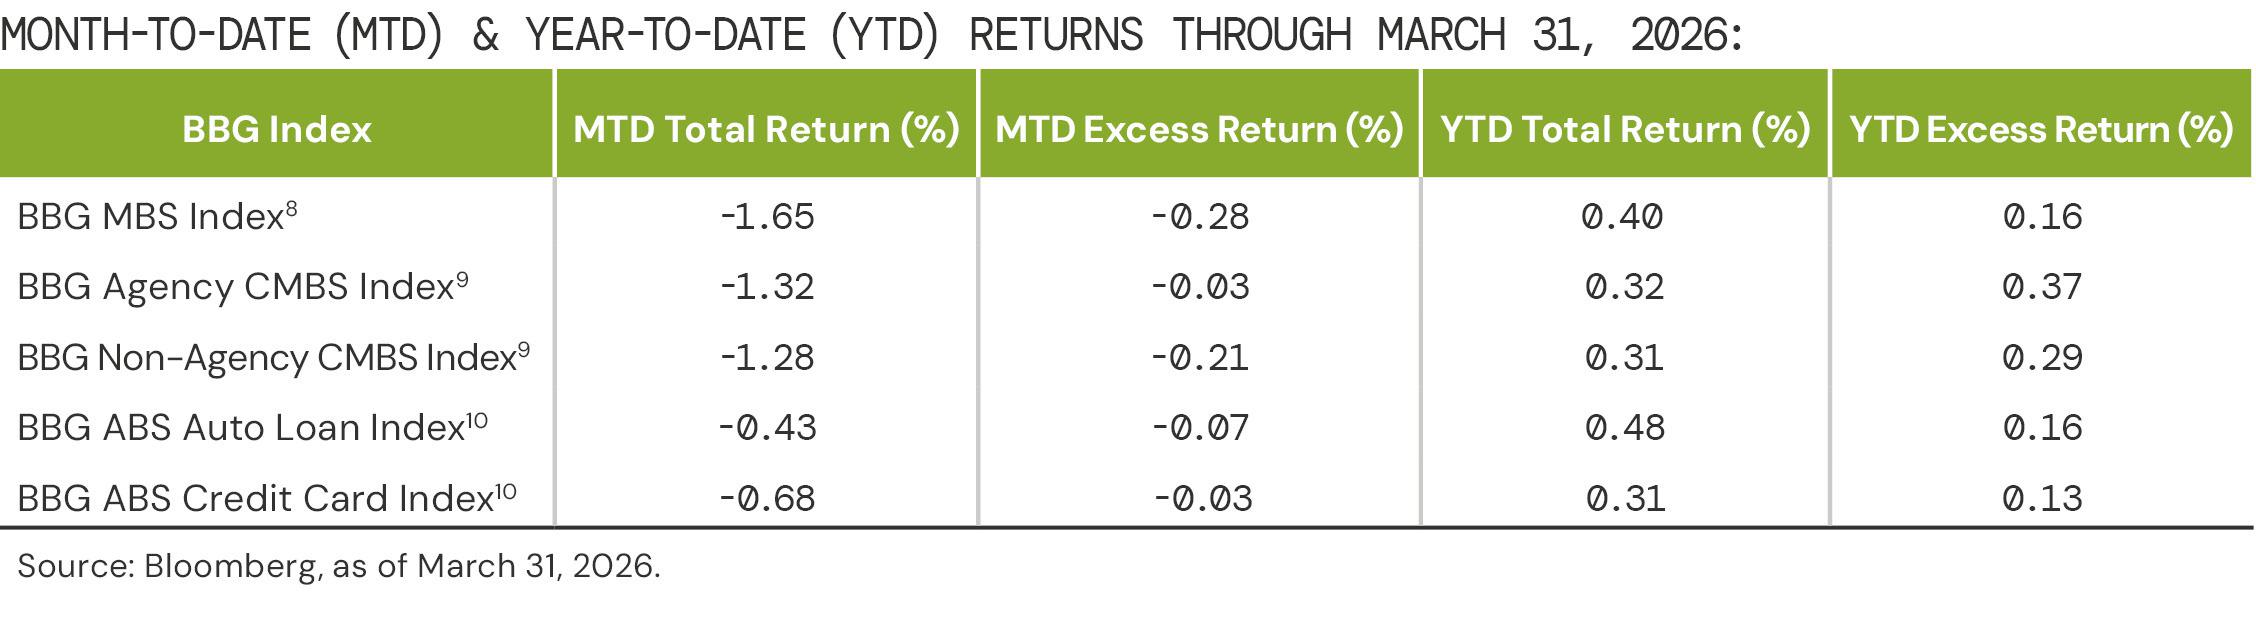
Securitized sectors generated negative returns in March, with MBS returning negative 1.65 percent and ABS returning negative 0.80 percent.
Commercial mortgage-backed securities (CMBS) were comparatively resilient, particularly Agency CMBS, which benefited from safe-haven demand.
ABS spreads widened by approximately 4bps, with weaker performance in auto loan subsectors relative to credit cards.
Overall, securitized markets were pressured by higher rates, increased volatility, and concerns about consumer health and economic dispersion.
Equity Market Review
The S&P 500 declined 4.98 percent in March, reflecting a broad-based risk-off environment driven by rising geopolitical tensions and higher energy prices.
Volatility increased significantly, with the Chicago Board Options Exchange (CBOE) Volatility Index (VIX) reaching its highest levels since April 2025 (See Figure 5).

Sector performance was mixed. Energy was the only sector to post gains (10.40 percent), benefiting from higher oil prices. Outperforming sectors included Utilities (-3.21 percent) and Financials (-3.56 percent), while Industrials (-8.44 percent), Health Care (-8.11 percent), and Consumer Staples (-7.39 percent) lagged.
Factor performance, when viewed from a long / short construct, showed modest outperformance by high dividend yield stocks and value-oriented stocks. The Growth factor was one of the worst performers during the month, reflecting a rotation away from higher-multiple segments of the market.
Despite macroeconomic concerns, consensus expectations for 2026 earnings growth remain near 15 percent, indicating continued confidence in corporate fundamentals.11
[1] As of March 31, 2026, as measured by the Bloomberg (BBG) U.S. Treasury Bond Index, an unmanaged index of prices of U.S. Treasury bonds with maturities of 1 to 30 years. You cannot invest directly in an index
[2] The Municipal/Treasury (M/T) ratio compares yields of municipal bonds with those of U.S. Treasury bonds of the same maturity. M/T ratios can show the relative value of municipal bonds compared with taxable bonds, by indicating when yields for municipal bonds exceed the after-tax yields on taxable bonds.
[3] As of March 31, 2026, as measured by the BBG U.S. Corporate Investment Grade Bond Index, an unmanaged market-value-weighted index of investment grade corporate fixed-rate debt issues with maturities of one year or more. You cannot invest directly in an index.
[4] Investment Company Institute (ICI), Combined Estimated Taxable Bond Long-Term Flows and ETFs, 4/1/26.
[5] The S&P 500 Index consists of 500 stocks chosen for market size, liquidity, and industry group representation. Itis a market-value-weighted index with each stock’s weight in the index proportionate to its market value. Performance is as of March 31, 2026. You cannot invest directly in an index.
[6] The ICE BofA/ML Merrill Lynch Option Volatility Estimate (MOVE) Index measures U.S. interest rate volatility by tracking the movement in U.S. Treasury yield volatility implied by current prices of one-month over-the-counter options on 2-year, 5-year, 10-year and 30-year Treasuries. Historically, the index rises as concerns grow that interest rates are moving higher. You cannot invest directly in an index.
[7] Municipal bond performance is as of March 31, 2026, as measured by the BBG Managed Money Short/Intermediate (1-10) Index, which measures the performance of the publicly traded municipal bonds that cover the USD-denominated short/intermediate term tax-exempt bond market, including state and local general obligation bonds, revenue bonds, insured bonds, and pre-refunded bonds. It is rules-based, and market-value weighted. You cannot invest directly in an index.
[8] The BBG MBS Index tracks agency mortgage-backed pass-through securities (both fixed-rate and hybrid ARM) guaranteed by government-sponsored enterprises (GSEs) Government National Mortgage Association (Ginnie Mae) (GNMA), Federal National Mortgage Association (Fannie Mae) (FNMA), and Federal Home Loan Mortgage Corporation (Freddie Mac) (FHLMC). The index is constructed by grouping individual pools into aggregates or generics based on program, coupon, and vintage. You cannot invest directly in an index.
[9] The BBG U.S. CMBS Investment Grade Index measures the market of U.S. Agency (GNMA, FNMA, and (FHLMC) and U.S. Non-Agency conduit and fusion CMBS deals with a minimum current deal size of $300mn. You cannot invest directly in an index.
[10] BBG U.S. Asset-Backed Securities (ABS) Index is the ABS component of the Bloomberg U.S. Aggregate Bond Index, a flagship measure of the U.S. investment grade, fixed-rate bond market. The ABS index has three subsectors: credit and credit cards, autos, and utility. You cannot invest directly in an index.
[11] Breckinridge calculation based on Bloomberg data as of March 31, 2026
BCAI - 04092026-gziibhlu (4/9/2026)
DISCLAIMERS:
This material provides general information and should not be construed as a solicitation or offer of services or products or as legal, tax or investment advice. Nothing contained herein should be considered a guide to security selection, asset allocation or portfolio construction.
All information and opinions are current as of the dates indicated and are subject to change. Breckinridge believes the data provided by unaffiliated third parties to be reliable but investors should conduct their own independent verification prior to use. Some economic and market conditions contained herein have been obtained from published sources and/or prepared by third parties, and in certain cases have not been updated through the date hereof.
There is no assurance that any estimate, target, projection or forward-looking statement (collectively, “estimates”) included in this material will be accurate or prove to be profitable; actual results may differ substantially. Breckinridge estimates are based on Breckinridge’s research, analysis and assumptions. Other events that were not considered in formulating such projections could occur and may significantly affect the outcome, returns or performance.
Not all securities or issuers mentioned represent holdings in client portfolios. Some securities have been provided for illustrative purposes only and should not be construed as investment recommendations. Any illustrative engagement or sustainability analysis examples are intended to demonstrate Breckinridge’s research and investment process.
Yields and other characteristics are metrics that can help investors in valuing a security, portfolio or composite. Yields do not represent performance results but they are one of several components that contribute to the return of a security, portfolio or composite. Yields and other characteristics are presented gross of advisory fees.
All investments involve risk, including loss of principal. No investment or risk management strategy, including diversification, can guarantee positive results or risk elimination in any market. Periods of elevated market volatility can significantly impact the value of securities. Investors should consult with their advisors to understand how these risks may affect their portfolios and to develop a strategy that aligns with their financial goals and risk tolerances.
Past performance is not indicative of future results. Breckinridge makes no assurances, warranties or representations that any strategies described herein will meet their investment objectives or incur any profits. Performance results for Breckinridge’s investment strategies include the reinvestment of interest and any other earnings, but do not reflect any brokerage or trading costs a client would have paid. Results may not reflect the impact that any material market or economic factors would have had on the accounts during the time period. Due to differences in client restrictions, objectives, cash flows, and other such factors, individual client account performance may differ substantially from the performance presented.
Actual client advisory fees may differ from the advisory fee used to calculate net performance results. Client returns will be reduced by the advisory fees and any other expenses incurred in the management of their accounts. For example, an advisory fee of 1 percent compounded over a 10-year period would reduce a 10 percent return to a 9 percent annual return. Additional information on fees can be found in Breckinridge’s Form ADV Part 2A.
Index results are shown for illustrative purposes and do not represent the performance of any specific investment. Indices are unmanaged and investors cannot directly invest in them. They do not reflect any management, custody, transaction or other expenses, and generally assume reinvestment of dividends, income and capital gains. Performance of indices may be more or less volatile than any investment strategy.
Fixed income investments have varying degrees of credit risk, interest rate risk, default risk, and prepayment and extension risk. In general, bond prices rise when interest rates fall and vice versa.
Equity investments are volatile and can decline significantly in response to investor reception of the issuer, market, economic, industry, political, regulatory or other conditions.
BLOOMBERG® is a trademark and service mark of Bloomberg Finance L.P. and its affiliates (collectively “Bloomberg”). Bloomberg does not approve or endorse this material or guarantees the accuracy or completeness of any information herein, or makes any warranty, express or implied, as to the results to be obtained therefrom and, to the maximum extent allowed by law, neither shall have any liability or responsibility for injury or damages arising in connection therewith.
The S&P500 Index (“Index”) and associated data is a product of S&P Dow Jones Indices LLC, its affiliates and/or their licensors and has been licensed for use by Breckinridge. © 2026 S&P Dow Jones Indices LLC, its affiliates and/or their licensors. All rights reserved. Redistribution or reproduction in whole or in part are prohibited without written permission of S&P Dow Jones Indices LLC. For more information on any of S&P Dow Jones Indices LLC’s indices please visit www.spdji.com. S&P® is a registered trademark of Standard & Poor’s Financial Services LLC (“SPFS”) and Dow Jones® is a registered trademark of Dow Jones Trademark Holdings LLC (“Dow Jones”). Neither S&P Dow Jones Indices LLC, SPFS, Dow Jones, their affiliates nor their licensors (“S&P DJI”) make any representation or warranty, express or implied, as to the ability of any index to accurately represent the asset class or market sector that it purports to represent and S&P DJI shall have no liability for any errors, omissions, or interruptions of any index or the data included therein.


Subscribe to Insights
Sign up to receive curated insights directly in your inbox.


