Sustainable
Sustainable Investing Newsletter published on January 15, 2026
The Water Footprint of AI: Implications for Investors
Summary
- AI-driven data center growth is increasing water demand, especially in water-stressed regions, with electricity generation driving most water use.
- Municipal water utilities may face higher costs and affordability pressures, as they adapt infrastructure and supplies to serve large, continuous data center customers.
- Water availability and affordability are emerging investment considerations for both municipal utilities and AI-related corporate issuers.
Artificial intelligence (AI) accounted for 50 percent to 90 percent of gross domestic product (GDP) growth in the first half of 2025.1,2 Analysts expect several more years of robust capital expenditures (capex) on data centers that make widespread AI adoption possible.3,4 For municipal and corporate investors alike, the capital intensity of the new AI economy is generating concern over elevated electricity bills and the additional demands placed on the grid. We share our views on AI and its potential impact on the utility sector and electricity bills in Quantifying Power Demand from Artificial Intelligence .
Less attention has been paid to the impact on water utilities, water supply, and water bill affordability. We believe that prudent investors should consider the impact of increased water demand and costs associated with the AI economy.
AI’s Water Demand Affects Temperate and Semi-Arid Regions
Data center demand could grow by 20 percent to 25 percent a year through 2030 by some estimates.5 Most of this growth is projected to come from “hyperscalers,” which are massive data centers designed to meet high data storage demands.6 More data centers will mean more water use.
Municipal water systems supply over 97 percent of direct water use by major data centers.7 These same systems serve a majority of U.S. households. Data centers are not as water intensive as farms or electric utilities, but municipal water systems that serve data centers can report sizable increases in water demand, especially when considering the water used in power generation. A medium-sized data center uses the same amount of water as 1,000 households, annually. Large data centers use the same as 10,000 to 50,000 people.8
Across the U.S., there are over 4,000 data centers of varying sizes, using water in both temperate and semi-arid climates.9
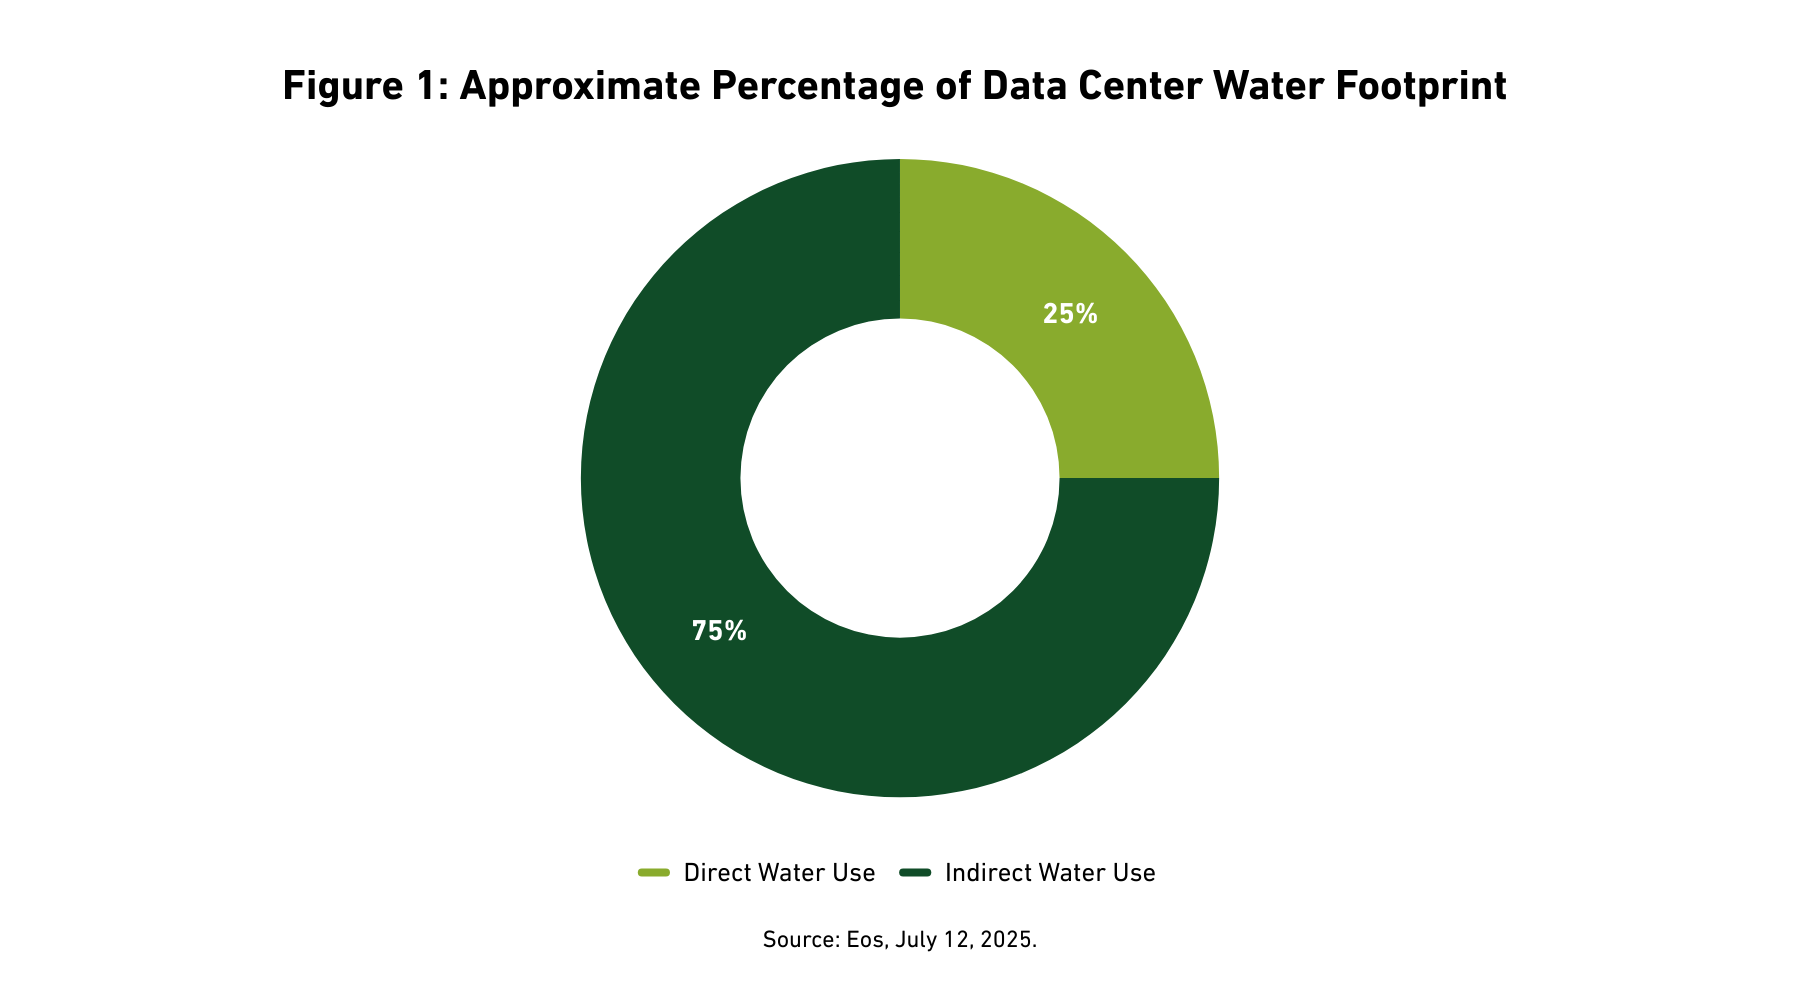
Data centers use water in two ways: direct water use for operations, and indirect water use for electricity generation or down the supply chain in chip manufacturing.8
Direct use
Water is used in operations for cooling. Through a process called “evaporative cooling”, data centers rely on water to maintain server temperatures within required ranges.10 Ideally, data centers would be entirely air-cooled, but many climates make this impossible.
Data centers in cooler climates often have lower direct water use footprints.11 But data centers need to be built everywhere to ensure reliable connectivity for users, and regions with hot and dry climates are seeing plenty of new data centers (e.g., Arizona, Texas).12
Using recycled or reclaimed water instead of potable water is another way to minimize the burden of water use on local resources, although the quality of the water used for cooling can have impacts on data center infrastructure longevity (e.g., possibly more corrosion from reclaimed water).10 Still, some data centers are being built with resiliency in mind, leveraging recycled water and closed-loop systems.
Indirect use
Indirect use comprises the majority of a data center’s water footprint. Exact water footprints are hard to measure, especially for supply chain inputs, as tech companies are not currently required to disclose water use in a standardized fashion.13 Water for energy and water for chip production, both essential inputs in data centers, can constitute a very large percentage of a single data center’s water footprint.
Water for electricity generation alone can be upwards of 75 percent of a data center’s total water use (See Figure 1).14 Water use for energy varies by the type of energy generation. Fossil fuel combustion uses the most water, while renewable energy uses less. Currently, over half of the electricity used for data centers comes from fossil fuels.8 Increased renewable energy generation can therefore also limit water use for data center operations.
Community Impacts and Investment Implications
Rapid data-centers buildout could cause water shortages in some places
Water stress is a material investment consideration for municipal and corporate bond investors. Data centers are adding additional pressure. Two-thirds of data centers built since 2022 have been in water-stressed regions.15
Data center buildout in southwestern and western U.S. states such as California, Arizona, and Texas may increase demand for already strained water resources. Notably, data centers operate 24/7, so residential users and local businesses can face depleted supplies despite limited personal water use.
Water is a local resource, too, meaning that water sources tend to be located near end users, due to logistical difficulty and expense of transporting water long distances. Some water basins located in regions with high rates of data center buildout are particularly at risk of stressing water supplies.16
Rising water bills may strain affordability
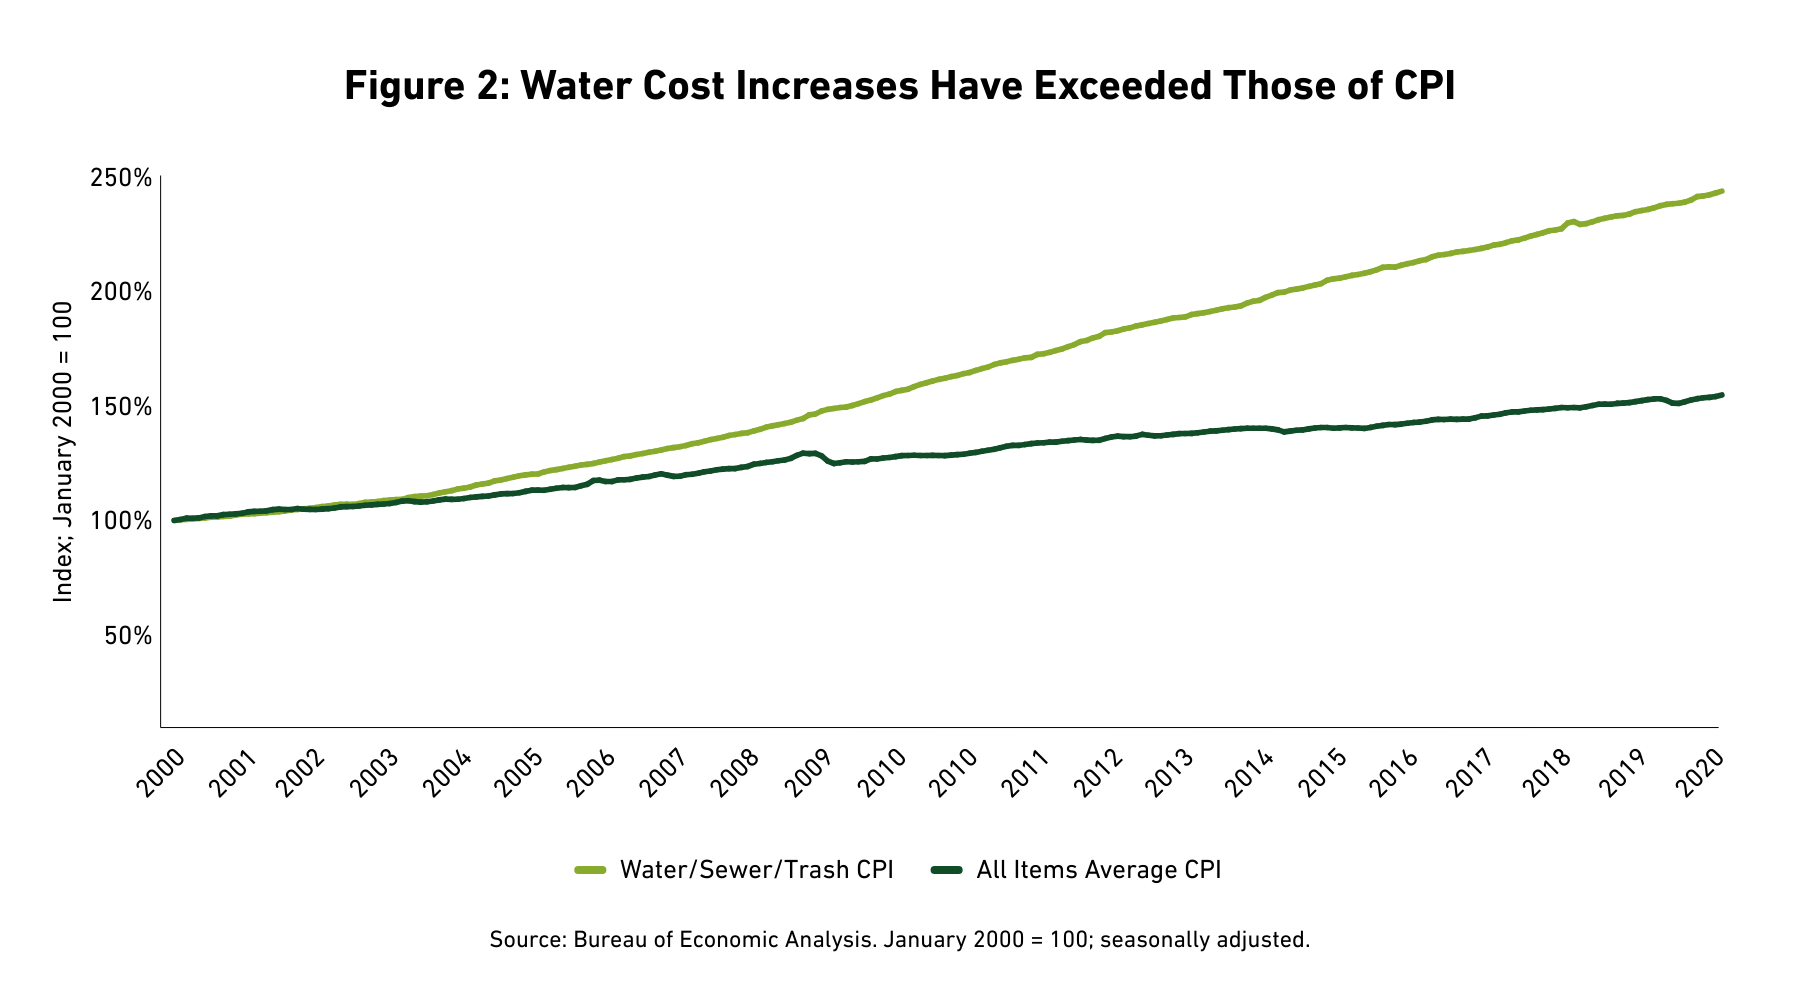
Affordability is a growing issue in the U.S., and water bills are no exception. Well before the recent surge in AI-related capex, water bills were increasing above the rate of inflation (Figure 2). Water utility cost inflation results from several factors, including drought, conservation measures, aging infrastructure, and declining federal aid.17 A 2023 study of water affordability across the U.S. found that 17 percent of U.S. households have water bills that are considered unaffordable.18
Data center water needs could force water bills higher. Utilities will need to manage limited existing supplies across existing water users. They may look to increase or diversify supplies. Others may seek to modernize infrastructure.
Large tech companies could bear relatively more of the cost, but residential and commercial ratepayers are likely to experience rising bills, as well.19 The standard cost-of-service model for municipal utilities sets water rates to cover operational and capital expenses. Under a cost-of-service model, water rates could increase for all water customers due to impacts of a data center.
AI buildouts will likely have mixed investment impact on the municipal water utility sector
Some water/sewer revenue issuers may benefit from the data center buildout. Data centers can be steady, large water system customers. Likewise, some local economies may see an influx of tax dollars and investment, which could improve socioeconomic fundamentals.
Other utilities may experience negative impacts. Investors in both general obligation and revenue sectors face water-related risks due to AI, including declining water availability, increasing resource competition, rising water rates, ratepayer fatigue, and increased strain on water infrastructure.
As recently seen in the case of Corpus Christi, water stress can result in significant credit weakening.20 Water affordability could become a more material risk as well. We updated our water/sewer revenue bond sustainability framework in 2024 to better account for water affordability and ability of ratepayers to pay (Enhanced Breckinridge Water/Sewer Sustainability Framework Flows From Continuous Improvement Focus).
Investors should look for disclosure about AI and data center operations, especially in water-stressed regions and for utilities with less affordable water.
AI presents risks and opportunities for corporate bond investors
Corporate bond investors in AI-related industries can benefit from more scrutiny of water use by data centers. We already are seeing tech companies face potential reputational risks related to strains on water basins and increasing water bills.21 Residential and commercial water customers impacted by a data center’s water use could publicly push back against operations. Households that use private wells can also be impacted by nearby data centers. Recent reports have highlighted the potential for sediment buildup to impact private wells for households adjacent to data centers.22
Innovation in water efficiency will be vital for tech companies. Investors in AI-related industries should look for increased use of renewables, which could significantly reduce a data center’s water footprint. Investors should also look for direct-water use resiliency improvements, such as water recycling, closed-loop systems, and alternatives to water for cooling. Immersion cooling, which uses specialized substances for cooling in place of water, has promise, but environmental impacts are a concern, namely forever chemicals (such as PFAS).23
Conclusion
Water stress is a material investment consideration for municipal and corporate bond investors. AI-related data center buildout, including burgeoning hyperscaler demand, will likely require additional investor attention on water availability and water affordability, despite the potential economic benefits. For the municipal sector, data center buildout could increase water demand and adversely affect residential and commercial water affordability. Corporate bond issuers in water-intensive industries could see increased costs for operations on account of reduced water supply or increased water rates in certain locations. Tech issuers contributing to data center buildout could face reputational risks, but also have ample opportunity for innovation.
To enhance considerations of water affordability and ratepayers’ ability to pay, Breckinridge updated our water/sewer municipal sector sustainability framework. Water stress is considered for municipal and corporate bond issuers when deemed material by analysts. Investors can look for risk exposures and mitigation strategies that reflect an issuer’s understanding of the investment implications of higher water demand, especially in temperate and semi-arid regions, that will accompany AI-related data center buildouts.
[1] Konrad Putzier, “How the U.S. Economy Became Hooked on AI Spending,” The Wall Street Journal, November 24, 2025.
[2] Ben Casselman and Sydney Ember, “The A.I. Boom Is Driving the Economy. What Happens if It Falters?,” The New York Times, November 22, 2025.
[3] “Gartner Says Worldwide AI Spending Will Total $1.5 Trillion in 2025,” Gartner, Inc., September 17,2025.
[4] “AI market projected to hit $4.8 trillion by 2033, emerging as dominant frontier technology,” United Nations Conference on Trade and Development, April 7, 2025.
[5] “The data center balance: How US states can navigate the opportunities and challenges,” McKinsey & Company, August 8, 2025.
[6] Phill Powell, Ian Smalley, “What is a hyperscale data center?,” IBM Think, as of December 31, 2025.
[7] “U.S. Water-Related Expenditures for Data Centers to Exceed US$4.1 Billion Through 2030,” Bluefield Research, June 23, 2025.
[8] Miguel Yañez-Barnuevo “Data Centers and Water Consumption,” Environmental and Energy Study Institute, June 25, 2025.
[9] Rebecca Leppert, “What we know about energy use at U.S. data centers amid the AI boom,” Pew Research Center, October 24, 2025.
[10] By Rasheed Ahmad, Ph.D., P.E., M.ASCE, “Engineers often need a lot of water to keep data centers cool,” American Society of Civil Engineers, March 4, 2024.
[11]A water footprint is a measurement of the total amount of water used to produce a good or service. It includes water used directly in production and water used indirectly, such as in power generation or along the supply chain. Indirect water use is much harder to accurately measure.
[12] Victor Laudisio, Henrik Cotran, Natalie Wu, Francesca Pisaroni, “Beneath the surface: Water stress in data centers,” S&P Global Ratings, September 15, 2025.
[13] Emily Kwong, Regina G. Barber, Hannah Chin, Rebecca Ramirez, “Why the true water footprint of AI is so elusive,” NPR, May 7, 2025.
[14] Andrew Chapman, “U.S. Data Centers Rely on Water from Stressed Basins,” Eos, July 12, 2025.
[15] Leonardo Nicoletti, Michelle Ma, Dina Bass, “AI Is Draining Water from Areas That Need It Most,” Bloomberg, May 8, 2025.
[16] Jon Gorey, “Data Drain: The Land and Water Impacts of the AI Boom,” Lincoln Institute of Land Policy, October 17, 2025.
[17] Hannah Stratton, Heidi Fuchs, Yuting Chen, Camilla Dunham, Alison Williams, “Water and Wastewater Rate Hikes Outpace CPI,” Lawrence Berkeley National Laboratory, May 2016.
[18] Lauren A. Patterson, Sophia A. Bryson, Martin W. Doyle, “Affordability of household water services across the United States,” PLOS Water, May 10, 2023.
[19] li Tan, “Their Water Taps Ran Dry When Meta Built Next Door,” The New York Times, July 15, 2025..
[20] Karen Pierog, “Moody's downgrades Corpus Christi's ratings over water woes,” The Bond Buyer, December 12, 2025.
[21] Molly Taft, “New Report Indicates a Growing Public Resistance to Data Centers,” Mother Jones, November 18, 2025.
[22] Michelle Fleury, Nathalie Jimenez, “I can't drink the water' - life next to a US data centre,” BBC, July 10, 2025.
[23] Molly Taft, “The Trump administration’s data center push could open the door for new forever chemicals,” Grist, December 7, 2025.
BCAI-01122026-xyeu3ti7 (1/14/2026)
DISCLAIMERS:
The content is intended for investment professionals and institutional investors.
This material provides general information and should not be construed as a solicitation or offer of services or products or as legal, tax or investment advice. Nothing contained herein should be considered a guide to security selection, asset allocation or portfolio construction.
All information and opinions are current as of the dates indicated and are subject to change. Breckinridge believes the data provided by unaffiliated third parties to be reliable but investors should conduct their own independent verification prior to use. Some economic and market conditions contained herein have been obtained from published sources and/or prepared by third parties, and in certain cases have not been updated through the date hereof.
There is no assurance that any estimate, target, projection or forward-looking statement (collectively, “estimates”) included in this material will be accurate or prove to be profitable; actual results may differ substantially. Breckinridge estimates are based on Breckinridge’s research, analysis and assumptions. Other events that were not considered in formulating such projections could occur and may significantly affect the outcome, returns or performance.
Not all securities or issuers mentioned represent holdings in client portfolios. Some securities have been provided for illustrative purposes only and should not be construed as investment recommendations. Any illustrative engagement or sustainability analysis examples are intended to demonstrate Breckinridge’s research and investment process.
Yields and other characteristics are metrics that can help investors in valuing a security, portfolio or composite. Yields do not represent performance results but they are one of several components that contribute to the return of a security, portfolio or composite. Yields and other characteristics are presented gross of advisory fees.
All investments involve risk, including loss of principal. No investment or risk management strategy, including diversification, can guarantee positive results or risk elimination in any market. Periods of elevated market volatility can significantly impact the value of securities. Investors should consult with their advisors to understand how these risks may affect their portfolios and to develop a strategy that aligns with their financial goals and risk tolerances.
Active investing generally involves more risks than laddered strategies because active managers may take on greater market risk to outperform their index. There is no guarantee that either passive or active investing will achieve their objectives. Active strategies also tend to have higher management fees and operating costs than passive strategies. Investors should consider all the differences and risks before making any investment decisions. Active management does not guarantee a profit or protect against a loss.
Past performance is not indicative of future results. Breckinridge makes no assurances, warranties or representations that any strategies described herein will meet their investment objectives or incur any profits. Performance results for Breckinridge’s investment strategies include the reinvestment of interest and any other earnings, but do not reflect any brokerage or trading costs a client would have paid. Results may not reflect the impact that any material market or economic factors would have had on the accounts during the time period. Due to differences in client restrictions, objectives, cash flows, and other such factors, individual client account performance may differ substantially from the performance presented.
Actual client advisory fees may differ from the advisory fee used to calculate net performance results. Client returns will be reduced by the advisory fees and any other expenses incurred in the management of their accounts. For example, an advisory fee of 1 percent compounded over a 10-year period would reduce a 10 percent return to a 9 percent annual return. Additional information on fees can be found in Breckinridge’s Form ADV Part 2A.
Index results are shown for illustrative purposes and do not represent the performance of any specific investment. Indices are unmanaged and investors cannot directly invest in them. They do not reflect any management, custody, transaction or other expenses, and generally assume reinvestment of dividends, income and capital gains. Performance of indices may be more or less volatile than any investment strategy.
Fixed income investments have varying degrees of credit risk, interest rate risk, default risk, and prepayment and extension risk. In general, bond prices rise when interest rates fall and vice versa.
Equity investments are volatile and can decline significantly in response to investor reception of the issuer, market, economic, industry, political, regulatory or other conditions.
There is no guarantee that integrating sustainability factors, including those associated with climate risks, will improve risk-adjusted returns, lower portfolio volatility over any specific time period, or outperform the broader market or other strategies that do not utilize sustainability factors when selecting investments. The consideration of sustainability factors may limit investment opportunities available to a portfolio. In addition, sustainability data often lacks standardization, consistency and transparency and for certain companies such data may not be available, complete or accurate.
When considering sustainability factors, Breckinridge's investment team will include those factors that they believe are material. However, the investment team may conclude that other attributes outweigh these considerations when making investment decisions. Breckinridge can change its sustainability analysis methodology at any time.
Breckinridge’s sustainability analysis is based on third party data and Breckinridge analysts’ internal analysis. Analysts will review a variety of sources such as corporate sustainability reports, data subscriptions, and research reports to obtain available metrics for internally developed frameworks. Qualitative information is obtained from company reports, engagement discussion with corporate management teams, among others.
Breckinridge believes the data provided by unaffiliated third parties, including rating agencies, to be reliable but investors should conduct their own independent verification prior to use. Some economic and market conditions contained herein have been obtained from published sources and/or prepared by third parties, and in certain cases have not been updated through the date hereof. All information contained herein is subject to revision. Any third-party websites included in the content has been provided for reference only, and does not necessarily indicate an endorsement.
BLOOMBERG® is a trademark and service mark of Bloomberg Finance L.P. and its affiliates (collectively “Bloomberg”). Bloomberg does not approve or endorse this material or guarantees the accuracy or completeness of any information herein, or makes any warranty, express or implied, as to the results to be obtained therefrom and, to the maximum extent allowed by law, neither shall have any liability or responsibility for injury or damages arising in connection therewith.
The S&P500 Index (“Index”) and associated data is a product of S&P Dow Jones Indices LLC, its affiliates and/or their licensors and has been licensed for use by Breckinridge. © 2025 S&P Dow Jones Indices LLC, its affiliates and/or their licensors. All rights reserved. Redistribution or reproduction in whole or in part are prohibited without written permission of S&P Dow Jones Indices LLC. For more information on any of S&P Dow Jones Indices LLC’s indices please visit www.spdji.com. S&P® is a registered trademark of Standard & Poor’s Financial Services LLC (“SPFS”) and Dow Jones® is a registered trademark of Dow Jones Trademark Holdings LLC (“Dow Jones”). Neither S&P Dow Jones Indices LLC, SPFS, Dow Jones, their affiliates nor their licensors (“S&P DJI”) make any representation or warranty, express or implied, as to the ability of any index to accurately represent the asset class or market sector that it purports to represent and S&P DJI shall have no liability for any errors, omissions, or interruptions of any index or the data included therein.