Municipal
Perspective published on July 18, 2025
Municipal Market: 2025 Mid-Year Outlook
Summary
- Influences spanning government, regulatory and trade policy, market technicals and sector fundamentals shaped the municipal bond market through June 2025.
- We expect potential shifts in bond issuance, judicial reviews of executive office initiatives and evolving economic conditions to influence the market going forward.
- For the second half of 2025, we see a compelling case for tax-exempt bonds due to tax-free yields at multiyear highs, limited ratings risk for most A and AA-rated bonds and greater clarity on tax policy.
The investment grade (IG) municipal bond market through the first six months of 2025 (1H2025) has been characterized by:
- Stable but ebbing credit fundamentals;
- Heightened federal government risk;
- Record new issue supply;
- Market-moving fund flows;
- A steeper yield curve; and
- Returns driven by duration and sector distinctions.
We anticipate a few key themes to define the second half of 2025 (2H2025), including:
- A slowdown in issuance, as tax risk wanes and some sectors feel less pressure to accelerate borrowing plans.
- New court rulings that could clarify the scope of executive power over grant funding for states, local governments and nonprofits.
- The growth-versus-inflation debate. Slower growth may result in Federal Reserve (Fed) interest rate cuts and stronger longer tenor returns. However, markets could remain skittish about longer term rates, as a result of growing fiscal deficits.
Fundamentals
Through 1H2025, credit fundamentals remained stable but showed signs of ebbing.
Ratings.
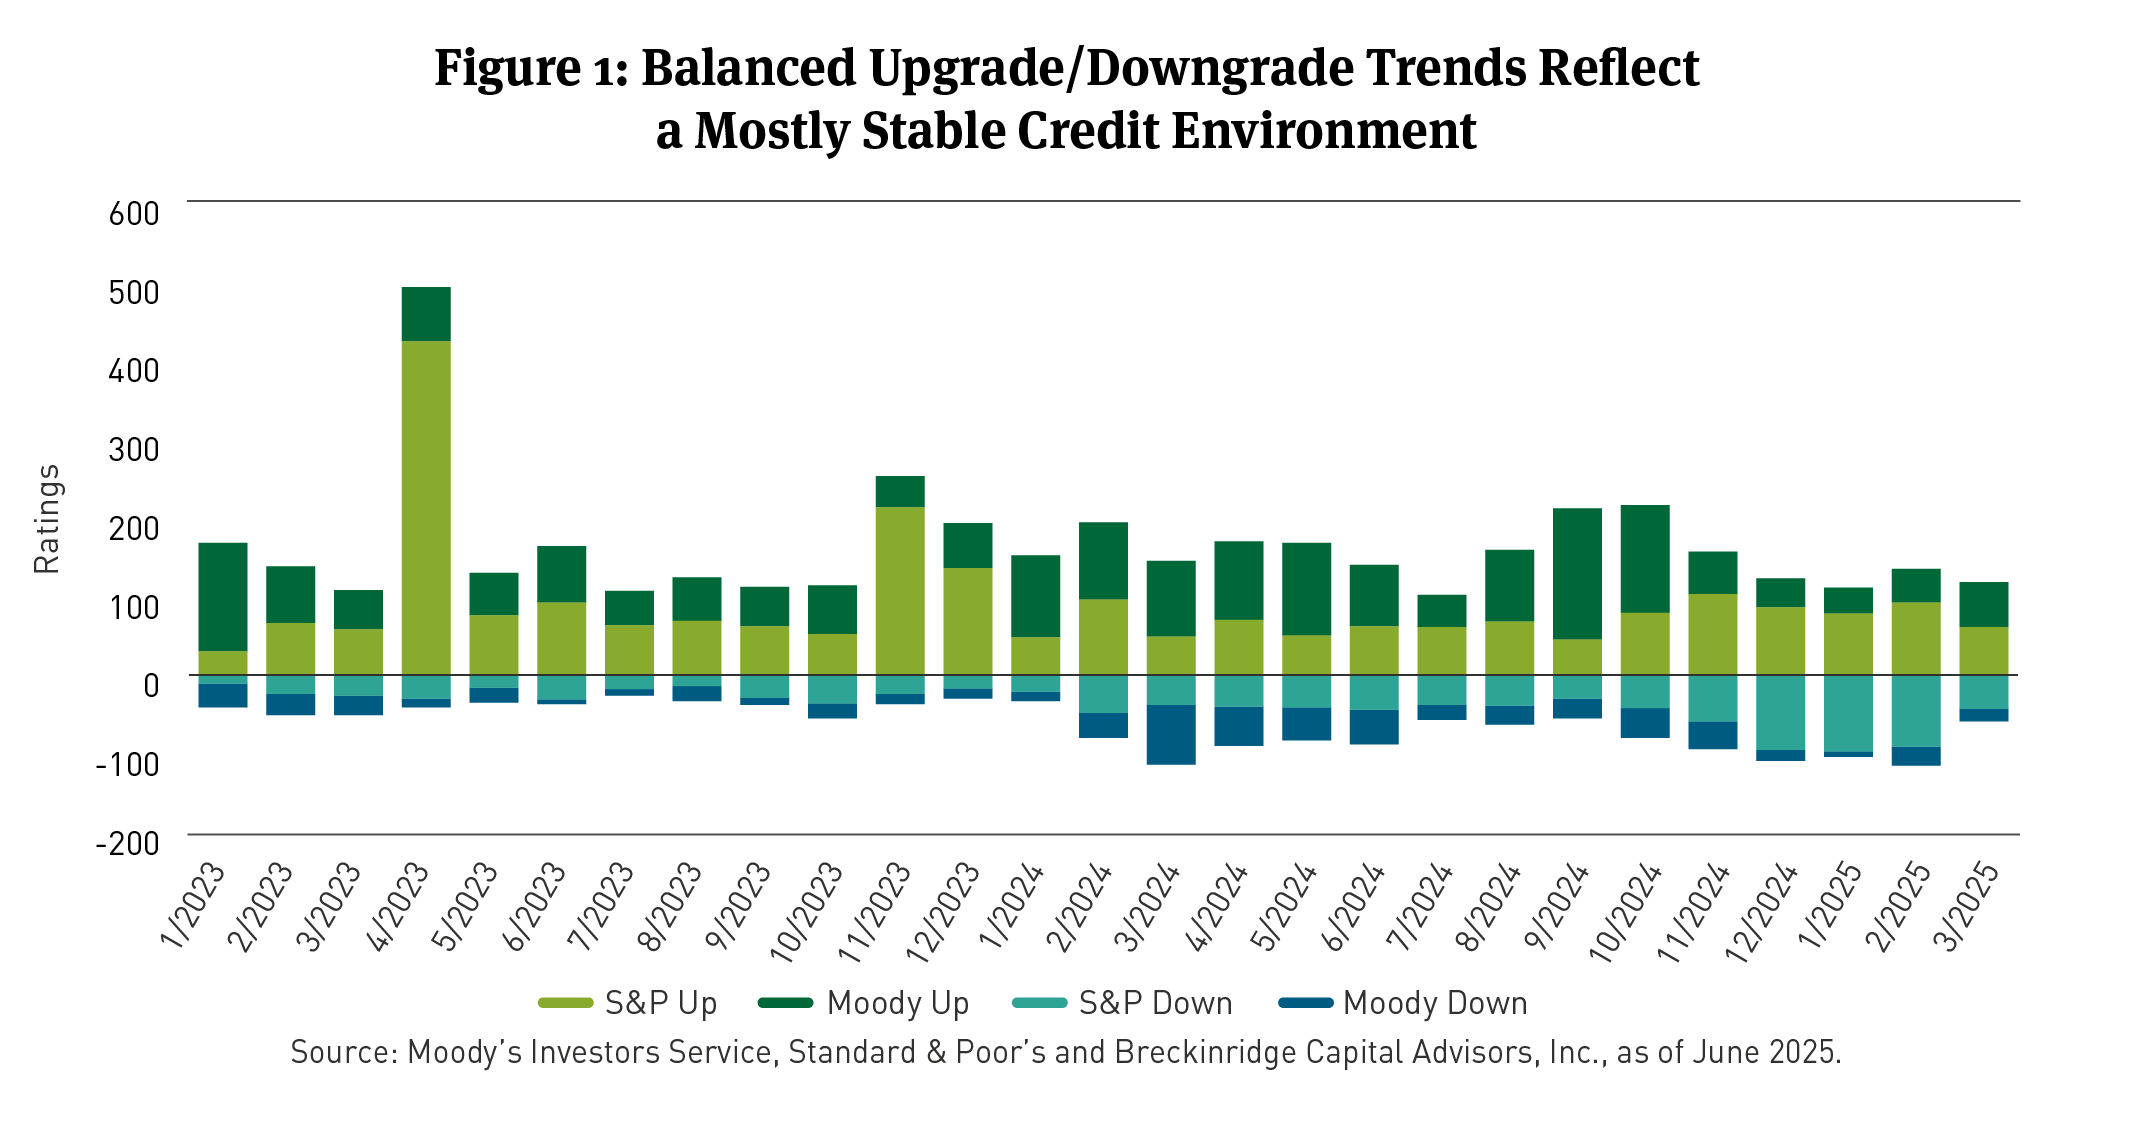
Overall, public finance upgrades and downgrades were broadly balanced from the two major rating agencies (See Figure 1).
However, upgrades barely outpaced downgrades at Standard & Poor’s (S&P), 341 to 337. Downgrades exceeded upgrades in the Higher Education, Hospital, Water-Sewer and Public Power sectors.1
At Moody’s Investors Service, upgrades outpaced downgrades by 2.8x in the first quarter, but four sector outlooks were changed to “negative,” including for Higher Education, Ports, Airports and Nonprofits.
Default rates.
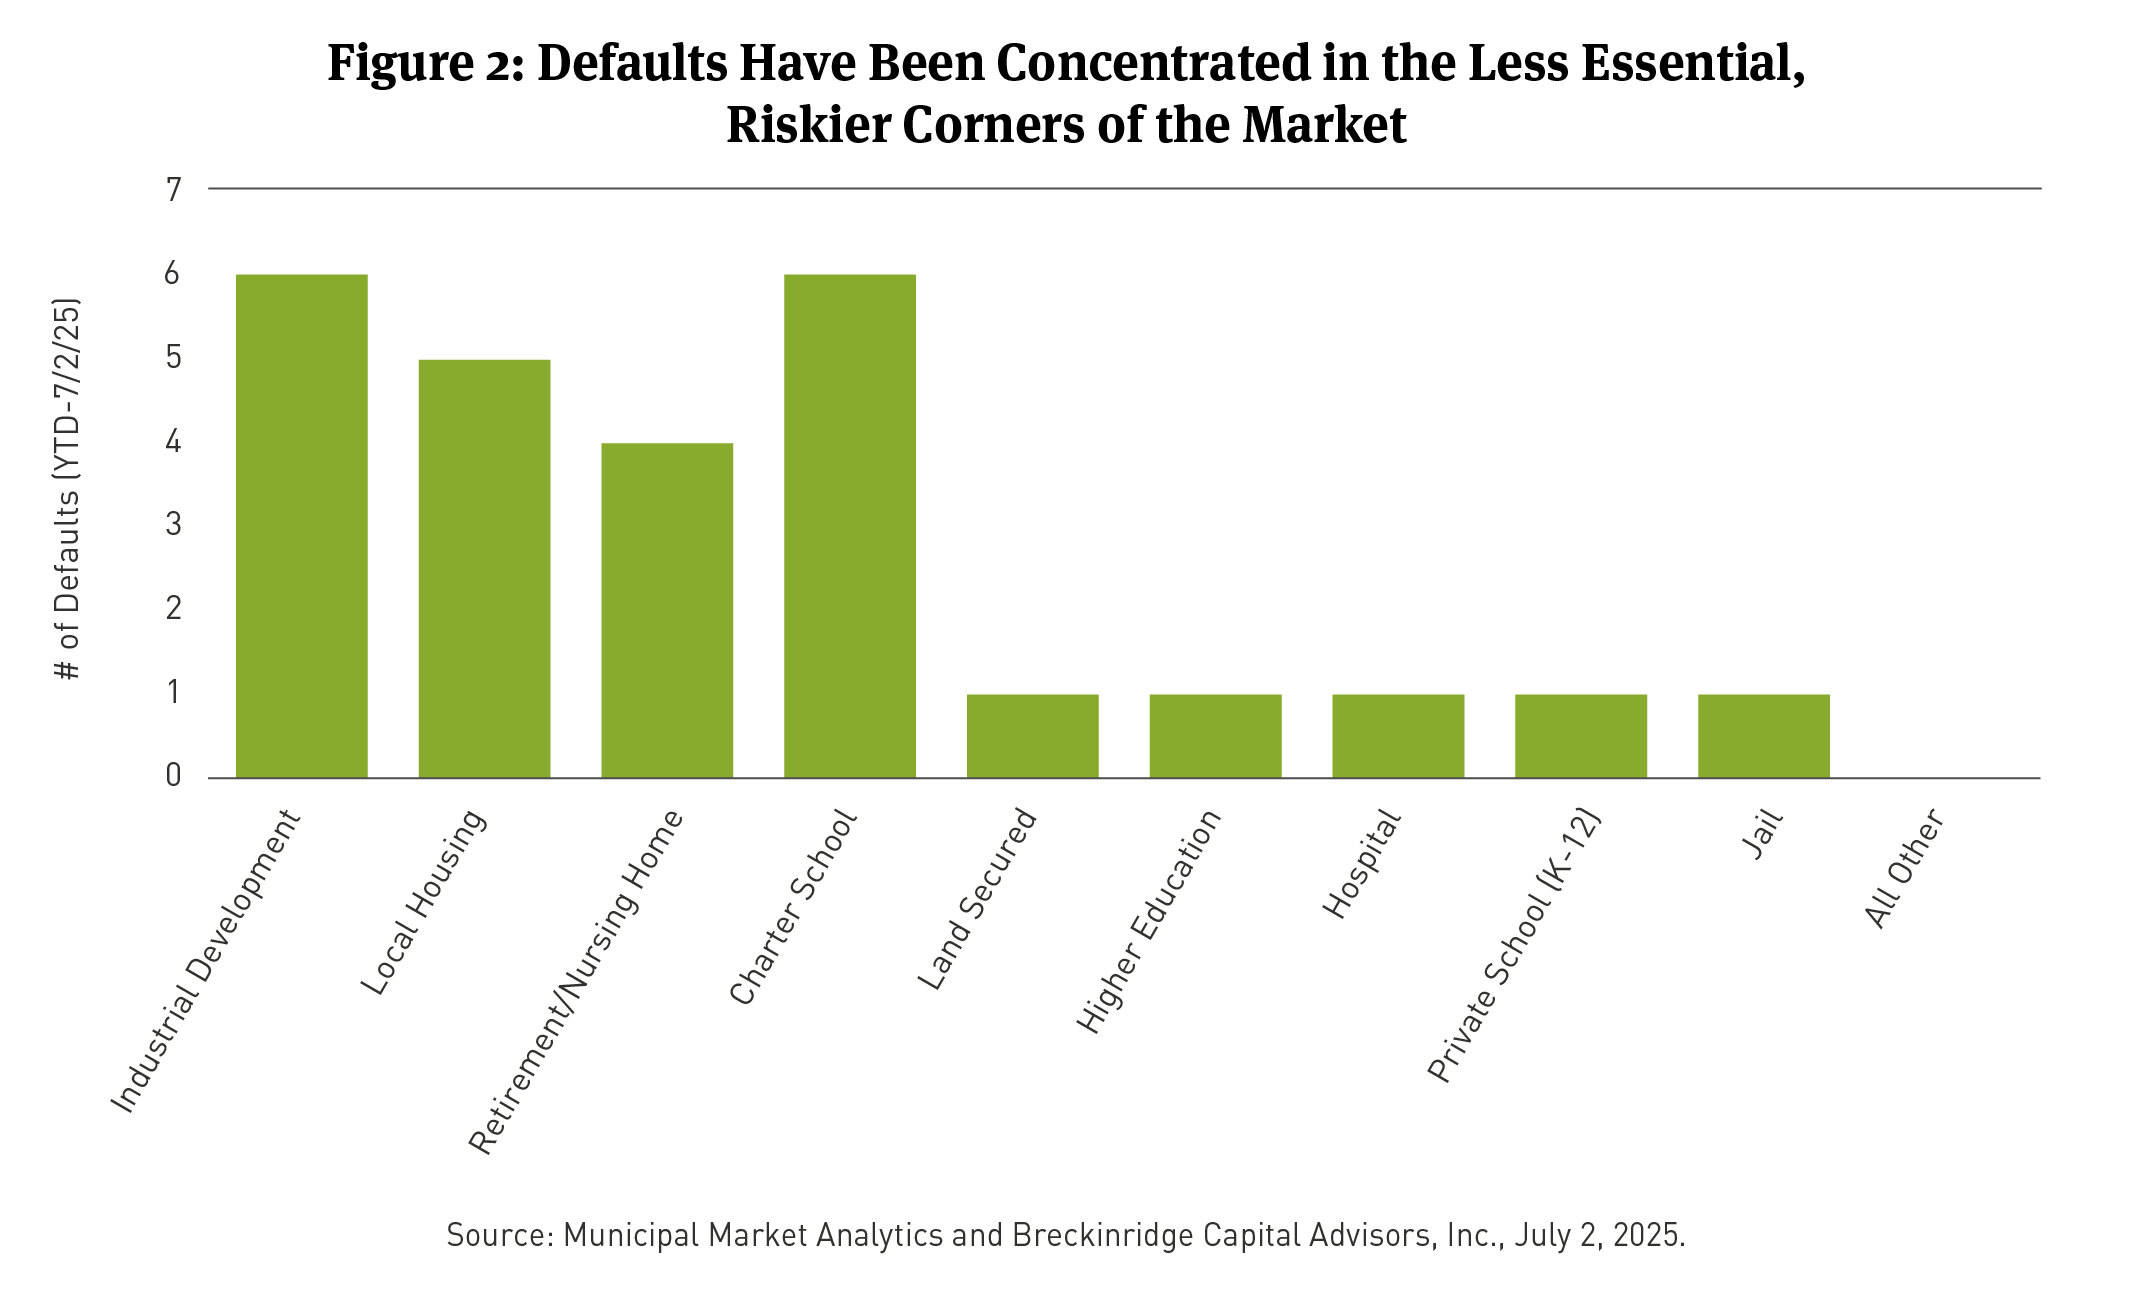
On current trend, 2025 is on pace to finish just behind 2017 and 2018 as the lowest year for defaults since 2010.2 There have been only 26 defaults3 year-to-date (YTD), all in riskier sectors (See Figure 2).
State and local government aggregates.
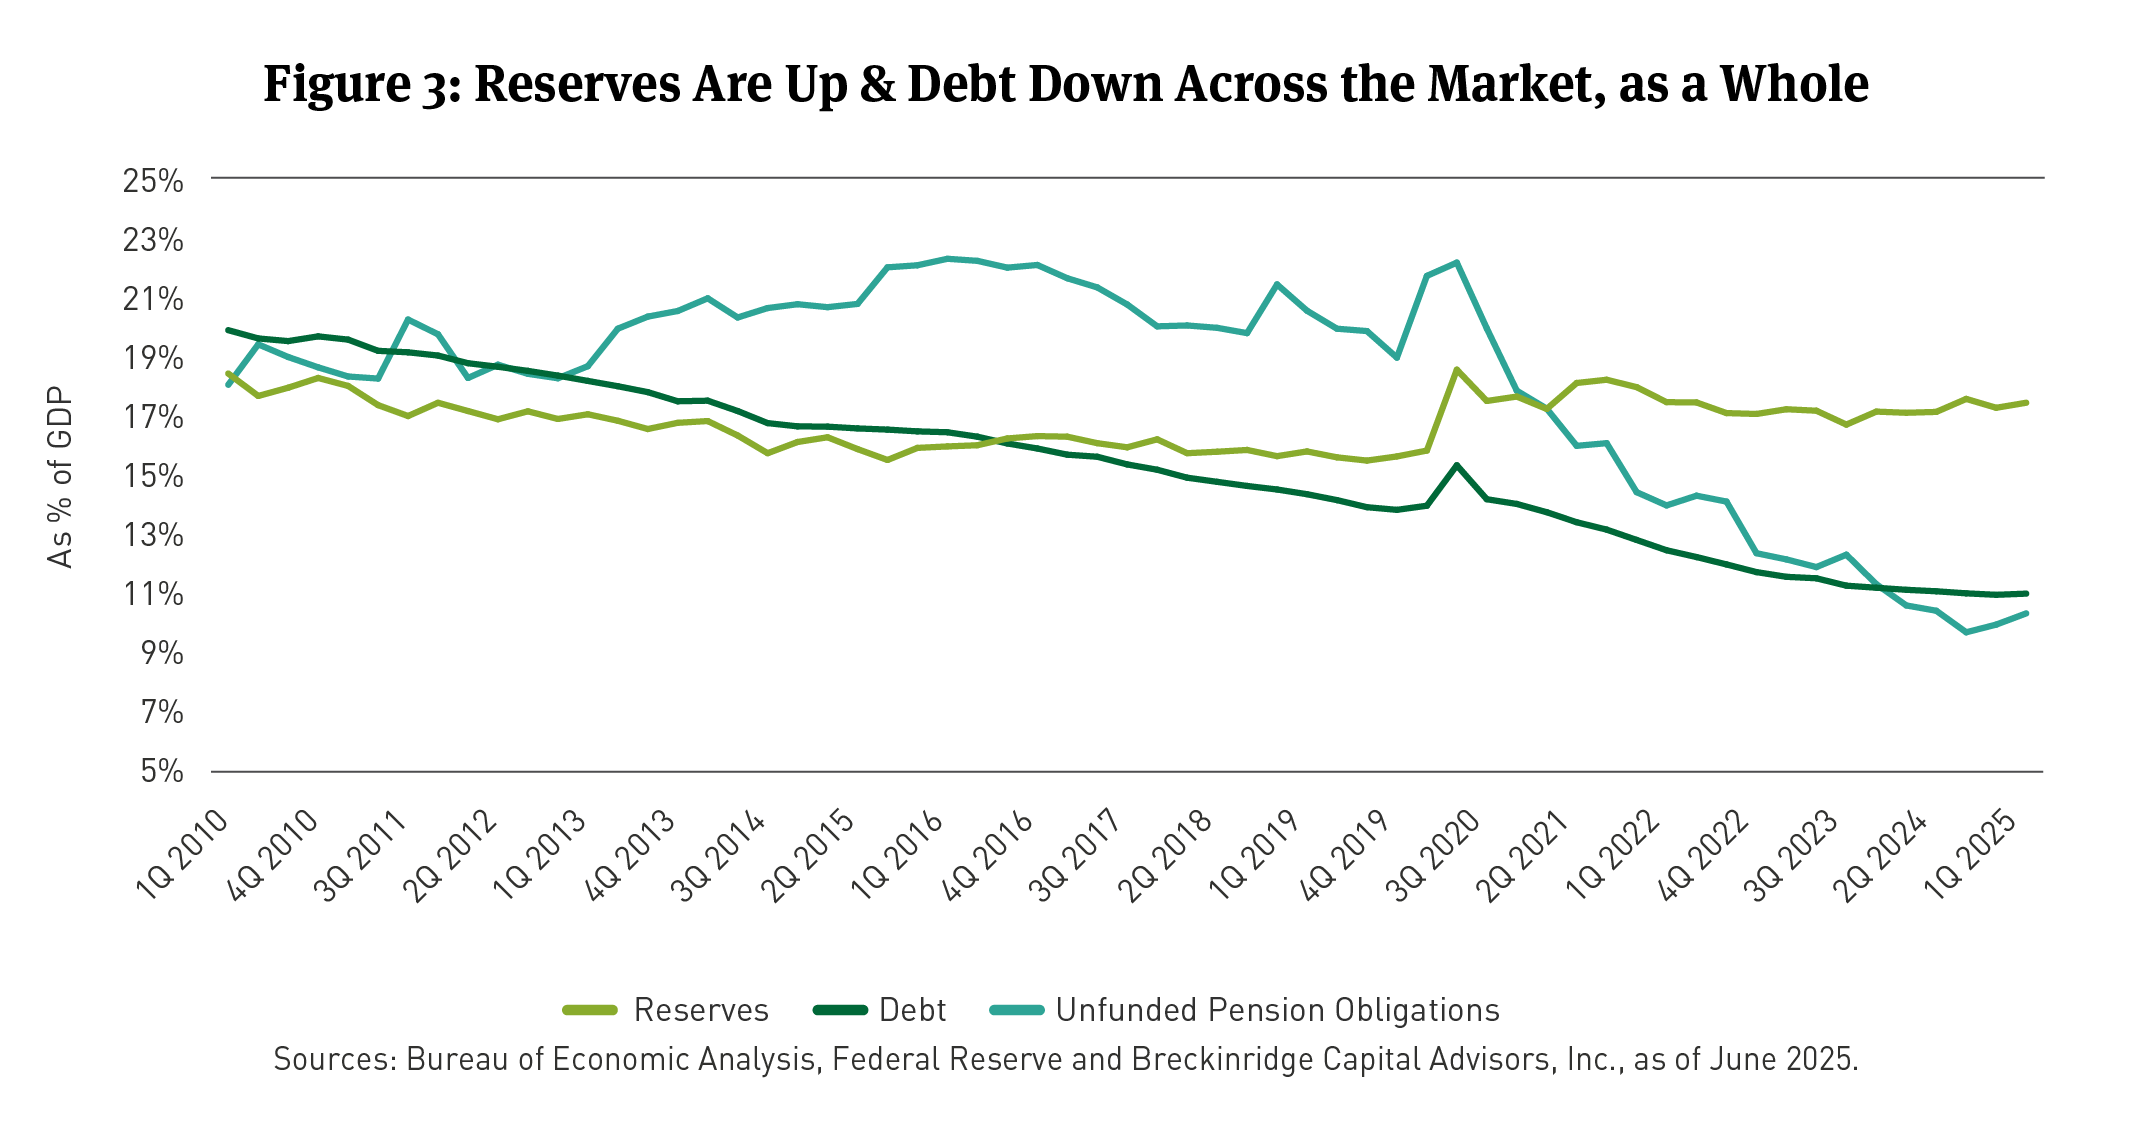
Broad measures of state and local credit stability support current rating and default patterns. State and local governments exhibit stronger reserves, lower debt ratios and lower unfunded pension obligations relative to the recent past (See Figure 3). We anticipate state and local government credit quality will level off in the coming quarters. For example, out-year budget gaps in New York City and Chicago highlight the challenges issuers may face as pandemic-era balances roll off.4
Federal risk.
Federal policies have negatively impacted credit quality via regulatory changes and proposed Medicaid cuts. However, the market avoided unfriendly muni-relevant tax reforms.
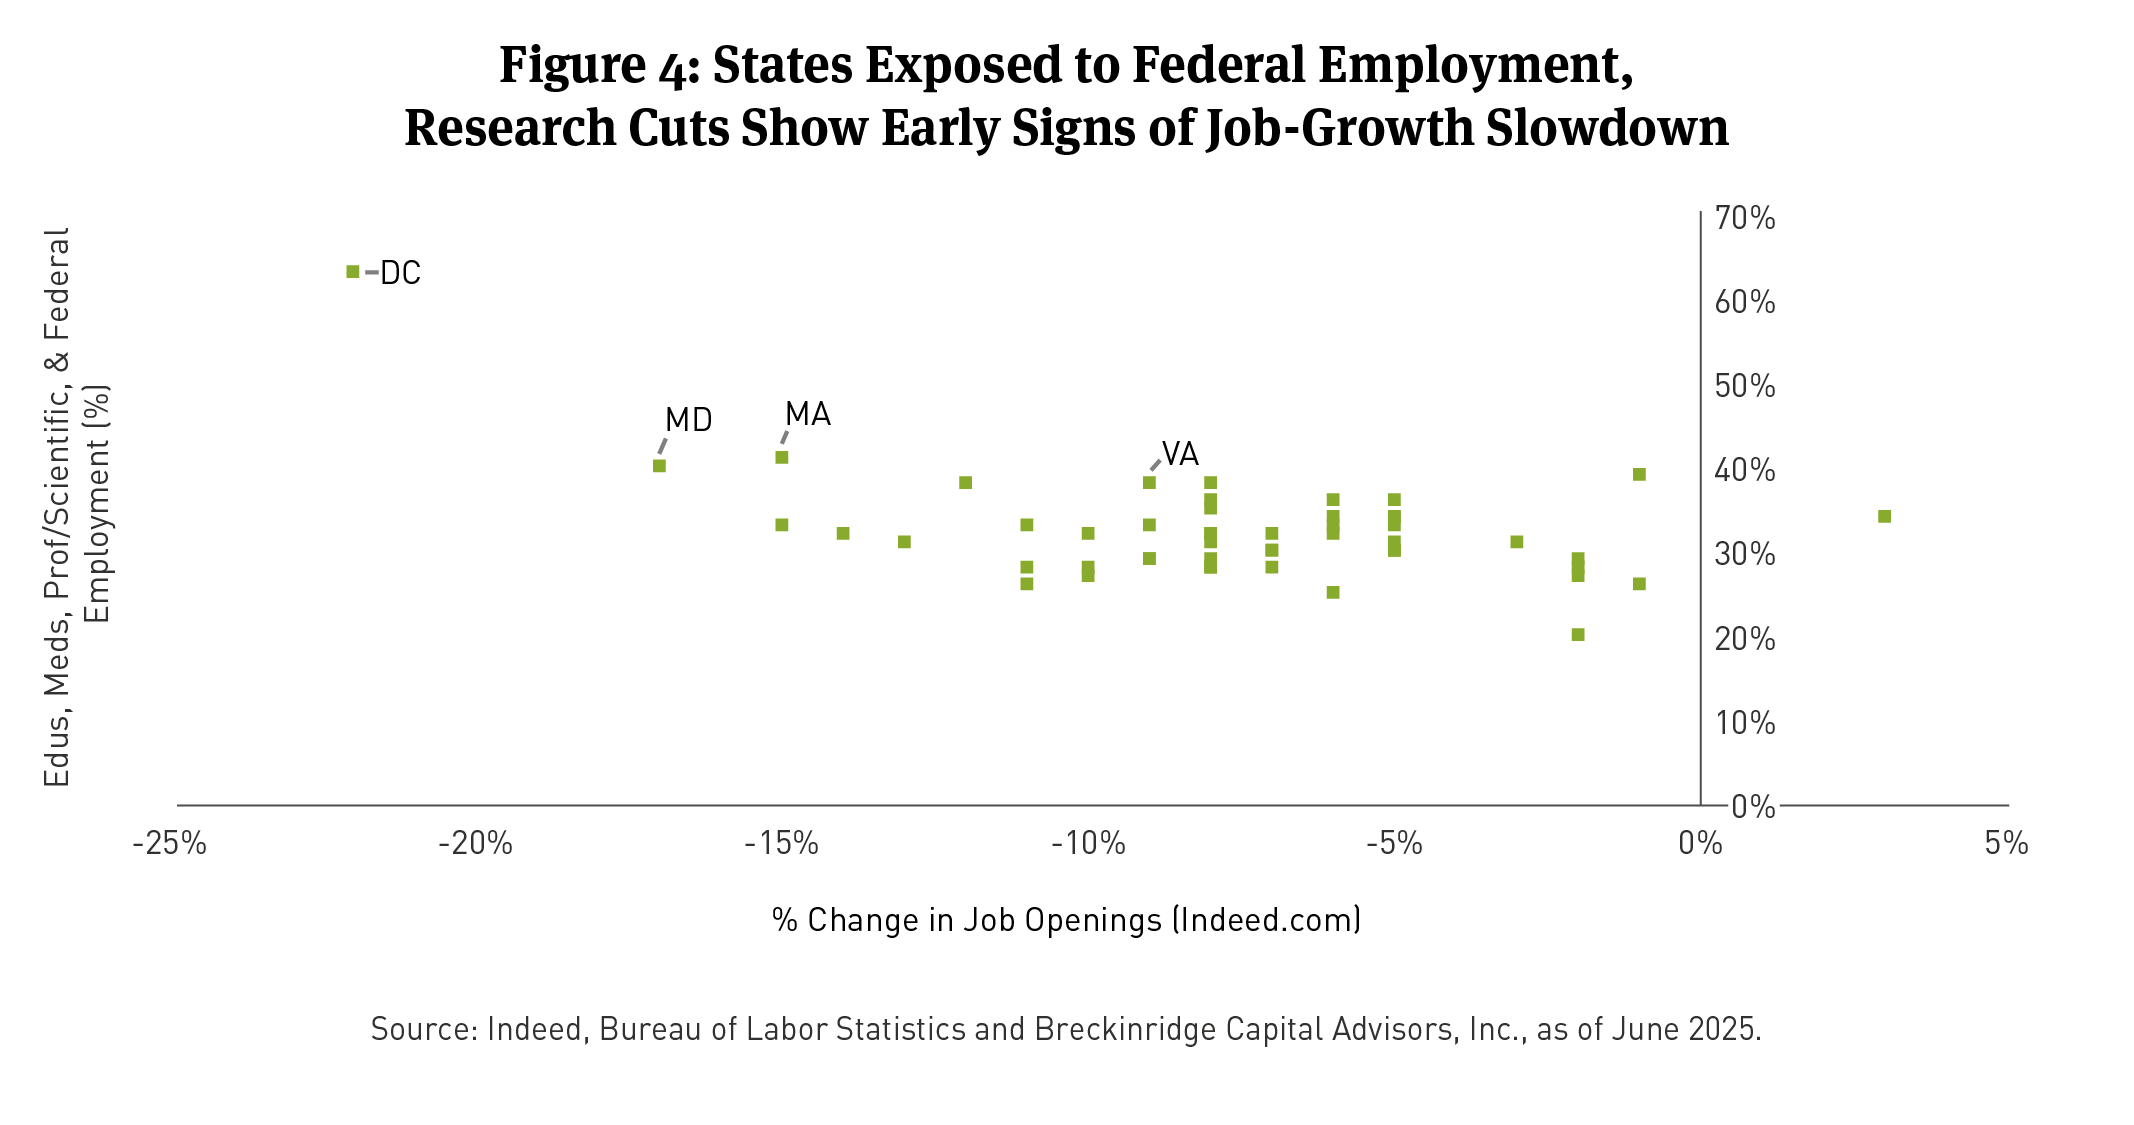
- Regulatory risk. The government has frozen or rescinded research and development funding at universities and hospitals.5 It also has downsized the federal workforce.6 Employment centers for higher education, healthcare and the federal government may experience slower growth as a result (See Figure 4).
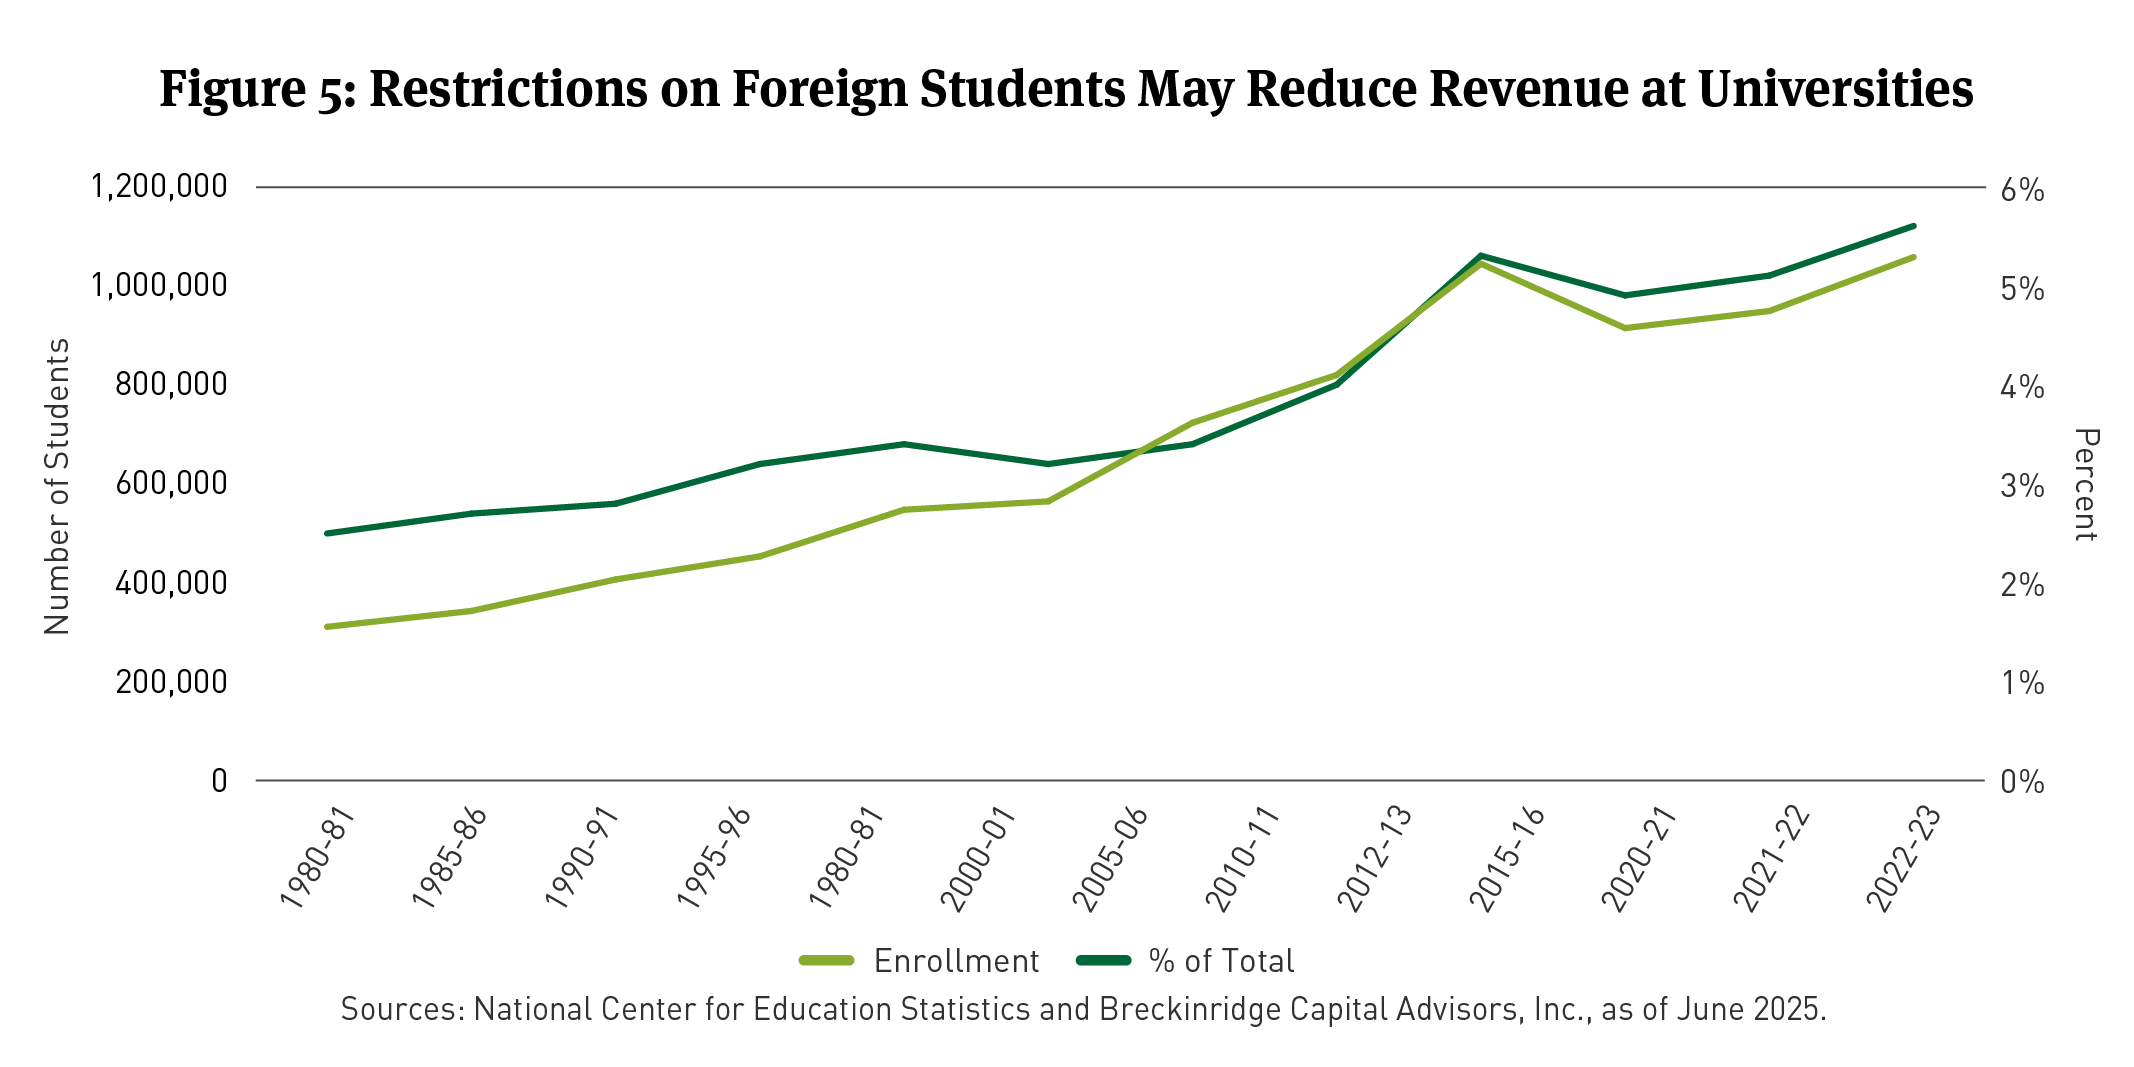
Restrictive immigration policies have also been a net negative. Some local economies are likely to slow (see our 2025 Municipal Market Outlook). New limits on student visas could reduce university revenue. Over one million foreign students currently study in the U.S. (See Figure 5) (See also: Material Policy Headwinds for Private Higher Ed Are Likely Manageable Investment Risks).
New tariff rates caused Moody’s to lower outlooks for the sectors mentioned above.7 The effective U.S. tariff rate is currently 12.3 percent.8 Tariff rates rose for some trading partners on July 9, 2025. Negotiations are ongoing for others.
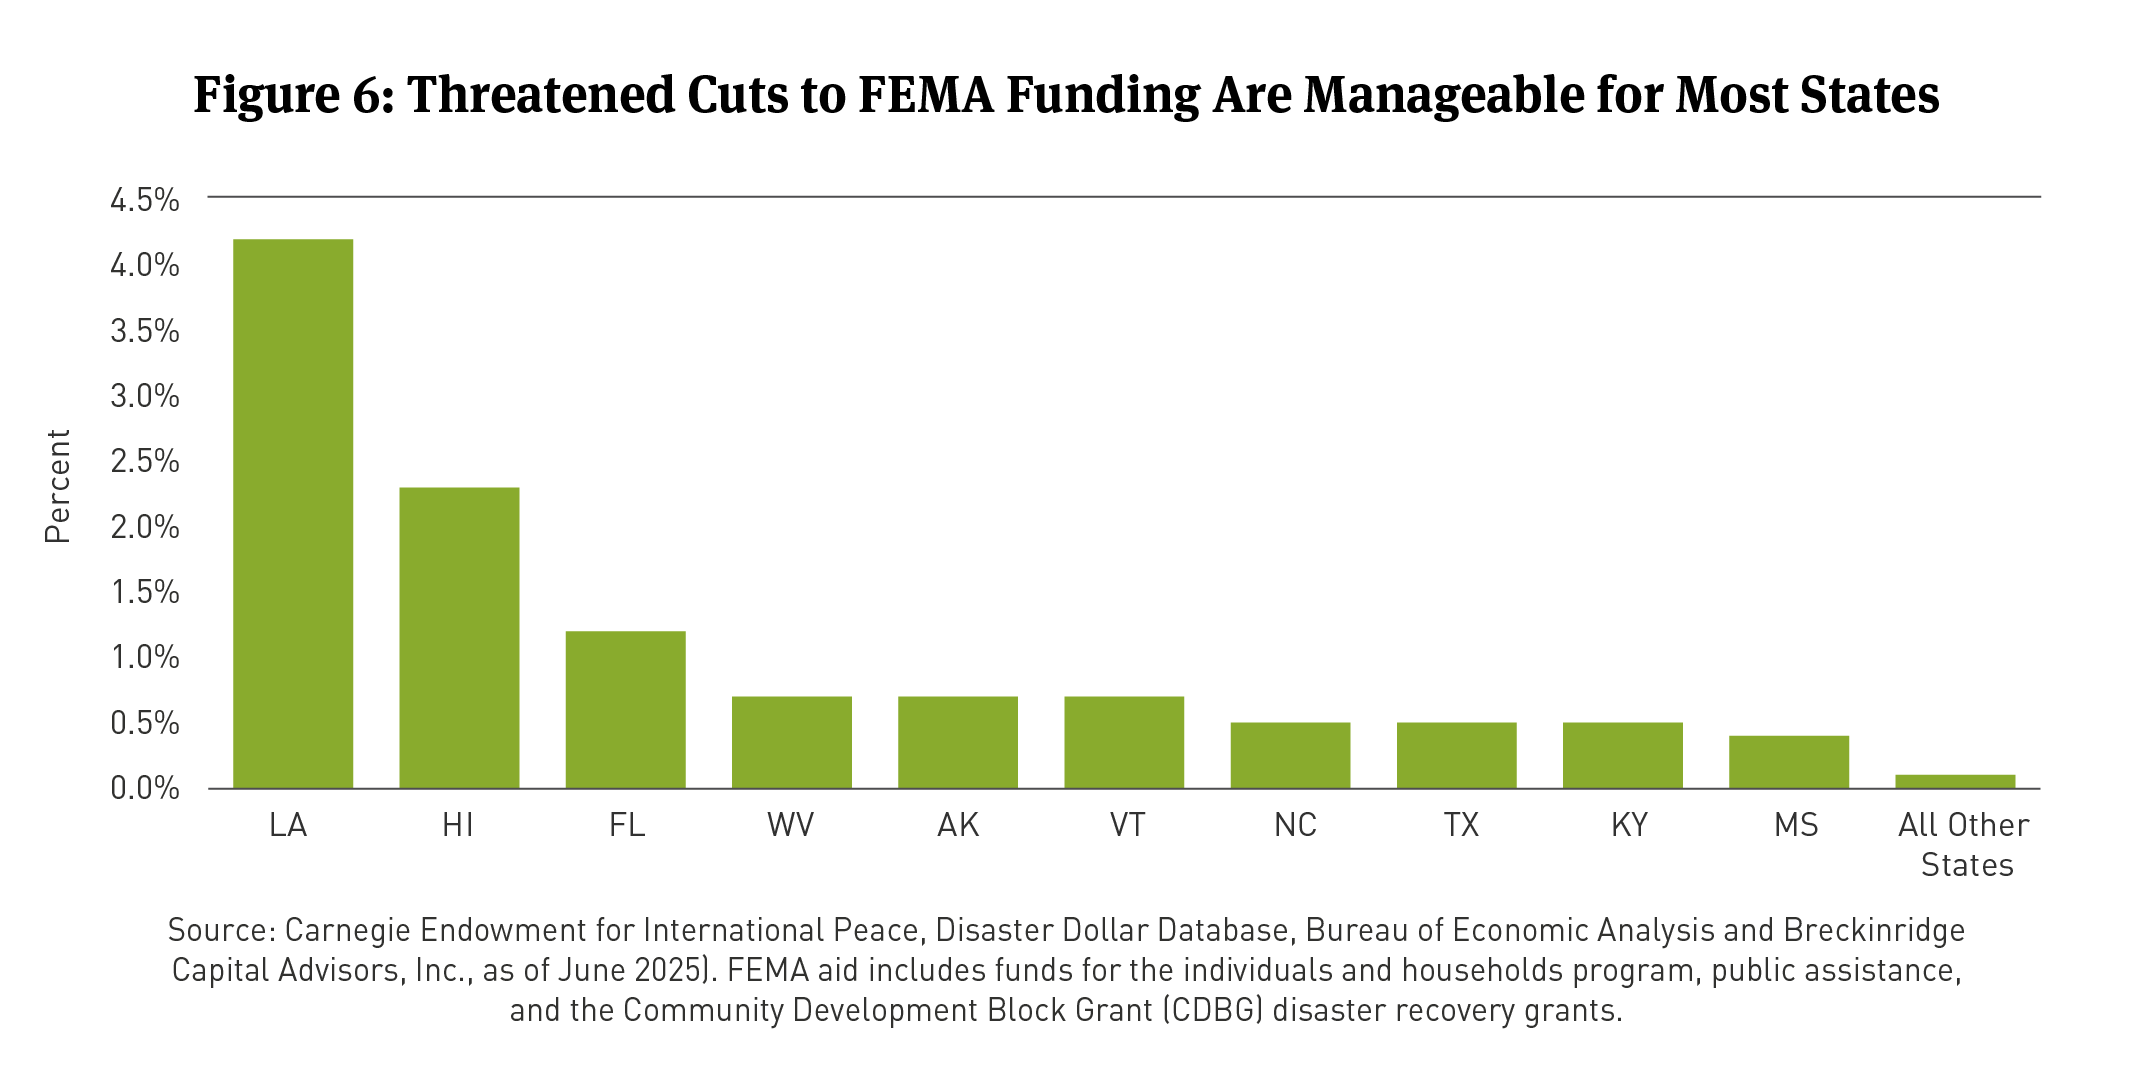
The administration has threatened to devolve more Federal Emergency Management Agency (FEMA) responsibilities to states.9 The President has declared natural disasters with less urgency than his predecessors.10 (Breckinridge has long anticipated a less generous federal partner with respect to post-disaster funding. We are unsurprised by recent proposals. See Heating Up: The Muni Market Inches Closer to Pricing Climate Risk.)
In the near-term, we believe FEMA-related risks are manageable. Swift reductions in FEMA aid would be difficult without Congressional approval.11 Additionally, disaster aid comprises a manageable portion of gross state product (GSP) in most places (See Figure 6).
Medicaid.
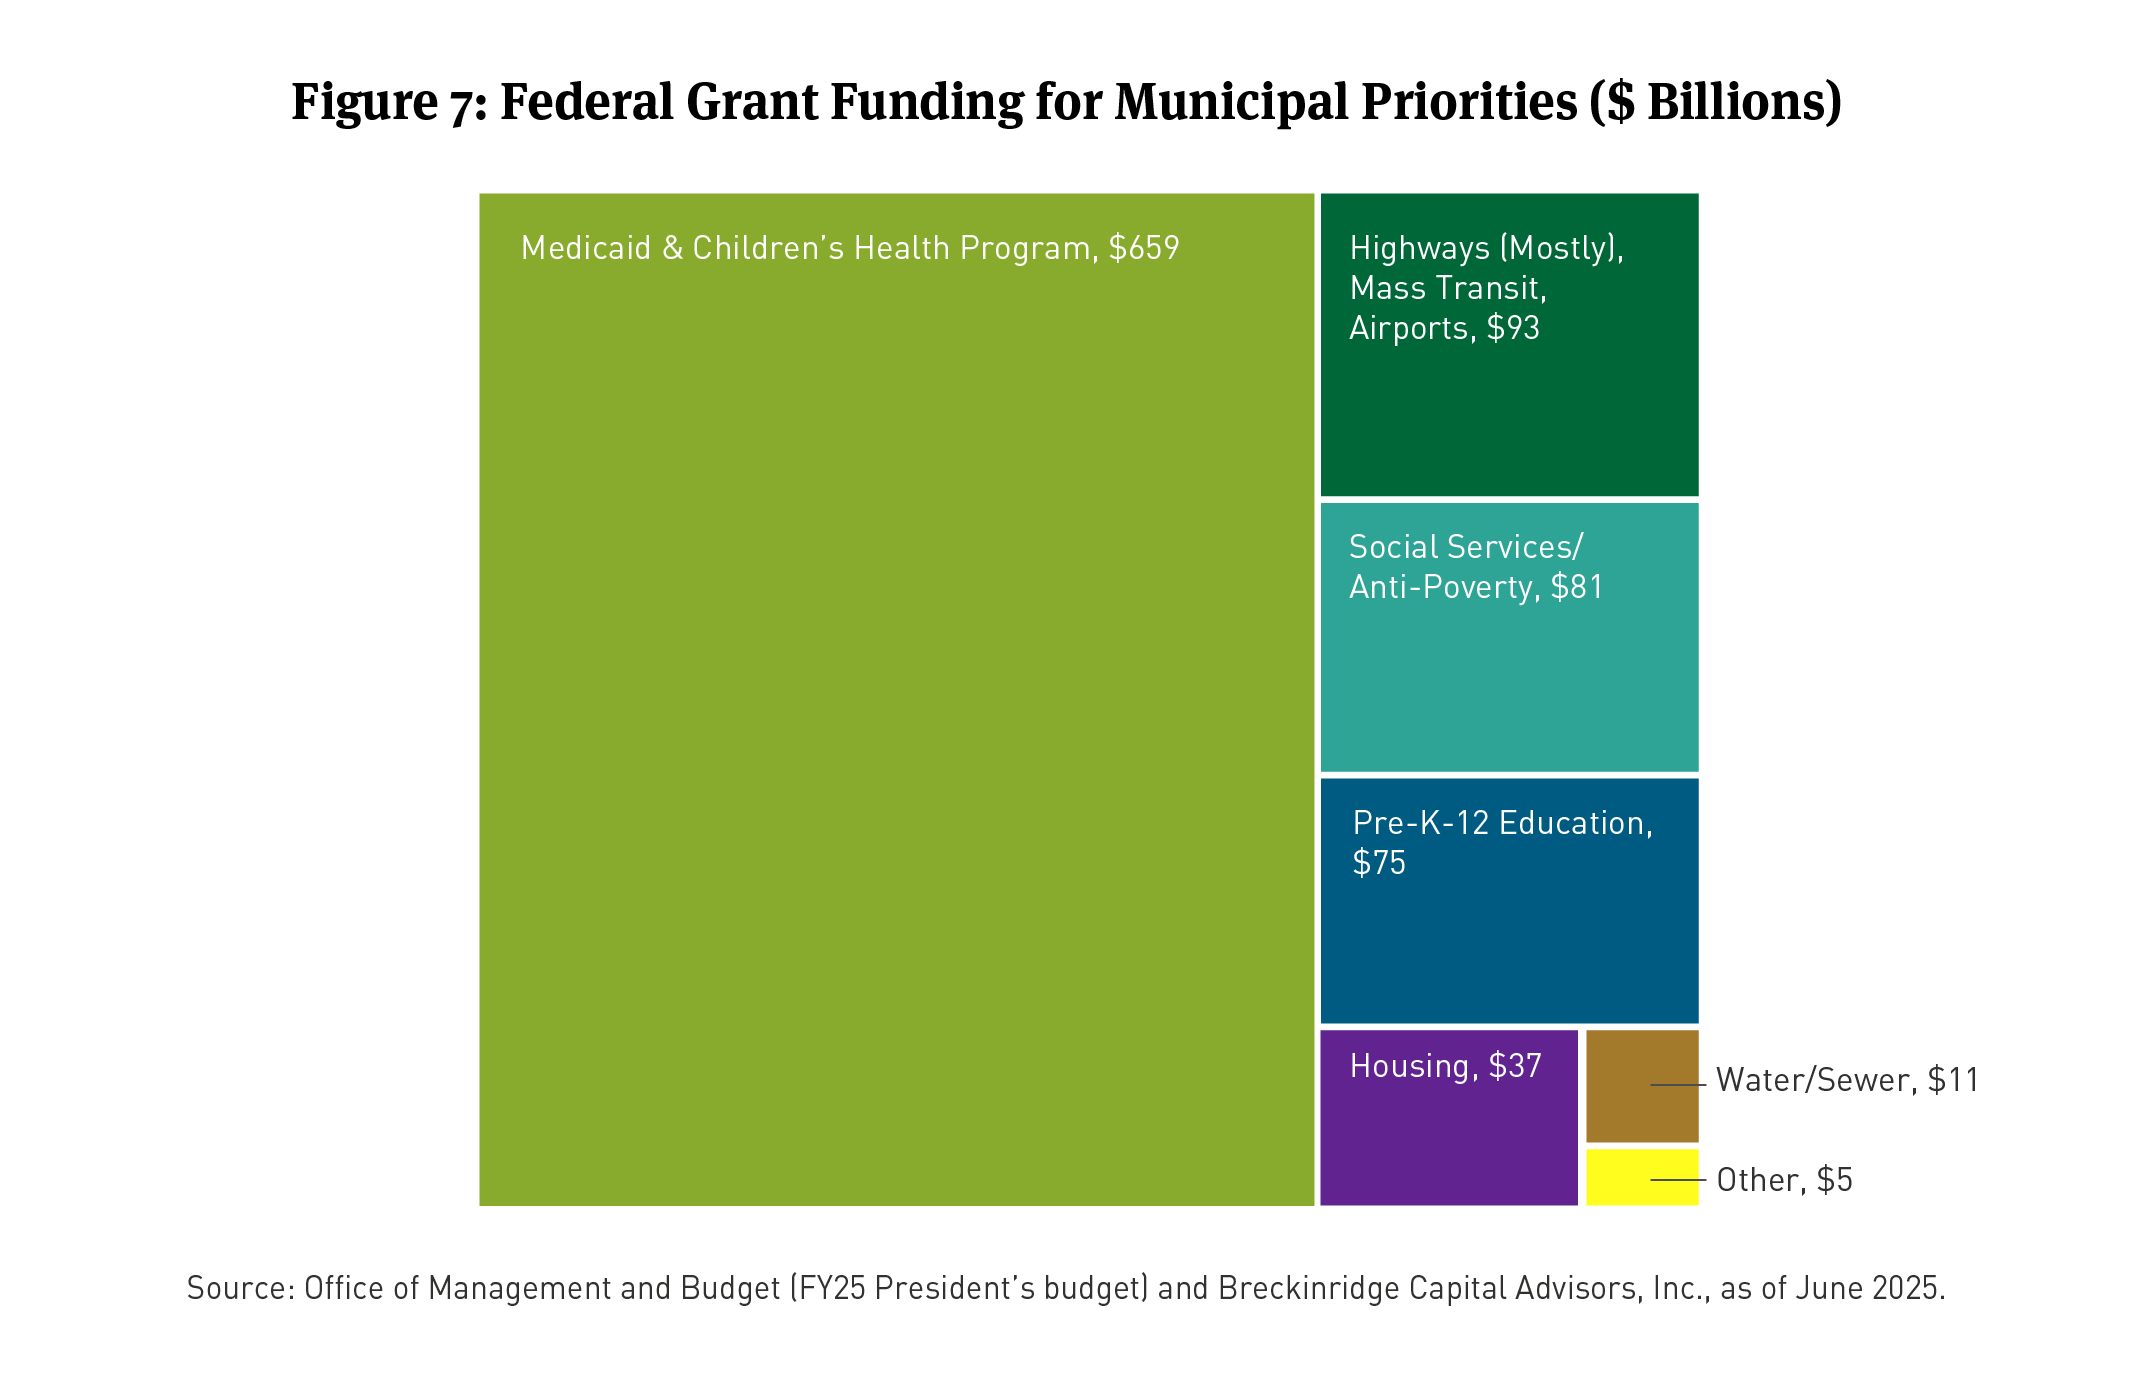
The President signed into law the One Big Beautiful Bill Act (OBBBA) on July 4, 2025. The OBBBA’s Medicaid provisions are likely to result in a slower rate of program growth. The legislation includes new work requirements, disincentives for enrolling childless adults made eligible under the Affordable Care Act and limits on provider taxes, among other changes.12 Hospitals serving large Medicaid populations seem most at risk.13 However, Medicaid is by far the largest grant program for U.S. states and local governments (See Figure 7). A reduced flow of Medicaid dollars could result in funding cuts to downstream issuers (school districts, nonprofits) or higher taxes, or both.
Tax changes.
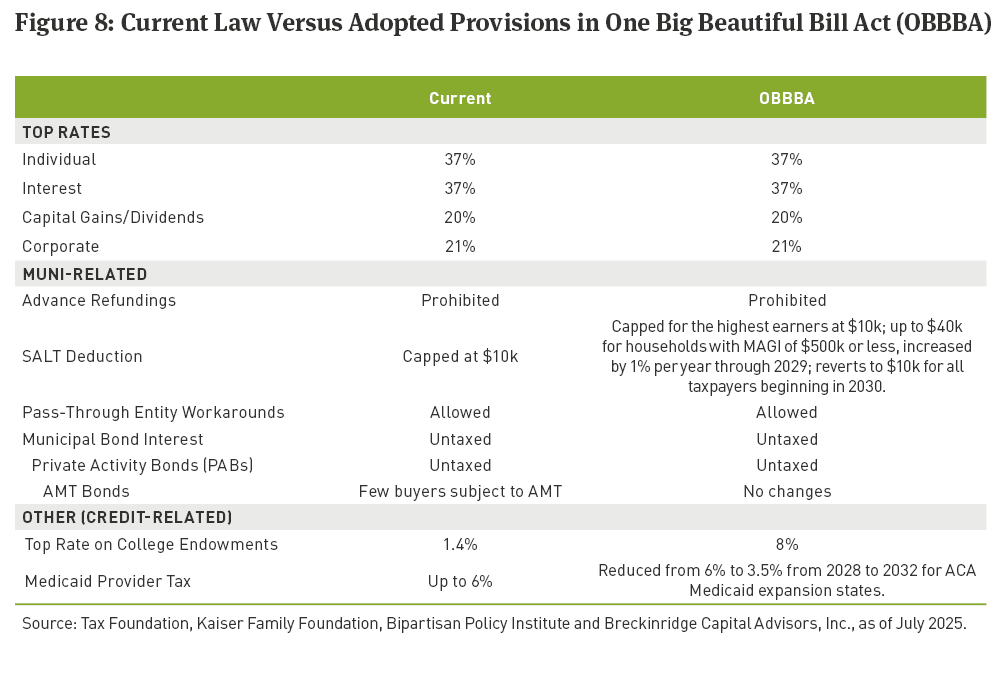
The OBBBA maintains the tax exemption for municipal bond interest. Worries that Congress might alter the exemption to finance the extension of the 2017 Tax Cuts and Jobs Act were misplaced.
The OBBBA also maintains the $10,000 cap on the state and local tax (SALT) deduction, at least for the highest income taxpayers.14 Investors in high-income-tax states should continue to have strong incentives to bias portfolios toward in-state securities.
One tax provision that did not make it to the final version of the OBBBA was a ban on SALT cap “workarounds.”15 This is a marginal credit-positive for high-income tax states.
Workarounds permit certain business owners (in 36 states) to take a deduction against their personal returns for business entity level taxes they pay to states.16 The rules immunize some high-income business owners from the SALT cap.17
A prohibition on workarounds would have increased the cost of doing business in high-tax states, making them marginally less competitive relative to peers in other states. It would also have marginally increased the demand for in-state bonds in specialty states.
Figure 8 below summarizes select tax provisions in the House and Senate legislation.
Technicals
Federal policy also influenced market technicals in 1H2025 via tax risk, deficit growth and tariffs.
Supply.
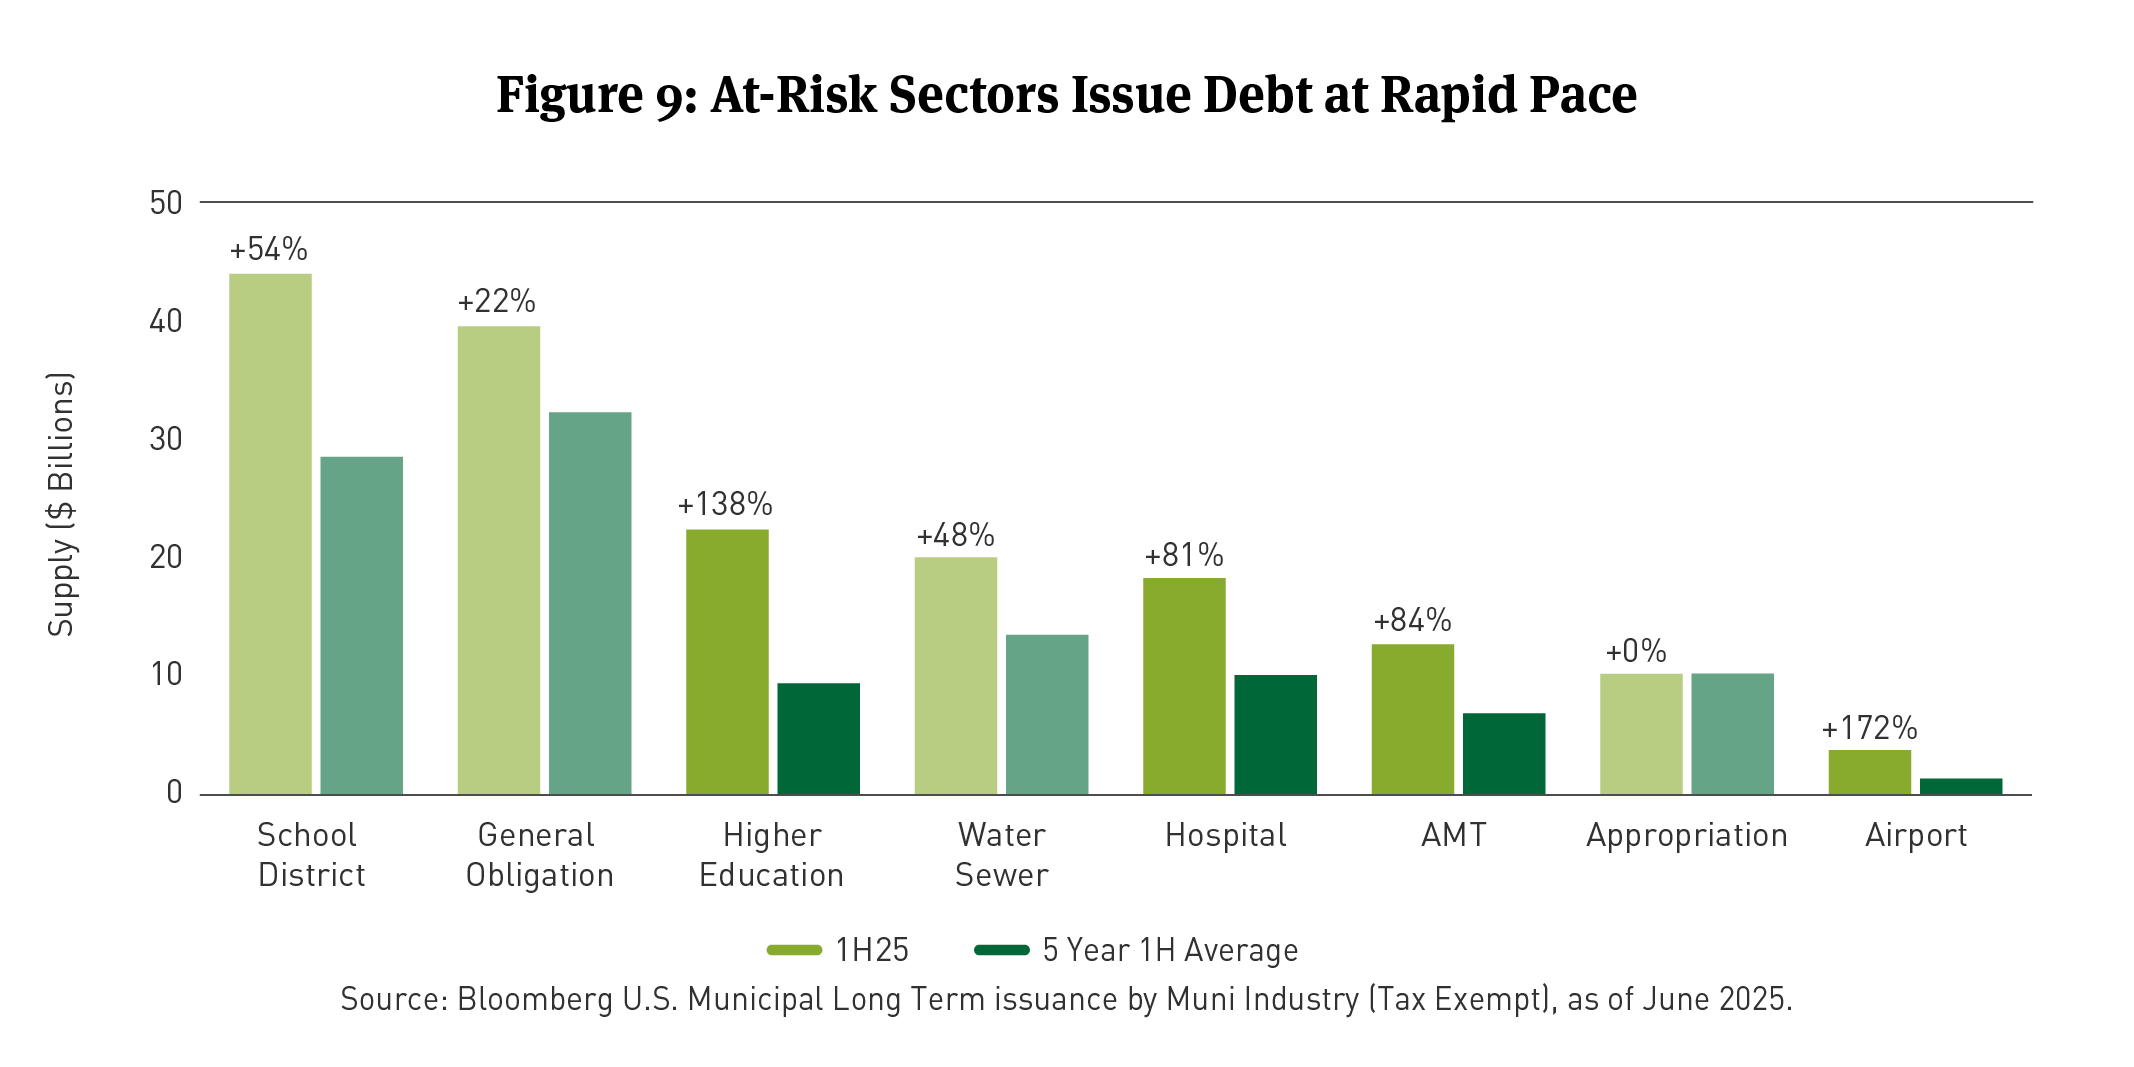
Through May, new money issuance was up 18 percent on a year-over-year basis (See Figure 9). The increase is noteworthy insofar as 2024 was also the highest on record.
Growth in issuance reflects a mix of factors, including higher prices for construction labor and materials, reduced pandemic-era reserves (often used to fund capital projects during the 2021-2024 period), a backlog of infrastructure needs and more climate-related resiliency planning.
But this year specifically, issuance has also reflected issuers’ heightened exposure to losing access to the exemption. Borrowers in the most at-risk sectors issued at a rapid clip in 1H2025, including Higher Education (+138 percent vs. 5-year average), Airports (+172 percent vs. 5-year average), Healthcare (+81 percent vs. 5-year average) and Alternative Minimum Tax (AMT) bonds (+84 percent vs. 5-year average).18
Demand.
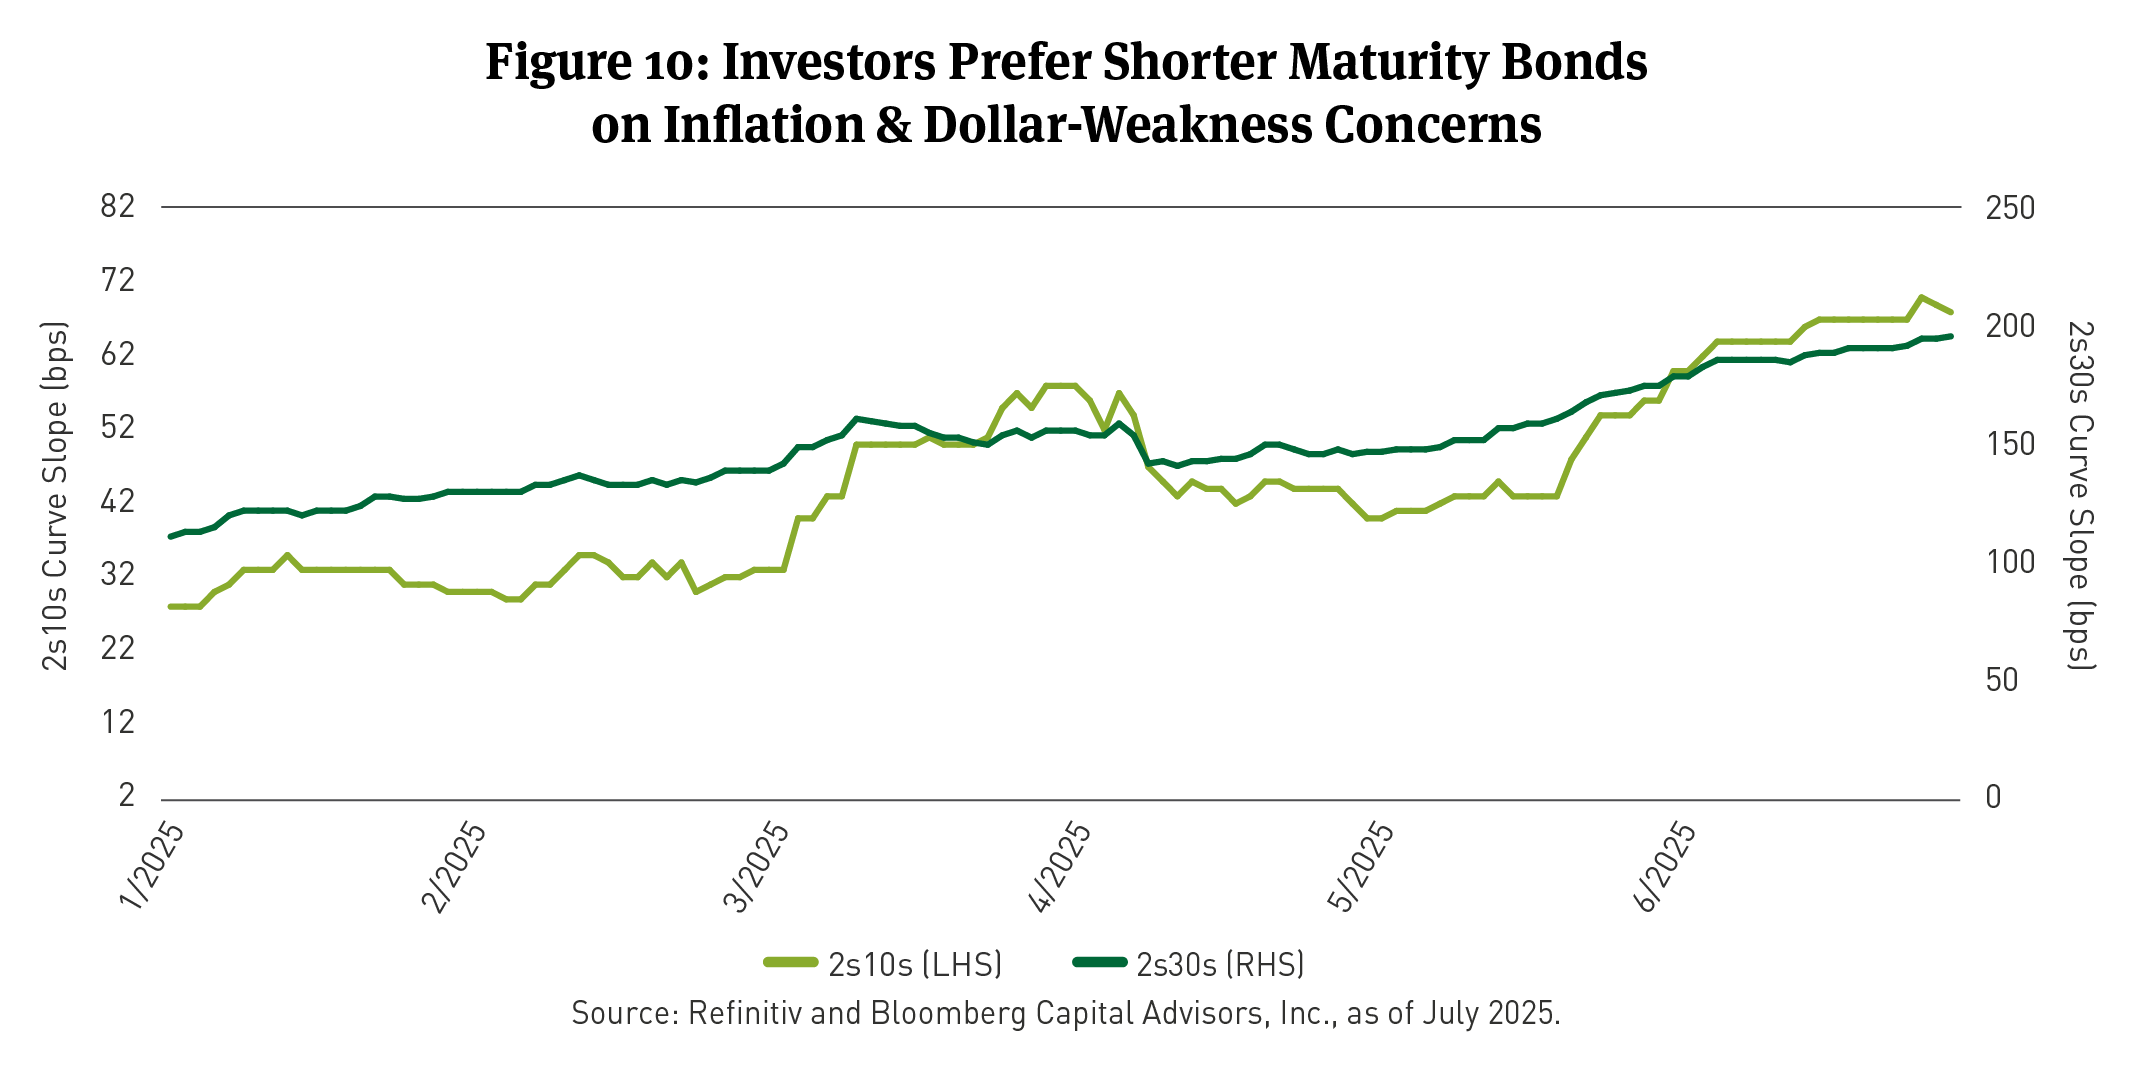
The combination of restrictive trade policy and a deteriorating federal deficit trajectory contributed to flagging demand for longer dated municipals and a steeper muni yield curve (See Figure 10). Consistent with movements in the Treasury market, yields on longer dated municipal bonds rose by more than shorter maturity bonds in April, after the President announced substantially higher tariffs on most U.S. trading partners.
Longer tenor yields have remained elevated relative to shorter-maturity bonds, as investors anticipated passage of the OBBBA and digested various estimates for deficit expansion, which typically ranged from $3 to $4 trillion over 10 years.19 Investors now appear to be pricing the possibility of higher inflation and a weaker dollar over the long term.
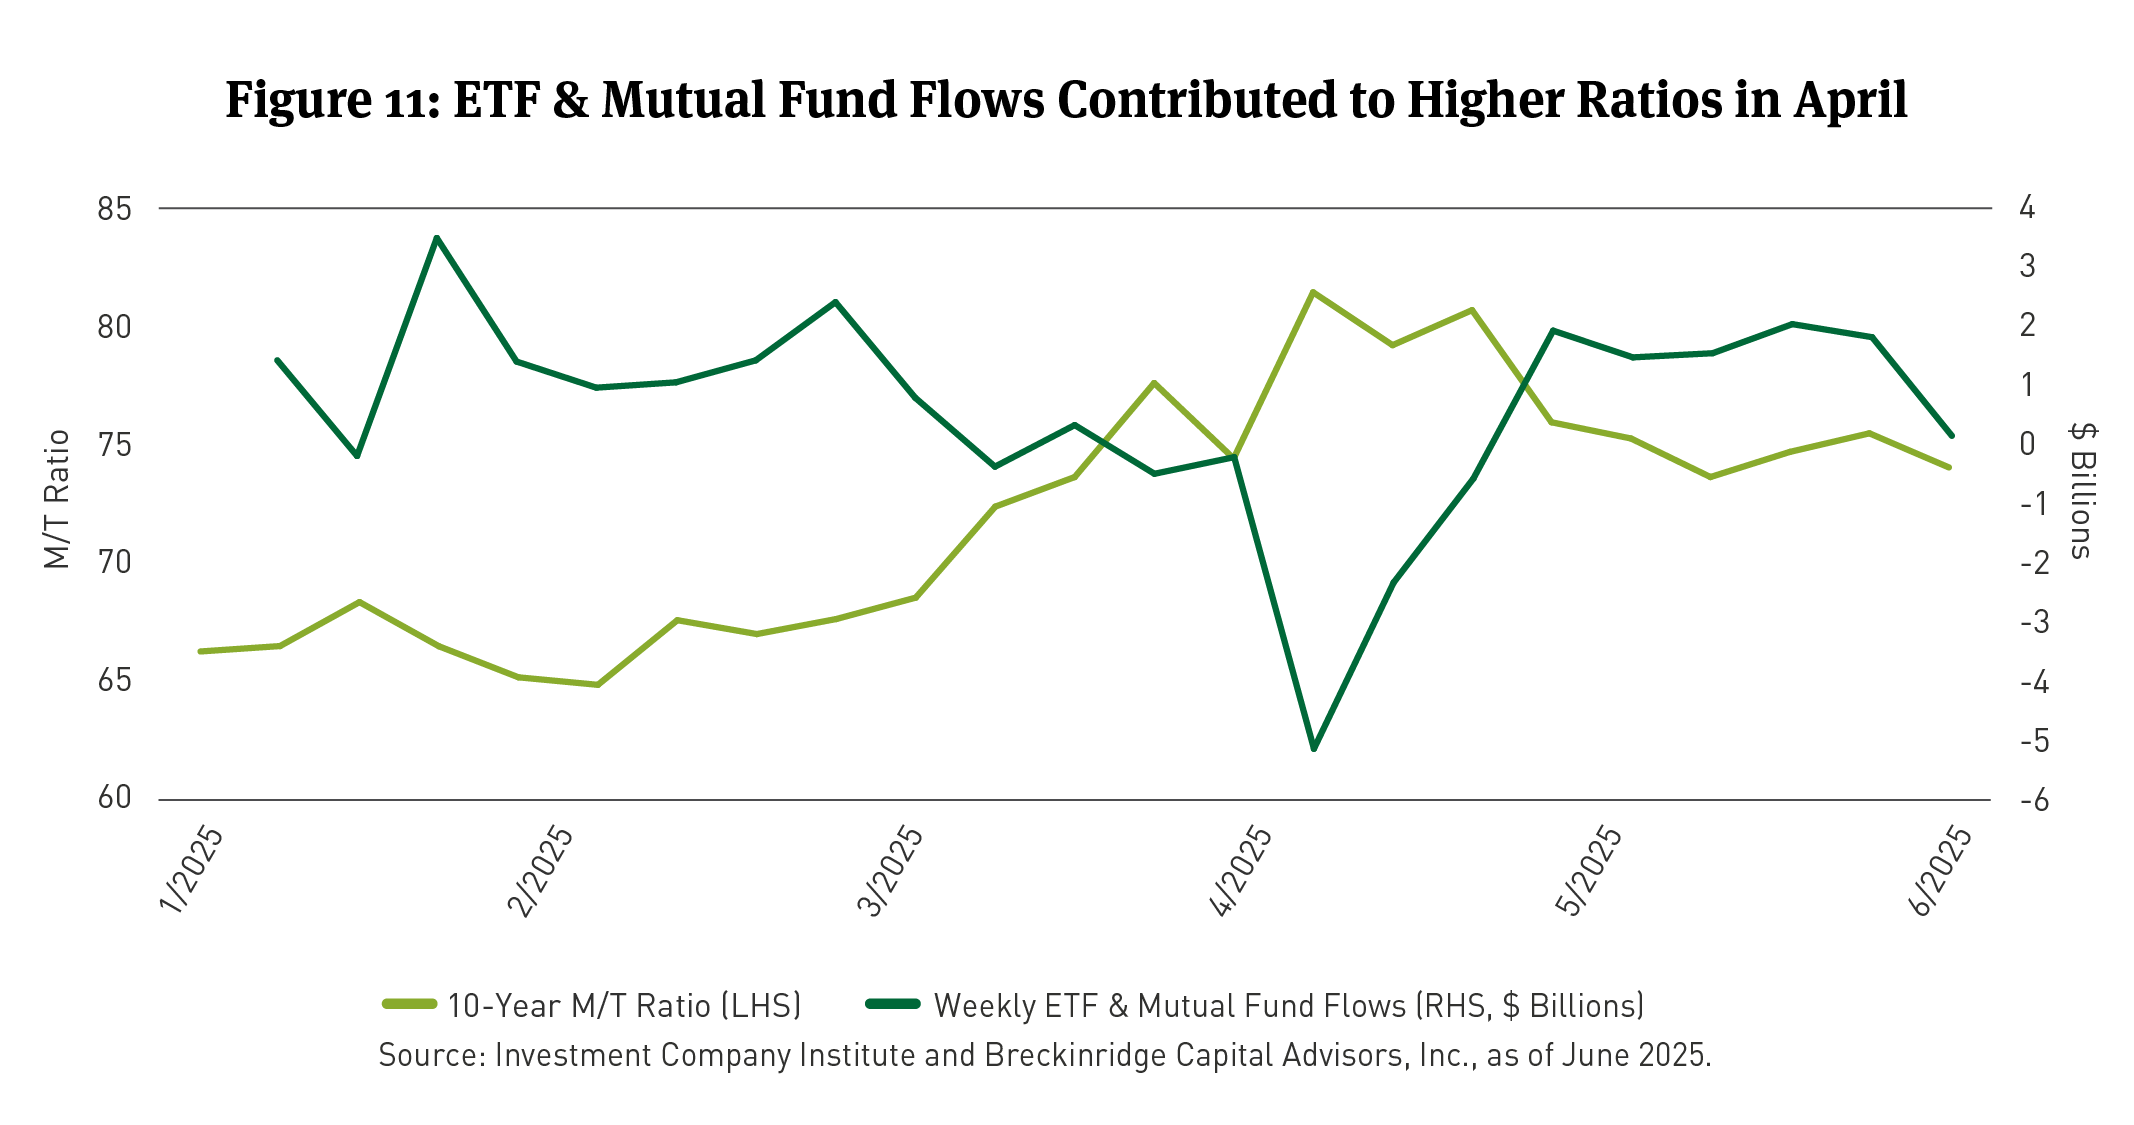
Tariff-related uncertainty and growing deficits have also contributed to periodic softening of demand, largely via mutual and exchange traded fund (ETF) flows. The market sell-off in April was the most noticeable example. Municipal/Treasury (M/T) ratios increased meaningfully over the course of several trading days (See Figure 11).
Performance and Valuations
IG credit spreads have contributed little to returns. Spreads on A-rated general obligation bonds began the year around 35 basis points (bps) in 10 years and have remained there. BBB-rated 10-year bonds remain around 83bps to the AAA scale.20 Even mid-A-rated hospital bonds in 10 years have lost only four bps of spread, despite Medicaid headwinds.21
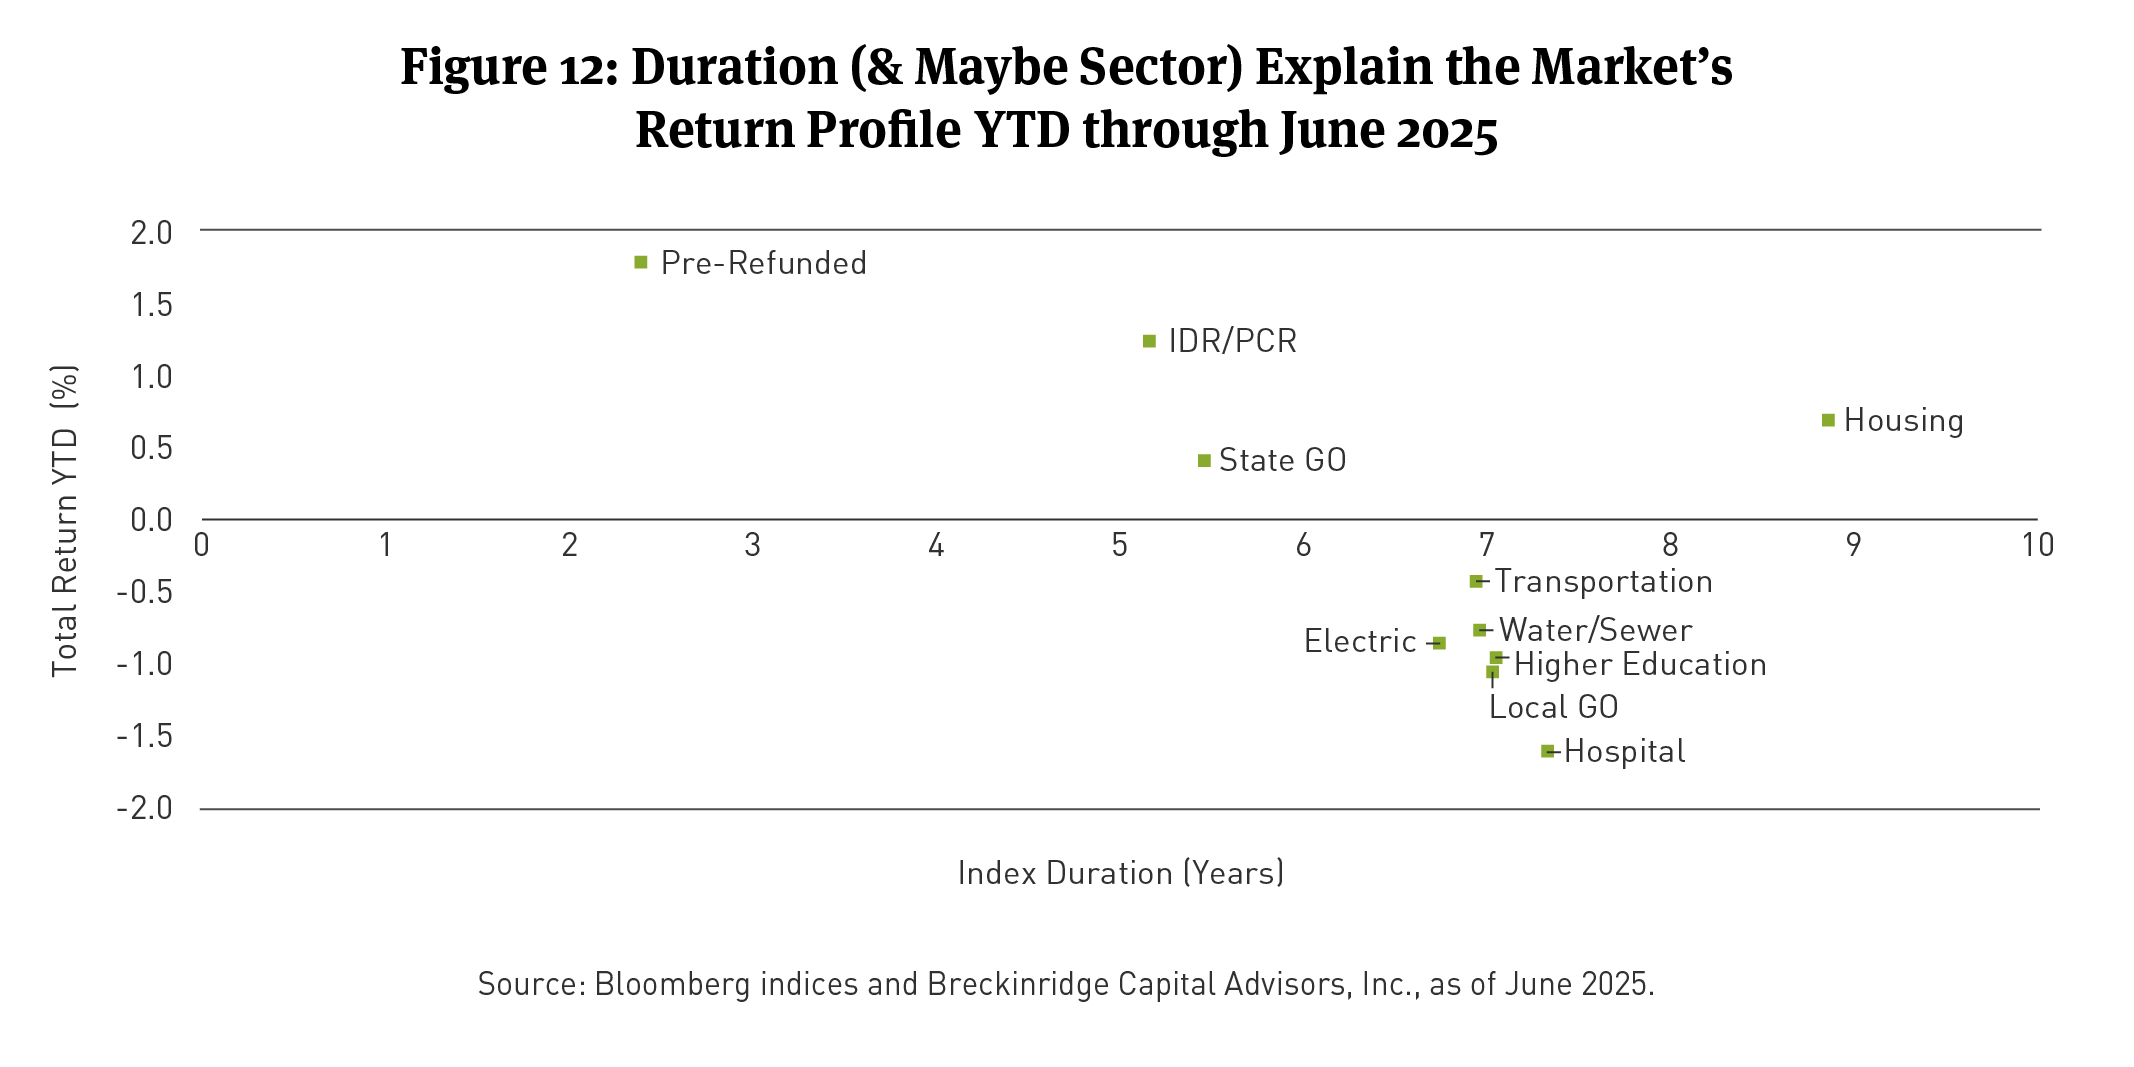
In contrast, duration and sector have impacted performance. Shorter-maturity bonds were better insulated from the sell-off of longer-duration securities in April (See Figure 12). Hospital and Higher Education bonds experienced weakness relative to similar duration peers, as investors anticipated reduced Medicaid funding and a less generous research and development (R&D), student loan and student visa environment. Industrial development revenue (IDR/PCR) and housing bonds performed a bit better per unit of duration, due to a combination of higher option-adjusted spreads and attractive absolute yields. These sectors tend to provide significant pickup in yield relative to similarly rated bonds in more traditional sectors, which has resulted in increased investor demand.
Risks and Opportunities in 2H2025
We think that a few key themes will define the second half of the year. They include:
- Lower new money issuance. Issuers that planned to borrow in 2H2025 for fear the municipal tax exemption would be curtailed may now be less likely to borrow. A reduced pace of issuance may place a soft ceiling on M/T ratios, as demand remains robust while the supply of bonds slows.
-
Judicial decisions. We count at least 78 ongoing federal court cases involving executive branch regulatory policy with potential impacts for municipal credit.22 The list includes cases bearing on whether (a) the executive branch can condition federal grant aid on issuers’ “sanctuary city” policies; (b) the federal government can lay off as many employees as it has; (c) certain climate grants can be rescinded without Congressional approval; (d) university research and development grants can be cut; and other disputes. The outcome of these cases should produce more clarity regarding the reliability of federal support for certain municipal issuers. Ratings could be impacted in some cases.
-
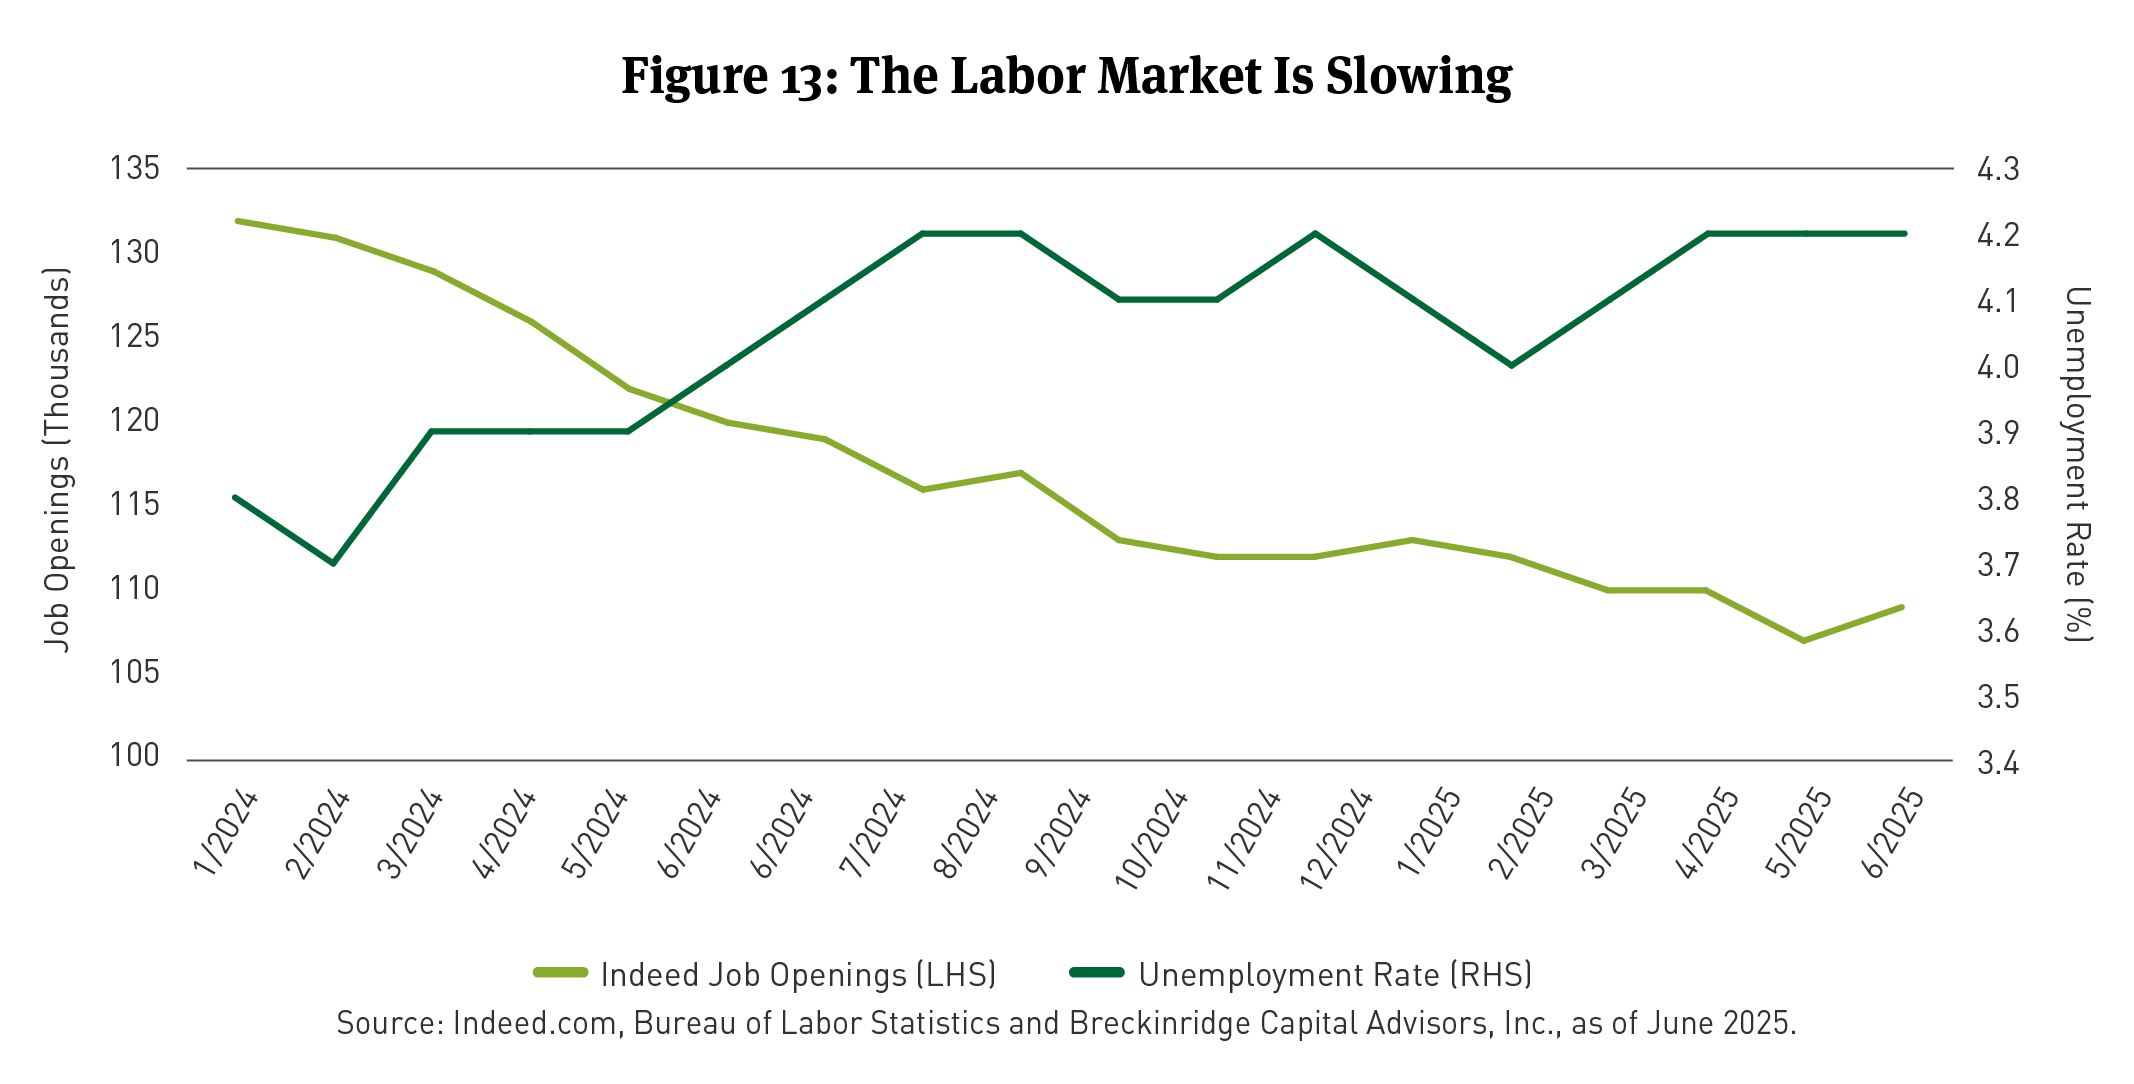
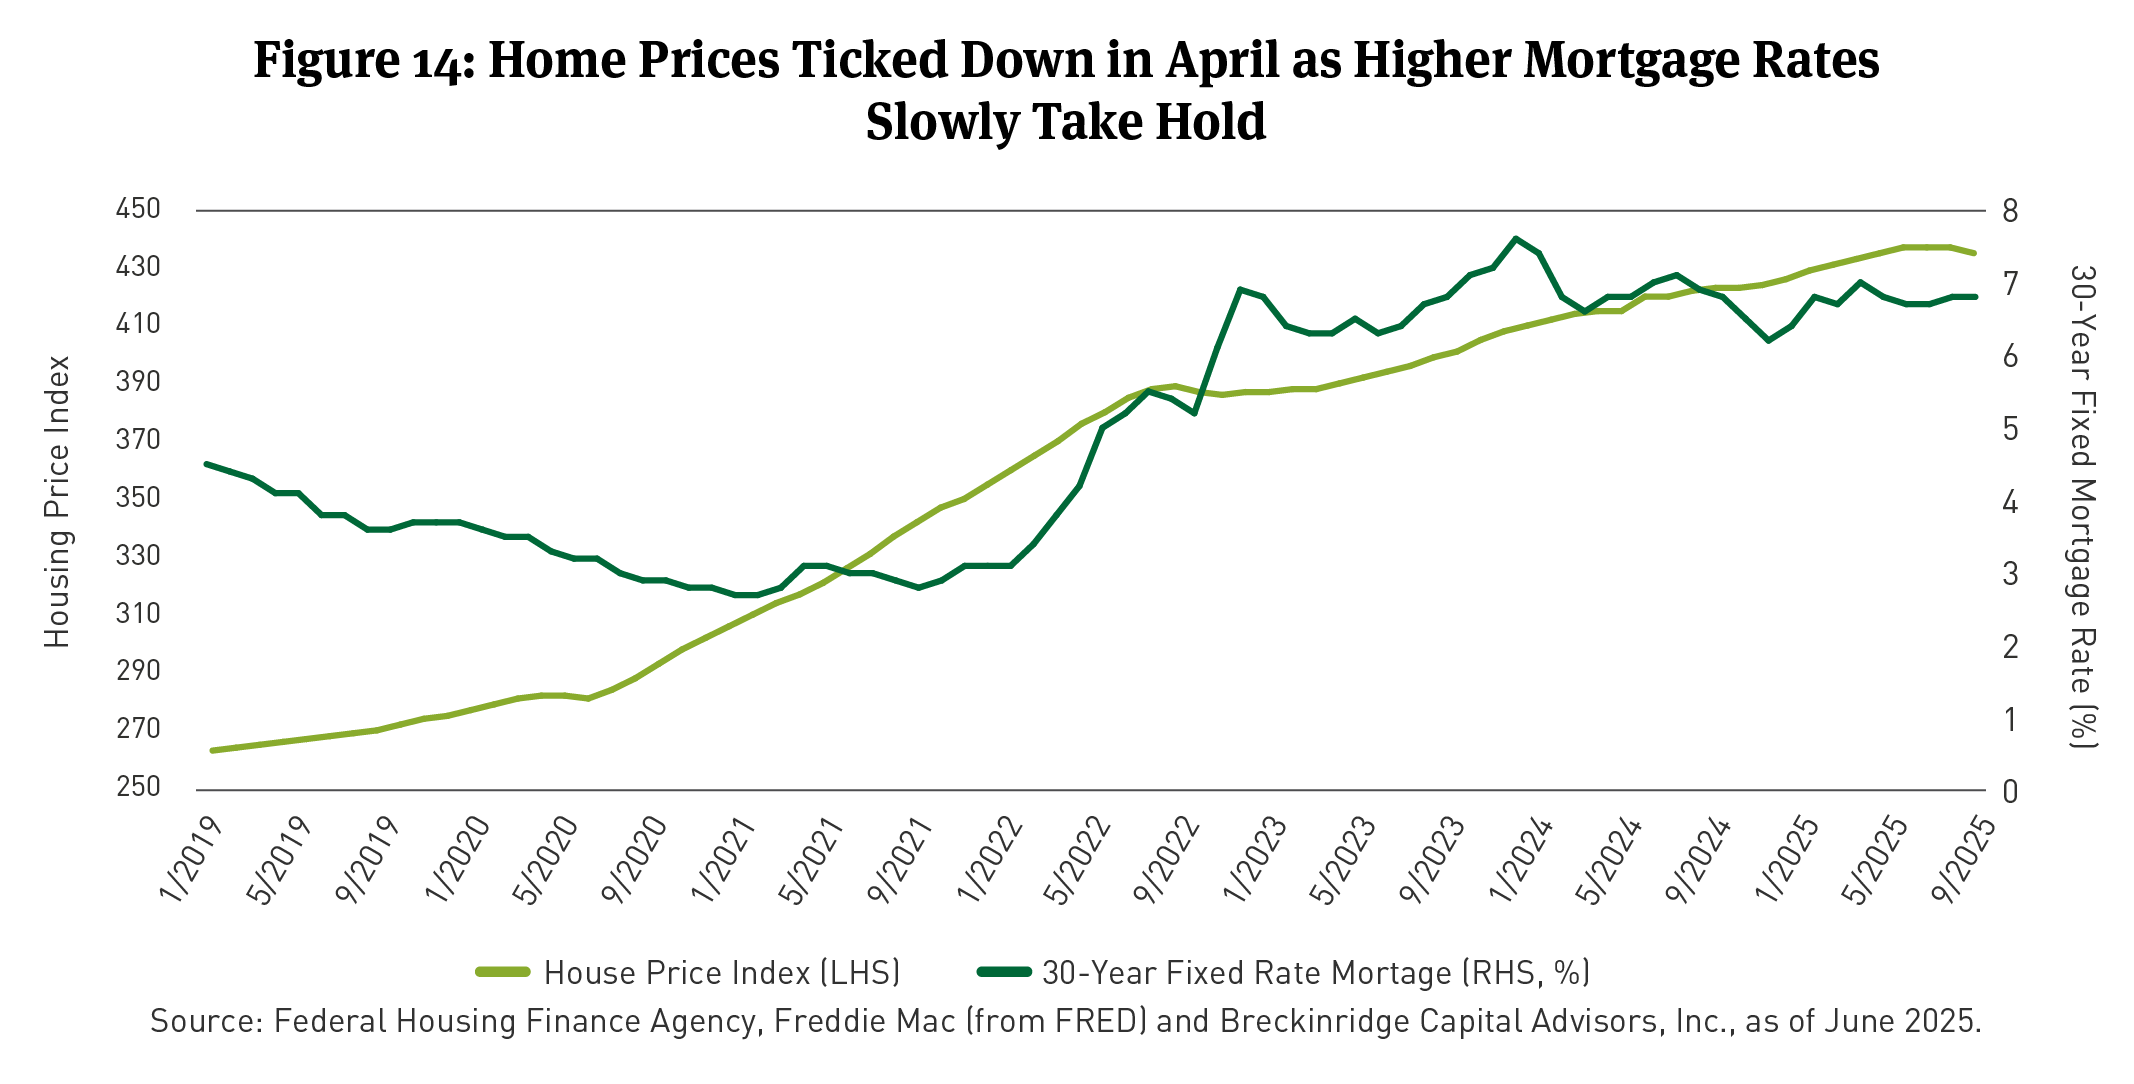
The growth versus stagflation debate. We see risks to growth in the near term and expect two more Federal funds rate cuts later this year. Demand for labor is slowing (See Figure 13). Home prices may have topped (See Figure 14). Elevated geopolitical risk should buoy demand for Treasuries. Higher tariffs are possible and enforcement of student loan delinquency penalties may dampen consumer spending. The Fed’s dot plot suggests the Central Bank plans to cut rates over the next 6 months to 12 months.23
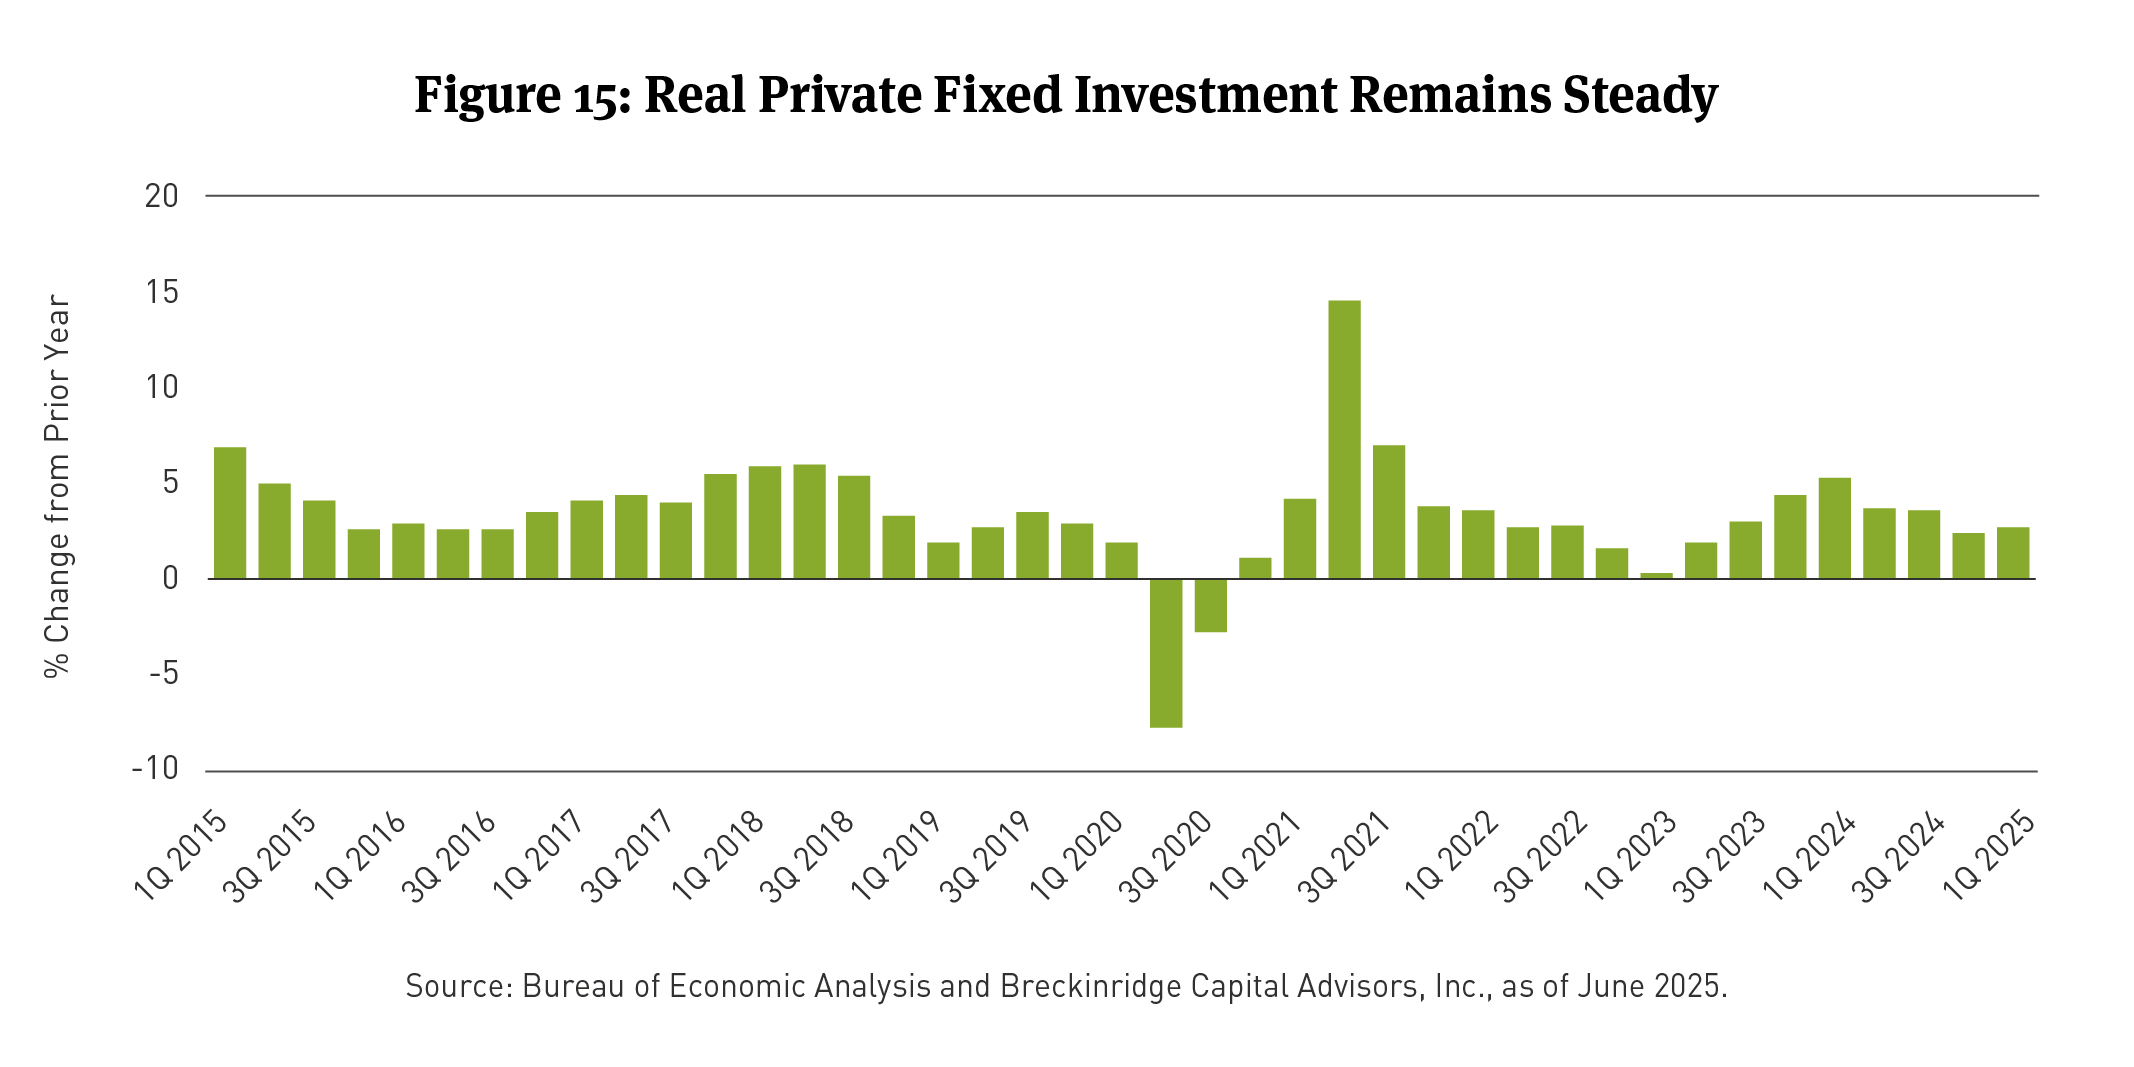
Risks to this view include ongoing investor skittishness over growing fiscal deficits, structurally higher tariffs and lower immigration. Each of these factors could weigh on inflation expectations and longer dated Treasury yields. Additionally, an economic slowdown is far from certain. Public views of the economy may be improving.24 Real private investment growth remains within its typical range and could accelerate following the passage and signing of the OBBBA (See Figure 15).
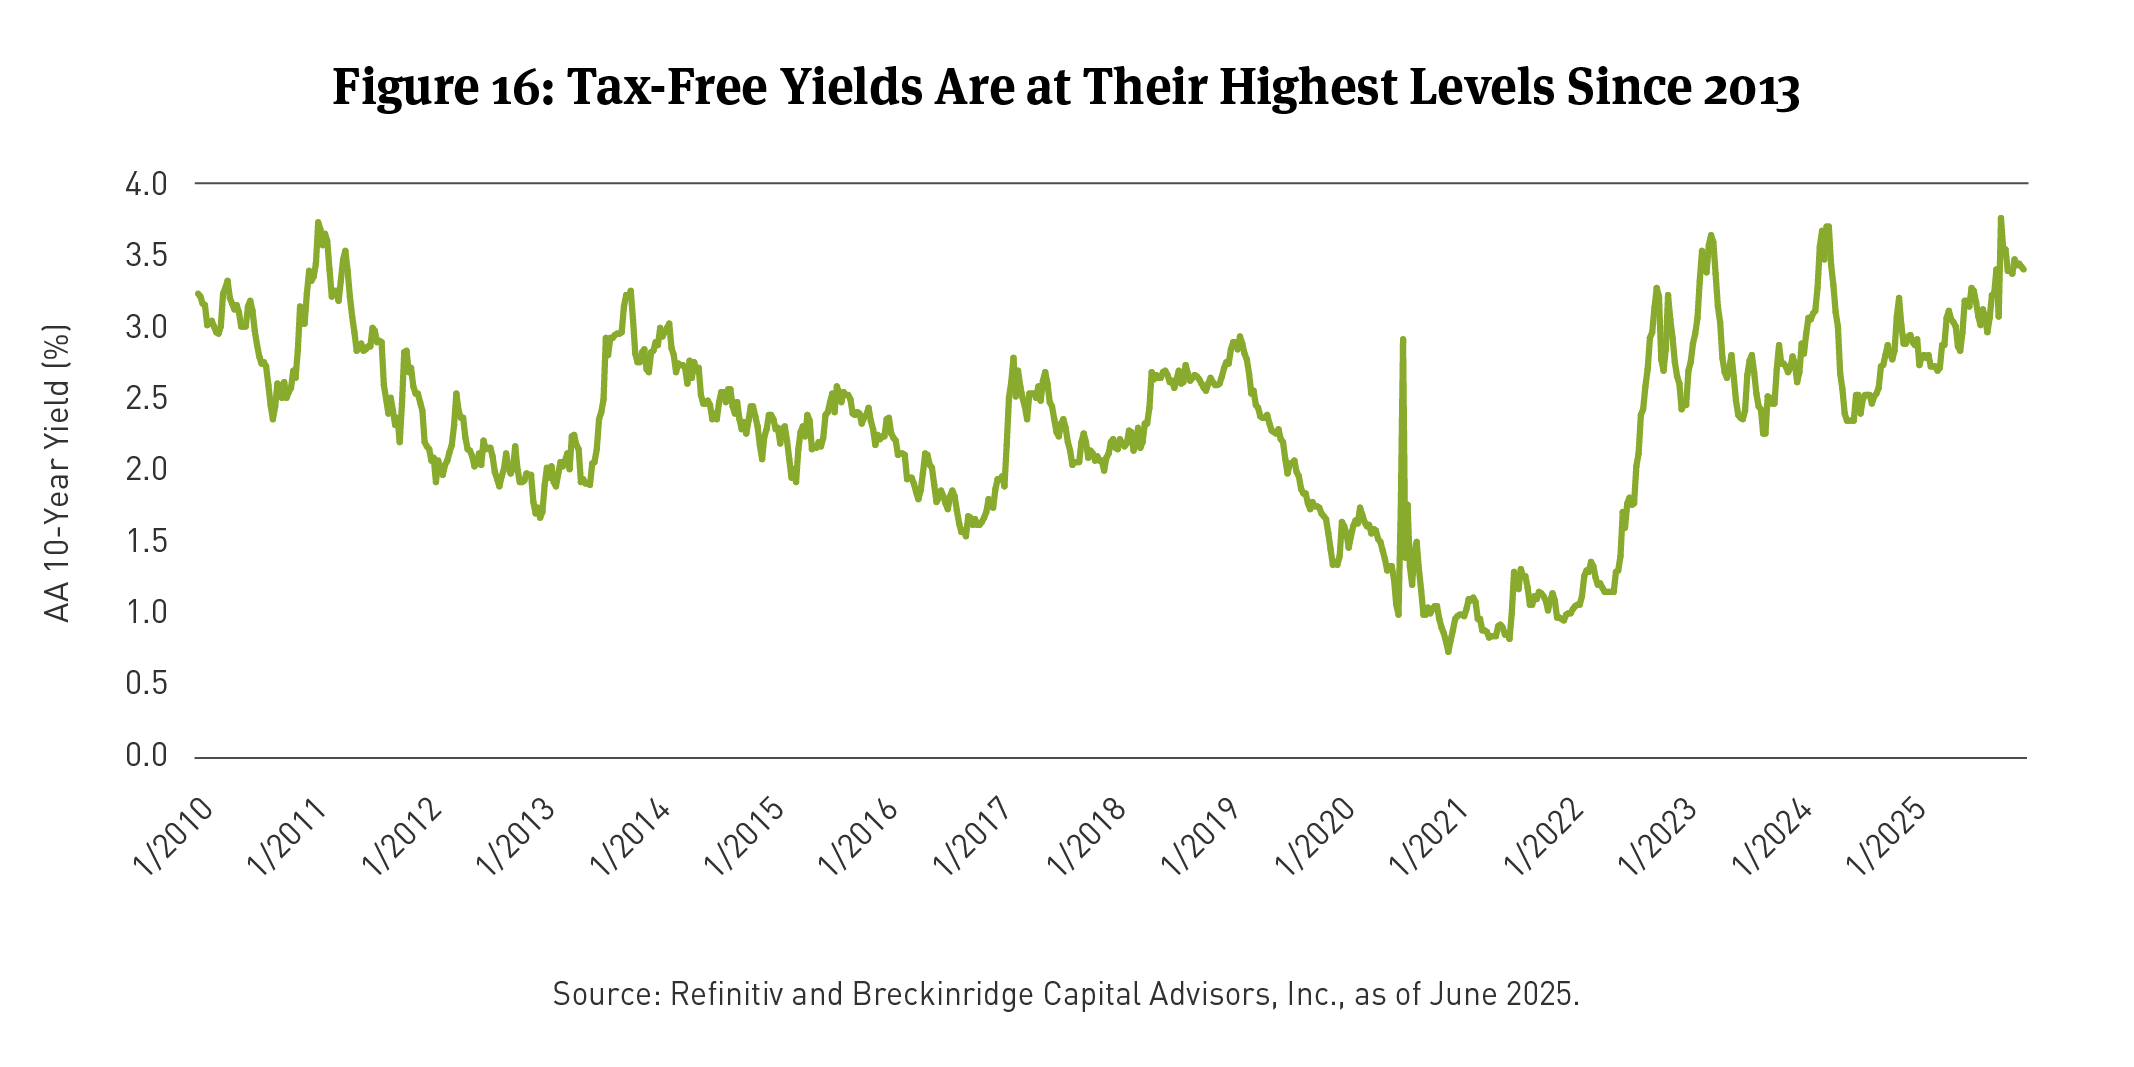
In either event, in our view, tax-free yields still appear attractive to high-grade income-oriented investors. Risks for bonds rated A and AA remain modest, for now, and yields are near their highs since 2015 (See Figure 16).
[1] S&P’s Water-Sewer Utility ratings trends largely reflect a methodology change. Its public power trend was significantly influenced by January’s wildfires in Los Angeles. (The fires led to a downgrade of the Los Angeles Department of Water and Power, as well as its downstream power providers.)
[2] Municipal Market Analytics, data through June 18, 2025.
[3] Municipal Market Analytics, data through July 2, 2025
[4] Illinois Policy Institute, New York City Financial Plan: https://www.illinoispolicy.org/chicago-mayor-brandon-johnson-stares-down-a-1-billion-city-budget-deficit/#:~:text=August%2030%2C%202024-; ,Chicago%20Mayor%20Brandon%20Johnson%20stares%20down%20a%20%241%20billion%20city,million%20remaining%20deficit%20this%20year., https://council.nyc.gov/budget/wp-content/uploads/sites/54/2025/03/FY26-Financial-Plan-Overview-2.pdf.
[5] It plans up to $30 billion more in impoundment-related rescissions before year-end. These cuts could reduce grant aid to municipal issuers and weaken some small local economies, as well. See Kathryn Palmer, “Can Scientific Research Survive Without Federal Funding?”, Inside Higher Ed, May 12, 2025. Available at: https://www.insidehighered.com/news/business/revenue-strategies/2025/05/12/can-scientific-research-survive-without-federal-funding; See also, Waldman, Hair, “White House looks to freeze more agency funds – and expand executive power,” E&E News by Politico, June 10, 2025. Available at: https://www.eenews.net/articles/white-house-looks-to-freeze-more-agency-funds-and-expand-executive-power/
[6] Sam Berger and Jacob Leibenluft, “Trump Administration’s Mass Layoffs of Federal Works are Illegal,” Center on Budget and Policy Priorities, May 2, 2025.
[7] For example, in the airport sector, Moody’s notes that weaker global economic activity from tariff and trade policy is likely to flow through to reduced enplanements and revenue. “Outlook update - Negative with weakening economy and lower capacity growth,” Moody’s Investors Service, May 5, 2025.
[8] Per the Yale Budget Lab, as of June 17, 2025. Available at: https://budgetlab.yale.edu/research/state-us-tariffs-june-17-2025.
[9] Hirji, Leopold, and Rosenthal, “‘Abolishing FEMA’ Memo Outlines Ways for Trump to Scrap Agency,” Bloomberg News, June 17, 2025. Available at: https://www.bloomberg.com/news/articles/2025-06-17/-abolishing-fema-memo-outlines-ways-for-trump-to-scrap-agency.
[10] Alex Brown, “Trump denies disaster aid, tells states to do more,” Stateline.com, April 25, 2025. Available at: https://stateline.org/2025/04/25/trump-denies-disaster-aid-tells-states-to-do-more/.
[11] The Stafford Act governs federal emergency response. The language in it strongly suggests meaningful federal response post-disaster. https://www.govinfo.gov/content/pkg/COMPS-2977/pdf/COMPS-2977.pdf.
[12] Burks, Hoagland, “2025 Reconciliation Debate: Senate Health Provisions, June 18, 2025” and “2025 Reconciliation Debate: House Health Provisions, May 14, 2025.” Available at: https://bipartisanpolicy.org/explainer/2025-reconciliation-health-provisions/ and https://bipartisanpolicy.org/explainer/2025-reconciliation-debate-health-provisions-senate/
[13] Joseph Walker, “Democratic States Expanded healthcare to undocumented immigrants. Now They’re Rollling it Back.” Wall Street Journal, June 19, 2025. Available at: https://www.wsj.com/health/healthcare/medicaid-undocumented-immigrants-california-illinois-minnesota-962b3124?gaa_at=eafs&gaa_n=ASWzDAgwDwgObzk-_3-yUtcDg3qZPiDA3n3zJ5CRm8o0qSL3Vo5_LOyzlQmGG4wIPRw%3D&gaa_ts=6855948b&gaa_sig=ktIEKlnjnj7s1Av4eHlFqZJKHQYq-mOfZLc5ZOqtX1nRI2NIpUAGuxXoMvZ5er1d8SqT7CO9HADGL0XkH39LAw%3D%3D
[14] See section 70120 of the One Big Beautiful Bill Act (OBBBA).
[15] Cleary Gottlieb, “U.S. Congress Passes ‘One Big Beautiful Bill”: Tax Aspects, July 3, 2025. Available at: https://www.clearygottlieb.com/news-and-insights/publication-listing/us-congress-passes-one-big-beautiful-bill-tax-aspects.
[16] Walczak, “Senate Soften Blow for Pass-throughs Using Current SALT Workarounds,” Tax Foundation, June 18, 2025.
[17] For more detail, see: “Mucenski-Keck and Ramos, “Federal imlications of passthrough entity tax elections,” The Tax Advisor, November 1, 2022.
[18] Bloomberg US Municipal Long Term issuance by Industry (Tax Exempt), as of July 1, 2025.
[19] Committee for Responsible Federal Budget (June 4, 2025 estimate for House proposal, $3 trillion, and June 23, 2025, estimate for Senate proposal, $4.2 trillion). Available at: https://www.crfb.org/blogs/cbo-estimates-3-trillion-debt-house-passed-obbba, https://www.crfb.org/press-releases/senate-current-policy-gimmicks-mask-42-trillion-borrowing.
[20] Refinitiv data as of 6/13/2025.
[21] Ibid.
[22] For a complete list of cases, see: https://www.lawfaremedia.org/projects-series/trials-of-the-trump-administration/tracking-trump-administration-litigation.
[23] Thirteen (13) of 19 Federal Open Market Committee (FOMC) participants expect the Fed Funds rate to be 3.625% or lower by year-end 2026. See FOMC Projection materials, June 18, 2025. Available at: https://www.federalreserve.gov/monetarypolicy/fomcprojtabl20250618.htm.
[24] For example, the Michigan Consumer Sentiment Index picked up in May 2025. Available at: https://www.sca.isr.umich.edu/.
BCAI-07152025-qt53jrlw (07/17/2025)
DISCLAIMERS:
This material provides general information and should not be construed as a solicitation or offer of services or products or as legal, tax or investment advice. Nothing contained herein should be considered a guide to security selection, asset allocation or portfolio construction.
All information and opinions are current as of the dates indicated and are subject to change. Breckinridge believes the data provided by unaffiliated third parties to be reliable but investors should conduct their own independent verification prior to use. Some economic and market conditions contained herein have been obtained from published sources and/or prepared by third parties, and in certain cases have not been updated through the date hereof.
There is no assurance that any estimate, target, projection or forward-looking statement (collectively, “estimates”) included in this material will be accurate or prove to be profitable; actual results may differ substantially. Breckinridge estimates are based on Breckinridge’s research, analysis and assumptions. Other events that were not considered in formulating such projections could occur and may significantly affect the outcome, returns or performance.
Not all securities or issuers mentioned represent holdings in client portfolios. Some securities have been provided for illustrative purposes only and should not be construed as investment recommendations. Any illustrative engagement or sustainability analysis examples are intended to demonstrate Breckinridge’s research and investment process.
Yields and other characteristics are metrics that can help investors in valuing a security, portfolio or composite. Yields do not represent performance results but they are one of several components that contribute to the return of a security, portfolio or composite. Yields and other characteristics are presented gross of advisory fees.
All investments involve risk, including loss of principal. No investment or risk management strategy, including diversification, can guarantee positive results or risk elimination in any market. Periods of elevated market volatility can significantly impact the value of securities. Investors should consult with their advisors to understand how these risks may affect their portfolios and to develop a strategy that aligns with their financial goals and risk tolerances.
Past performance is not indicative of future results. Breckinridge makes no assurances, warranties or representations that any strategies described herein will meet their investment objectives or incur any profits. Performance results for Breckinridge’s investment strategies include the reinvestment of interest and any other earnings, but do not reflect any brokerage or trading costs a client would have paid. Results may not reflect the impact that any material market or economic factors would have had on the accounts during the time period. Due to differences in client restrictions, objectives, cash flows, and other such factors, individual client account performance may differ substantially from the performance presented.
Actual client advisory fees may differ from the advisory fee used to calculate net performance results. Client returns will be reduced by the advisory fees and any other expenses incurred in the management of their accounts. For example, an advisory fee of 1 percent compounded over a 10-year period would reduce a 10 percent return to a 9 percent annual return. Additional information on fees can be found in Breckinridge’s Form ADV Part 2A.
Index results are shown for illustrative purposes and do not represent the performance of any specific investment. Indices are unmanaged and investors cannot directly invest in them. They do not reflect any management, custody, transaction or other expenses, and generally assume reinvestment of dividends, income and capital gains. Performance of indices may be more or less volatile than any investment strategy.
Fixed income investments have varying degrees of credit risk, interest rate risk, default risk, and prepayment and extension risk. In general, bond prices rise when interest rates fall and vice versa.
Equity investments are volatile and can decline significantly in response to investor reception of the issuer, market, economic, industry, political, regulatory or other conditions.
BLOOMBERG® is a trademark and service mark of Bloomberg Finance L.P. and its affiliates (collectively “Bloomberg”). Bloomberg does not approve or endorse this material or guarantees the accuracy or completeness of any information herein, or makes any warranty, express or implied, as to the results to be obtained therefrom and, to the maximum extent allowed by law, neither shall have any liability or responsibility for injury or damages arising in connection therewith.
The S&P500 Index (“Index”) and associated data is a product of S&P Dow Jones Indices LLC, its affiliates and/or their licensors and has been licensed for use by Breckinridge. © 2025 S&P Dow Jones Indices LLC, its affiliates and/or their licensors. All rights reserved. Redistribution or reproduction in whole or in part are prohibited without written permission of S&P Dow Jones Indices LLC. For more information on any of S&P Dow Jones Indices LLC’s indices please visit www.spdji.com. S&P® is a registered trademark of Standard & Poor’s Financial Services LLC (“SPFS”) and Dow Jones® is a registered trademark of Dow Jones Trademark Holdings LLC (“Dow Jones”). Neither S&P Dow Jones Indices LLC, SPFS, Dow Jones, their affiliates nor their licensors (“S&P DJI”) make any representation or warranty, express or implied, as to the ability of any index to accurately represent the asset class or market sector that it purports to represent and S&P DJI shall have no liability for any errors, omissions, or interruptions of any index or the data included therein.

