Municipal
Perspective published on May 10, 2023
Considering the Municipal Bond Market Implications of ETF Asset Growth
Summary
- Growth of municipal bond exchange-traded funds (ETF) assets accelerated from 2019 to 2022.
- During a rising interest rate environment in 2022, ETFs were utilized by investors increasingly more than traditional mutual funds.
- As ETF assets grow, municipal bond investors may want to consider the implications for certain segments of the municipal market.
Municipal bond exchange-traded fund (ETF) asset flows accelerated dramatically higher in recent years. Municipal ETF assets under management broke the $100 billion dollar threshold in 2022.1 Municipal market observers attributed the growth trend to influences that ranged from a pick-up in demand among financial advisors’ model portfolios to tax-loss harvesting driven by the Federal Reserve’s (Fed’s) aggressive rate-hiking cycle in 2022.2
While some of the drivers of the trend may be more short-lived than others, municipal bond ETFs now hold a more prominent position among investing options.3 Investors may want to consider some implications of a larger ETF presence in the municipal market.
Placing municipal bond ETF growth in context: A look back
Equity ETFs first launched in 1993.4 Municipal bond ETFs followed 14 years later when Barclays Global Investors launched iShares S&P National Municipal Bond Fund (ticker: MUB) on the American Stock Exchange.5 Other large mutual fund companies followed with similar municipal bond ETFs.
For years following MUB’s launch, municipal ETFs didn’t build a substantial market presence. As of October 7, 2021, for example, municipal ETFs held only 6.8 percent of total fixed income ETF assets globally.6 The municipal bond ETF market at the beginning of 2019 was about $50 billion, just slightly over 1 percent of the approximately $4 trillion overall municipal bond market. Globally, assets invested in ETFs topped $9.2 trillion at the end of 2022, according to Pensions & Investments.
ETFs can offer investor advantages. They trade throughout the day, offering quicker market access than traditional mutual funds. They also tend to be lower cost investing options because, like index mutual funds, ETFs typically are passively managed. They seek to replicate the performance of a broad market index by holding similar securities in similar proportion as an index.
Muni market participants were not surprised that muni ETF's were not a larger part of the overall muni market. Primary goals for many municipal bond investors usually are long term in nature. We believe that goals of income stability and capital preservation over time are less reliant on quick access in and out of markets that ETFs offer.
The growth of municipal ETF assets to $100 billion entering 2023 occurred at a time when municipal mutual funds were experiencing historic outflows due to rate volatility that started in early 2022.
This appears even more noteworthy when you look back at other periods of bond market volatility and mutual fund outflows. As Figure 1 illustrates, prior to 2022, there wasn’t much to glean from municipal bond ETF activity when municipal mutual fund outflows picked up, but last year illustrated a marked shift in municipal bond investor demand.

Given historic interest rate hikes and volatility in 2022, many municipal bond market observers agreed that the lion’s share of municipal bond ETF inflows in 2022 was attributable to tax-loss harvesting.7 Tax-loss harvesting activity is likely to decline moving forward as rates, prices, and yields stabilize.
Two other factors driving higher ETFs flows may persist: 1) the growth of model portfolios that value an ETF investment approach and 2) ETF costs, particularly large, passive ETFs, relative to mutual funds.
Municipal ETFs: Taking a closer look
The longer-term potential for continued municipal bond ETF growth makes a closer look at two of the largest municipal ETFs worthwhile, as advisors and investors consider their options. Two ETFs, MUB and Vanguard Tax-Exempt Bond Index Fund ETF (ticker: VTEB), hold more than half of the municipal market’s ETF assets under management (AUM) and account for the majority of more recent asset growth.8
A look at market exposure for MUB and VTEB offers insights and suggests conclusions.

While both ETFs are within the intermediate duration spectrum, MUB’s duration is over a year longer, suggesting the higher end of the intermediate universe in terms of interest rate risk. VTEB has lower duration and higher average maturity. The significant difference between duration and average maturity potentially suggests more exposure to callable bonds and associated extension risk.
The standard deviation9 of both ETFs exceed 6 percent. We believe that is relatively high for the intermediate space. For example, standard deviation is 4.91 percent for Breckinridge’s preferred intermediate duration benchmark, Bloomberg’s Managed Money Short/Intermediate Index.10 The relatively high quality of the ETFs suggests that likely their higher volatility level is due to higher interest rate risk, in large part.
Both ETFs use National municipal benchmarks. Still, their two largest state holdings are in New York and California by a significant margin, about 40 percent combined for both ETFs. Most strategies with a National municipal benchmark may be expected to invest more frequently in low- or zero-tax states, such as Texas, Florida and Washington. A bias to low- or zero-tax state bonds may be attributable to the generally higher yields offered on these bonds when compared to than higher-tax states such as New York and California, all else equal. (See: How to Invest In-State vs. Out-of-State in Muni Bonds).
Given their passive nature, New York and California overweights may not be the result of a strategic decision. Instead, the outsized allocations to two high-tax states in a National portfolio may be due to the operational ease for ETFs to buy some of the market’s largest debt issuers. Simply, the available market supply of New York and California bonds tends to be higher than other states.
To underscore this point, Figure 3 shows the top 10 holdings for MUB, the largest national municipal bond ETF, as well as the municipal market’s top 15 issuers of debt (based on overall debt outstanding).

As Figure 3 illustrates, MUB’s top 10 holdings reflect a bias to large issuers. More than 28 percent of the total portfolio is comprised of bonds from among the 15 issuers with the largest municipal debt outstanding. The largest and most indebted bond issuers in the market tend to exhibit relatively higher market betas, a measure of a security's volatility or systemic risk, due to their indebtedness and relative size within the market.
Investing such a large percentage of a portfolio in the bond market’s largest debt and higher beta names, may seem anathema to most bond investors. However, when considered in the context of an ETF’s goal to provide quick and efficient market access, a meaningful exposure to issuers with higher levels of bond debt outstanding would make more sense. (For additional perspective, see When to Bench the Municipal Bond Benchmark.)
On February 9, 2023, Barclays reported, “We find that bonds included in IG ETFs outperformed those that were not included by more than 1 percent.”11 (See Figure 4) The report explains that because indices tracked by ETFs consist of thousands of individual CUSIP (Committee on Uniform Securities Identification Procedures) numbers. ETFs, which hold only a fraction of the bonds tracked in the indices, likely invest in larger CUSIP sizes “which tend to be more liquid.”

It is possible, in our view, that outperformance of bonds held in ETFs during 2022, compared to bonds of other issuers in the same sectors and not held in ETFs may be attributable to significant ETF inflows in 2022, that were invested in the largest debt issuers, whose bonds tend to have higher market betas.
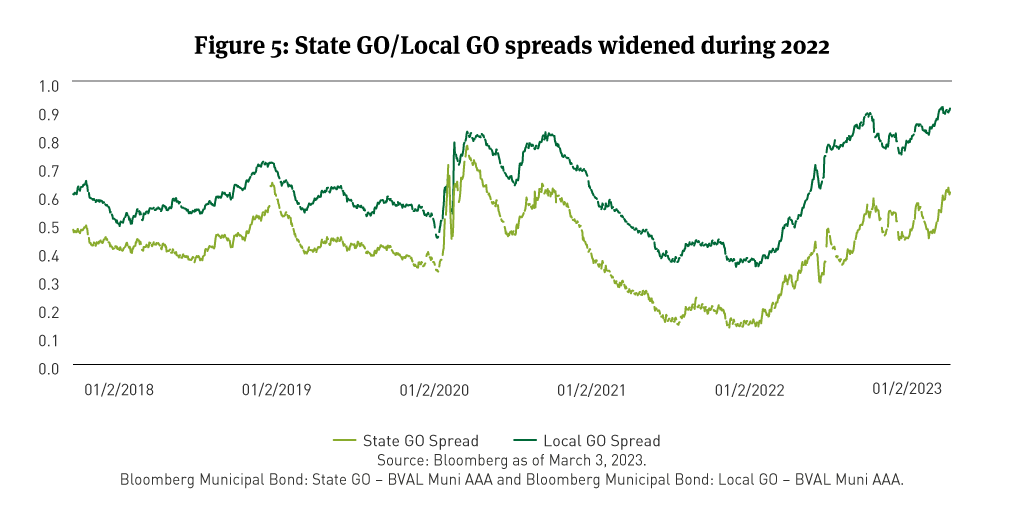
For example, as shown in Figure 5, spreads on State GOs remained tighter than Local GOs, in 2022, the period of time when net flows were consistently positive into municipal ETFs—largely MUB and VTEB.
If, as we believe to be the case, higher buying activity among ETFs of bonds from the largest issuers had a pricing impact, we would expect the effect to continue to the extent that assets invested in municipal bond ETFs continue to grow.
Future implications of municipal ETF prominence for advisors and investors
From our point of view, the growth of the municipal bond ETF market is generally a positive for municipal bond investors, especially those investors who historically accessed the market through open- and closed-end mutual funds. Based on the ability to trade them intraday (traditional mutual funds trade after market close) and the typically lower management costs of passive investment approaches compared with costs for actively managed mutual funds, municipal bond ETFs can offer diversification and consistent liquidity at lower costs.
That said, we observe and anticipate market implications that advisors and investors may not fully appreciate at this early stage of ETF growth. A larger ETF municipal bond market could bring more volatility during market sell-offs, particularly if hedging and leverage become prominent, as they have in other asset classes where ETF use has grown.
In the near term, we already have observed potential market pricing effects such as larger beta issuers becoming more expensive relative to smaller issuers and the broader municipal market. Additionally, larger bellwether names among large state-preference or specific markets such as California and New York have become expensive. Although these pricing effects can’t be singularly attributed to the municipal bond ETF market, in our view, ETF buying had an impact in 2022 and could provide similar momentum going forward.
While mutual funds, including ETFs, may be suitable for many investors, often because they may have lower investment minimums than separate accounts, our view as a manager of separately managed accounts, as it is always, is to be thoughtful about allocating capital when building a diversified municipal bond portfolio. Leveraging our deep credit research team, we believe covering a broad segment of municipal credits allows us to be more selective and less beholden to a shorter list of large beta market names.
[1] “Municipal Bond ETFs: Liquidity Impact on the Municipal Bond Market,” Simon Z. Wu and Meghan Burns, Municipal Securities Rulemaking Board, April 2018, based on the data from Investment Company Institute (ICI).
[2] “Muni-Bond ETFs Lure $28 Billion as Mutual Funds Bleed Cash ,” Bloomberg News, By Martin Z Braun, December 13, 2022.
[3] “Muni-Bond ETFs Lure $28 Billion as Mutual Funds Bleed Cash ,” Bloomberg News, By Martin Z Braun, December 13, 2022.
[4] “A Brief History of Exchange-Traded Funds,” Investopedia, Steven D. Simpson, January 31, 2022.
[5] “Barclays launches first U.S. muni bond ETF,” Reuters, September 10, 2007.
[6] “The Rise of Tax-Free Municipal Bond ETFs,” Carrie Gordon, October 31, 2021.
[7] Muni-Bond ETFs Lure $28 Billion as Mutual Funds Bleed Cash ,” Bloomberg News, By Martin Z Braun, December 13, 2022.
[8] Assets under management (AUM) in MUB were $32.4 billion at, while AUM in VTEB were $28.7 billion, as of 5/3/23 13, 2023, as reported by iShares.com and Vanguard.com, respectively. See also “Muni ETFs Gaining Assets From Mutual Funds,” February 14, 2023. Total AUM in municipal bond ETFs, based on Barclays data reported by etf.com in its “Municipal Overview” were $80.3 billion as of 5/3/23.
[9] In statistics, the standard deviation is a measure of the amount of variation or dispersion of a set of values. A low standard deviation indicates that the values tend to be close to the mean (also called the expected value) of the set, while a high standard deviation indicates that the values are spread out over a wider range.
[10] Breckinridge believes the Managed Money Short/Intermediate Index is an appropriate index for its intermediate tax-efficient strategies based on a shorter average maturity than the 1-10 Year Blend, the relatively lower number of callable bonds in the index, and its slightly longer and more stable duration. It also has a higher credit quality profile, which excludes nonessential-service revenue and AMT bonds, making it more consistent with Breckinridge’s standard parameters and investment style. Moreover, while no municipal index is investable, Breckinridge considers the Managed Money Short/Intermediate to be more representative of the municipal market because its constituents are limited to bonds issued within the past five years. In contrast, almost half of the constituents of the 1-10 Year Blend are bonds issued over five years ago, which trade far less frequently than more recently issued bonds.
[11] “ETFs - May the Force be With You,” Mayur Patel, CFA, Clare Pickering, Mikhail Foux, Zornista Tordorova, February 9. 2023.
# BCAI-04052023-uwofhidb (5/9/2023)
DISCLAIMER:
This material provides general and/or educational information and should not be construed as a solicitation or offer of Breckinridge services or products or as legal, tax or investment advice. The content is current as of the time of writing or as designated within the material. All information, including the opinions and views of Breckinridge, is subject to change without notice.
There is no assurance that any estimate, target, projection or forward-looking statement (collectively, “estimates”) included in this material will be accurate or prove to be profitable; actual results may differ substantially. Breckinridge estimates are based on Breckinridge’s research, analysis and assumptions. Other events that were not considered in formulating such projections could occur and may significantly affect the outcome, returns or performance.
Not all securities or issuers mentioned represent holdings in client portfolios. Some securities have been provided for illustrative purposes only and should not be construed as investment recommendations. Any illustrative engagement or ESG analysis examples are intended to demonstrate Breckinridge’s research and investment process.
Past performance is not a guarantee of future results. Breckinridge makes no assurances, warranties or representations that any strategies described herein will meet their investment objectives or incur any profits. Any index results shown are for illustrative purposes and do not represent the performance of any specific investment. Indices are unmanaged and investors cannot directly invest in them. They do not reflect any management, custody, transaction or other expenses, and generally assume reinvestment of dividends, income and capital gains. Performance of indices may be more or less volatile than any investment strategy.
Performance results for Breckinridge’s investment strategies include the reinvestment of interest and any other earnings, but do not reflect any brokerage or trading costs a client would have paid. Results may not reflect the impact that any material market or economic factors would have had on the accounts during the time period. Due to differences in client restrictions, objectives, cash flows, and other such factors, individual client account performance may differ substantially from the performance presented.
All investments involve risk, including loss of principal. Diversification cannot assure a profit or protect against loss. Fixed income investments have varying degrees of credit risk, interest rate risk, default risk, and prepayment and extension risk. In general, bond prices rise when interest rates fall and vice versa. This effect is usually more pronounced for longer-term securities. Income from municipal bonds can be declared taxable because of unfavorable changes in tax laws, adverse interpretations by the IRS or state tax authorities, or noncompliant conduct of a bond issuer.
The effectiveness of any tax management strategy is largely dependent on each investor’s entire tax and investment profile, including investments made outside of Breckinridge’s advisory services. As such, there is a risk that the strategy used to reduce the tax liability of the investor is not the most effective for that investor. Breckinridge is not a tax advisor and does not provide personal tax advice. Investors should consult with their tax professionals regarding tax strategies and associated consequences.
Federal and local tax laws can change at any time. These changes can impact tax consequences for investors, who should consult with a tax professional before making any decisions.
Separate accounts may not be suitable for all investors.
Breckinridge believes the data provided by unaffiliated third parties to be reliable but investors should conduct their own independent verification prior to use. Some economic and market conditions contained herein have been obtained from published sources and/or prepared by third parties, and in certain cases have not been updated through the date hereof. All information contained herein is subject to revision.
Certain third parties require us to include the following language when using their information:
BLOOMBERG® is a trademark and service mark of Bloomberg Finance L.P. and its affiliates (collectively “Bloomberg”). Bloomberg does not approve or endorse this material or guarantees the accuracy or completeness of any information herein, or makes any warranty, express or implied, as to the results to be obtained therefrom and, to the maximum extent allowed by law, neither shall have any liability or responsibility for injury or damages arising in connection therewith.