Municipal
Perspective published on November 20, 2025
CA Credit and the Risk of an AI Bubble
Summary
- California's fiscal resilience is supported by a historically strong general fund reserve position, notwithstanding recent declines.
- The state also benefits from a lower bonded debt burden and net pension liability in recent years.
- Beyond the State of California, some public power issuers and local governments may face risks from an artificial intelligence (AI)-driven economic correction.
Gita Gopinath, a former International Monetary Fund (IMF) chief economist, recently estimated that an AI-driven stock market correction could reduce U.S. household net worth by $20 trillion and U.S. gross domestic product (GDP) by 2 percent.1
High-grade municipal bond portfolios typically weather equity market corrections ably. The essential service bonds that dominate the rated municipal market are backed by monopoly service providers and typically come with strong security pledges, like unlimited tax or utility rate hikes. Nearly 20 percent of the market is backed with credit enhancement.2 Furthermore, investors in separately managed accounts (SMAs) have flexibility to hold their bonds to maturity if a correction weakens bond pricing or liquidity.
But what about California?
Nonetheless, it is reasonable for investors in State of California bonds to ask: “What happens to California’s credit fundamentals if the AI boom reverses?”
The State of California’s tax structure is notoriously volatile and highly correlated with asset prices. Going back to 2006, a 10 percent change in the level of the S&P 500 is associated with a 4 percent change in state tax revenue (See Figure 1). This math suggests that an AI-driven 40 percent decline in stock prices could result in a 16 percent drop in tax revenue. A decline of that magnitude would likely pressure California’s fiscal health, given its high cost of living and already elevated tax burden relative to peers.3

California’s tax volatility stems from its reliance on progressive income tax rates and its concentrated tax base. The state imposes a 12 percent marginal income tax rate on joint filers earning more than $1 million.4 These taxpayers earn 22 percent of the state’s personal income but pay 39 percent of its personal income taxes.5 This approach to tax policy results in fiscal booms and busts, as nearly 60 percent of the state’s general fund comprises personal income taxes.6
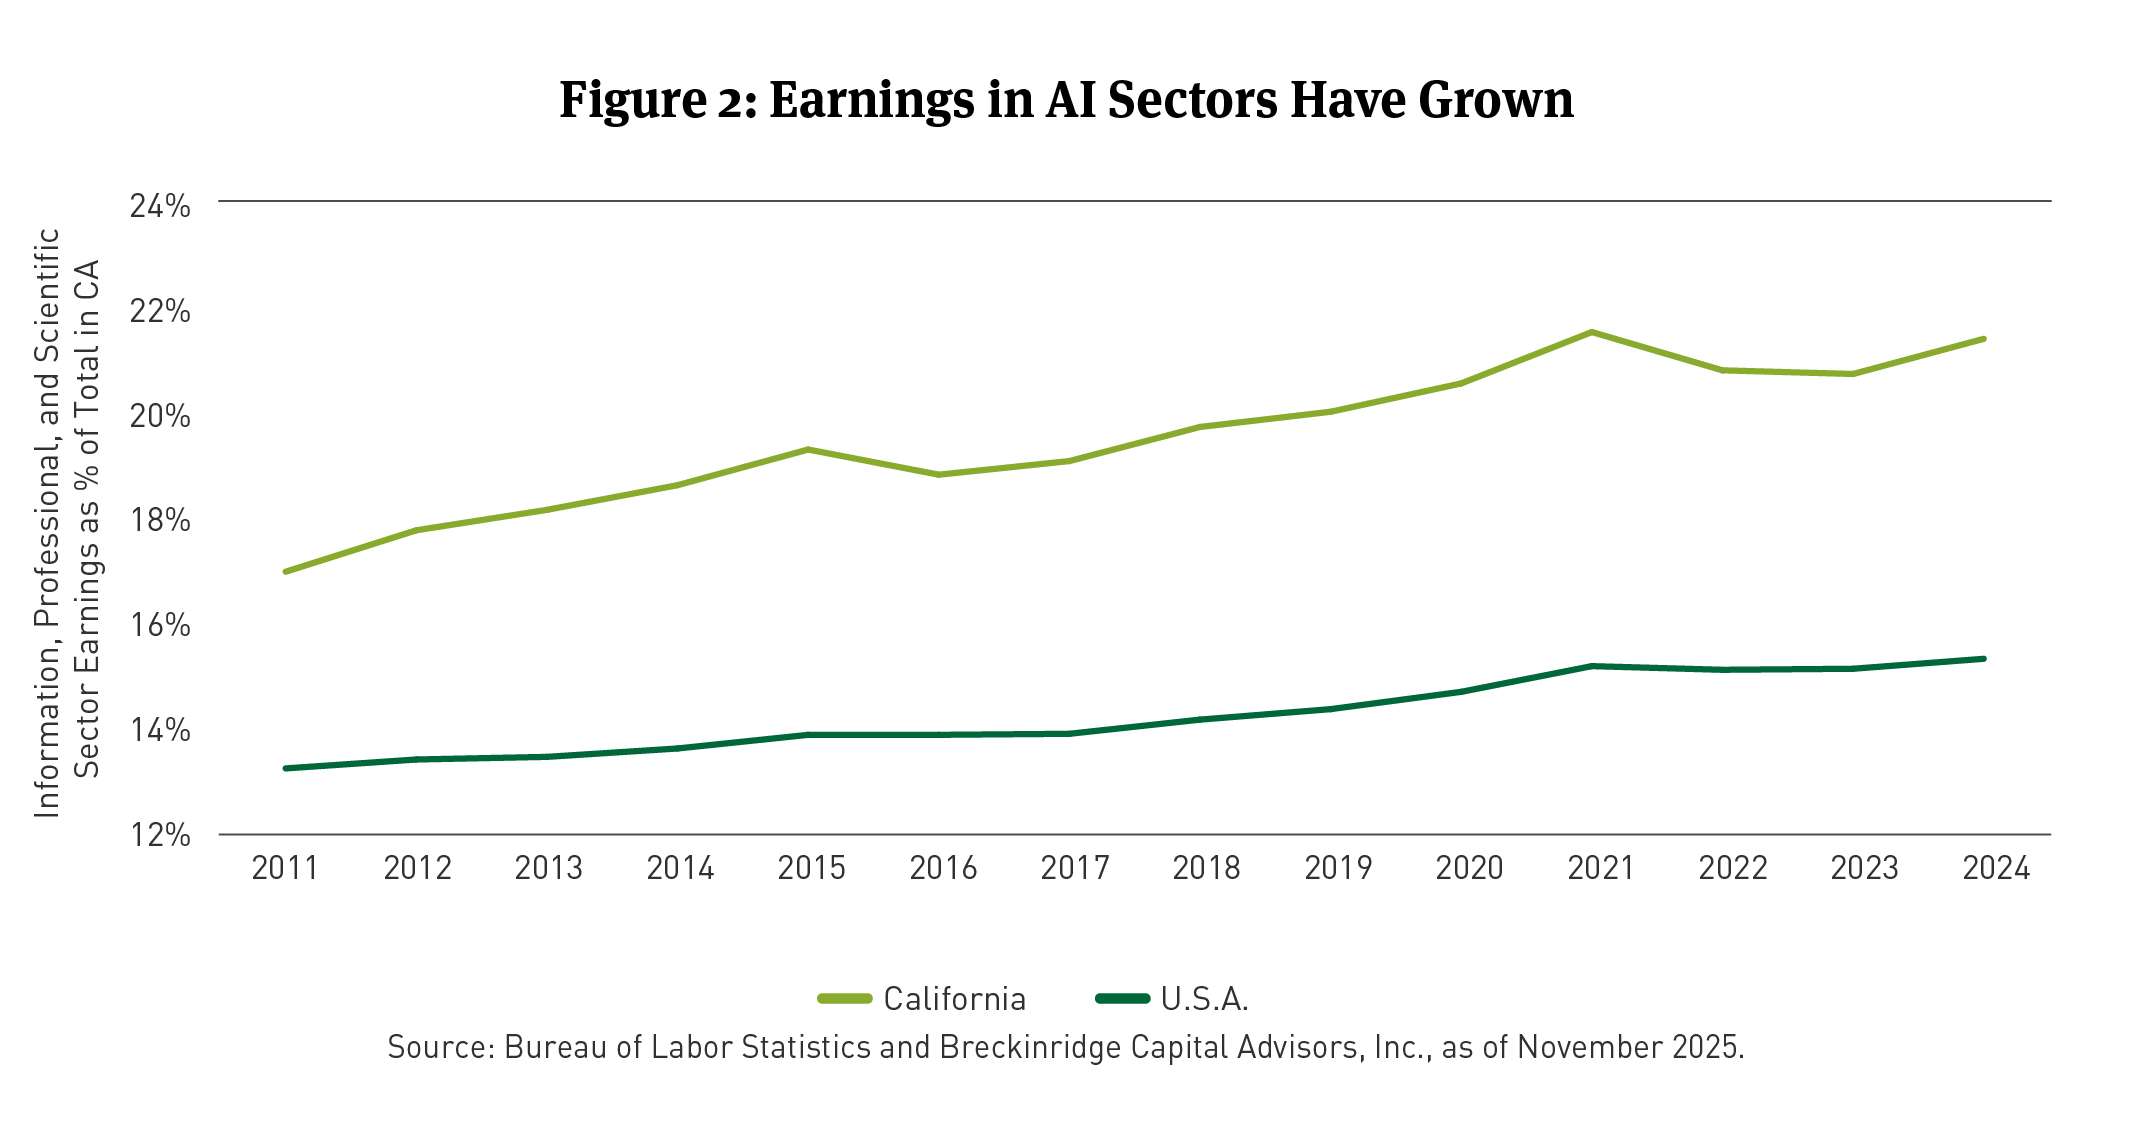
California’s income tax base may also be more correlated with the fate of AI than it was a few years ago given the state’s employment profile. AI employment is largely captured in the Information and Professional/Scientific sectors, per the Bureau of Labor Statistics. Payroll earnings from these sectors increased from 17 percent to over 21 percent of the California total (See Figure 2).
Additionally, the state’s pension systems are exposed to an AI correction. California contributes to two major pension plans: CalPERS (for state employees) and CalSTRS (for teachers). Combined, public and private equity comprise 55 percent and 52 percent of each plan, respectively.7 At present, both plans are underfunded, despite recent equity market increases.8 The funds might experience weak returns if the market reassesses AI’s value proposition.9 State contributions to the funds would subsequently rise.
Further complicating California’s fiscal picture is a more uncertain and austere federal policymaking environment. Federal aid may be less likely to flow after a correction, as it did in 2001, 2007-09, or 2020: Congress has struggled to pass a continuing resolution in recent months. Medicaid cuts are scheduled for 2027 and 2028, and the executive branch has withheld federal aid to states for a mix of reasons.
How concerned should California investors be?
In our view, a little. A California rating downgrade in the aftermath of a sharp market correction is very possible. We believe a significant degree of budget discipline over a multi-year period would be required to maintain the state’s fiscal balance after a correction and note the Legislative Analysts’ Office (LAO) recently described the state’s budget position as “weak”.10 Nonetheless, California’s fiscal stress would likely prove more manageable than during the post-2008 period. In our view, it makes just as much sense to consider AI’s impact on other sectors and the economy as it does to worry about California.
We note the following:
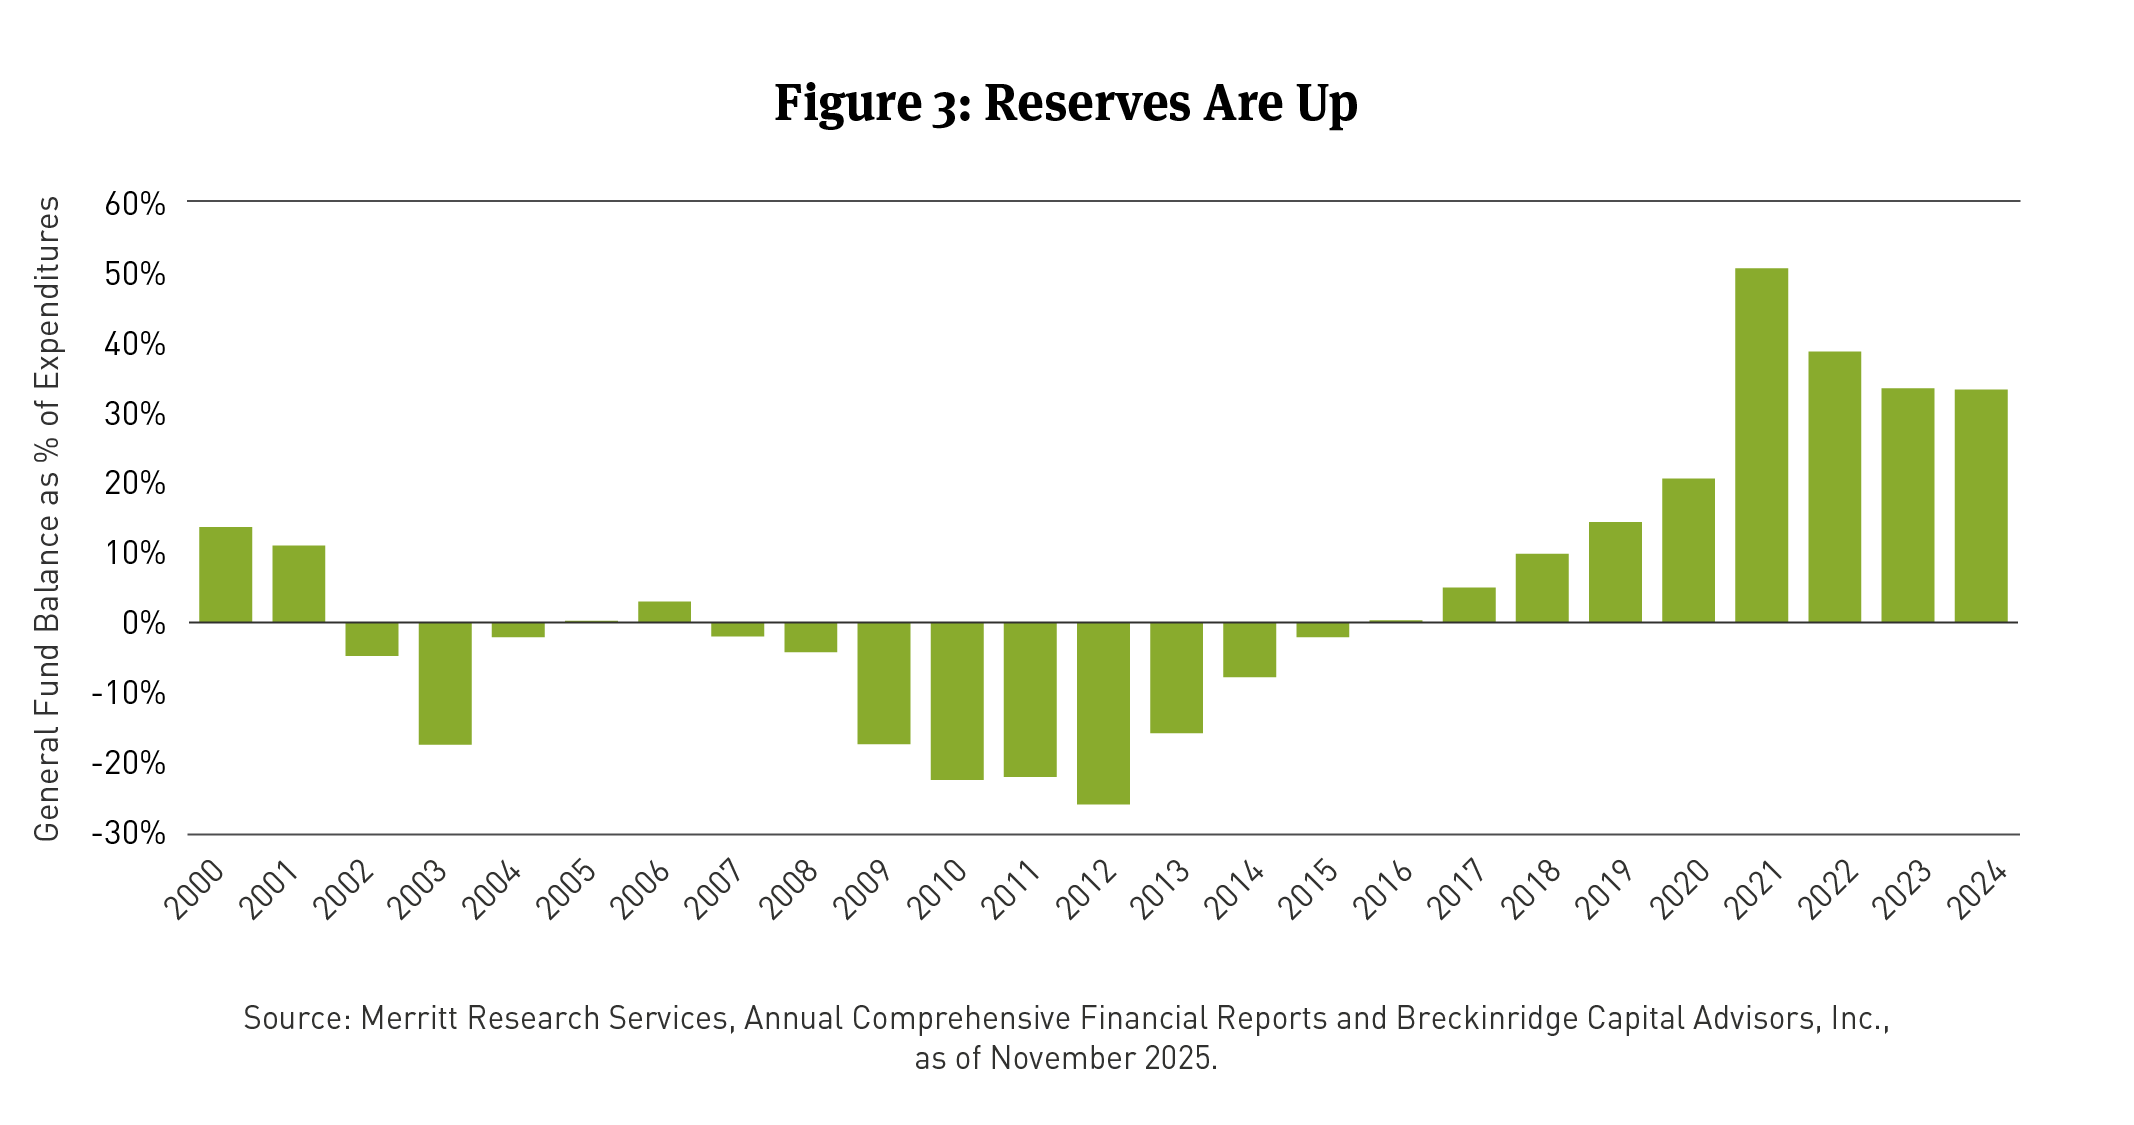
1. The state is liquid. California’s tax collections exceed budget targets, year-to-date in Fiscal Year 2026 (FY26).11 Although the state plans to draw down reserves this year, the general fund’s starting reserve position is in reasonable shape (See Figure 3). Outside of the general fund, California has over $85 billion in borrowable resources, which it can use to lend to itself in a fiscal squeeze (an amount equivalent to 67 percent of budgeted general fund personal income taxes in FY26 and, 39 percent of general fund spending).12 These figures suggest the state could likely avoid external deficit borrowing in the event of a correction. Additionally, rating agencies would likely give the state time to draw down reserves and to craft steps to rebalance operations before taking meaningful rating action.
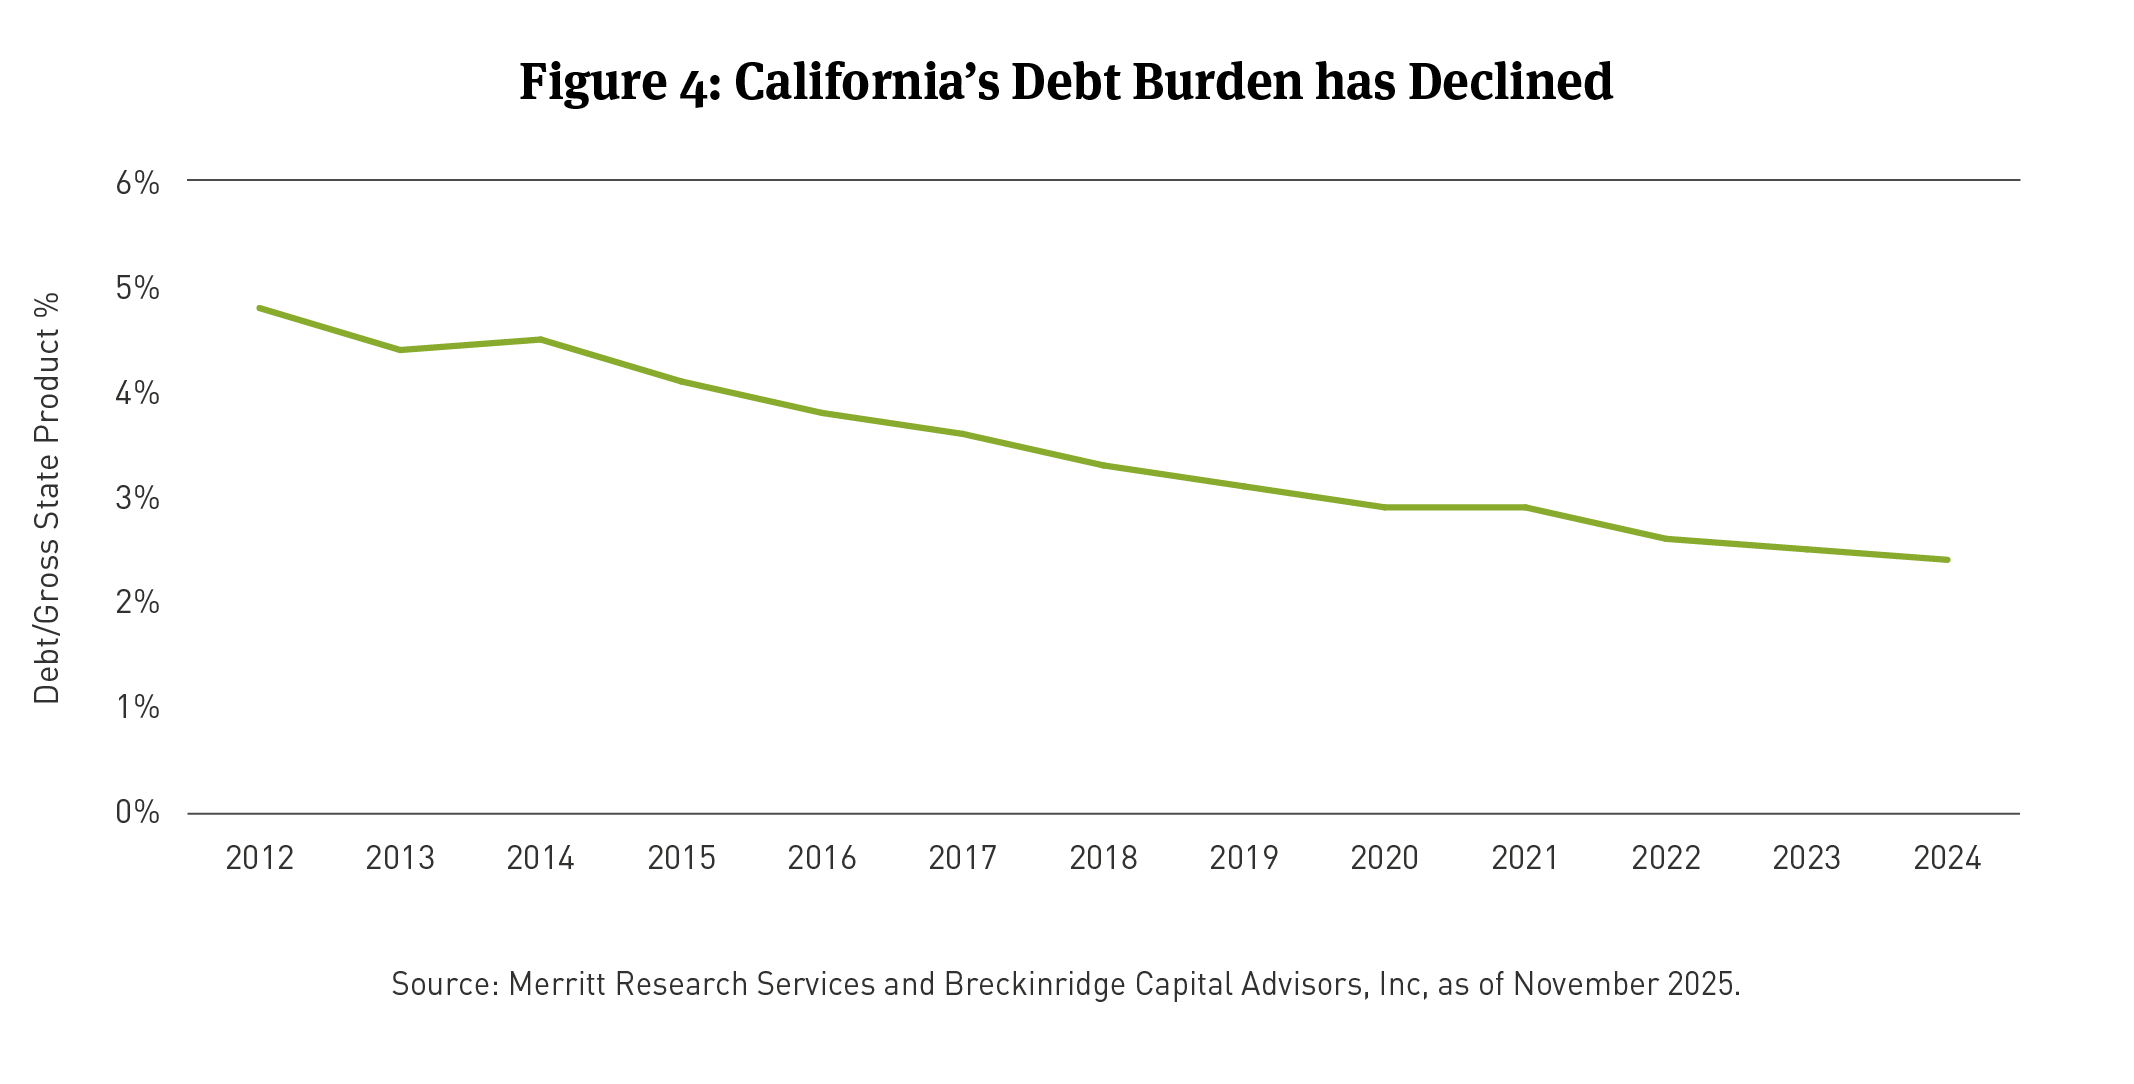
2. California’s bonded debt burden declined in recent years. Since 2012, the state’s debt burden declined by 50 percent to 2.4 percent of gross state product (GSP). The falling debt load largely reflects policy changes (See Figure 4), growth, and inflation. Annual principal and interest costs currently comprise under 3 percent of all-funds expenditures, offering the state additional flexibility in an economic downturn
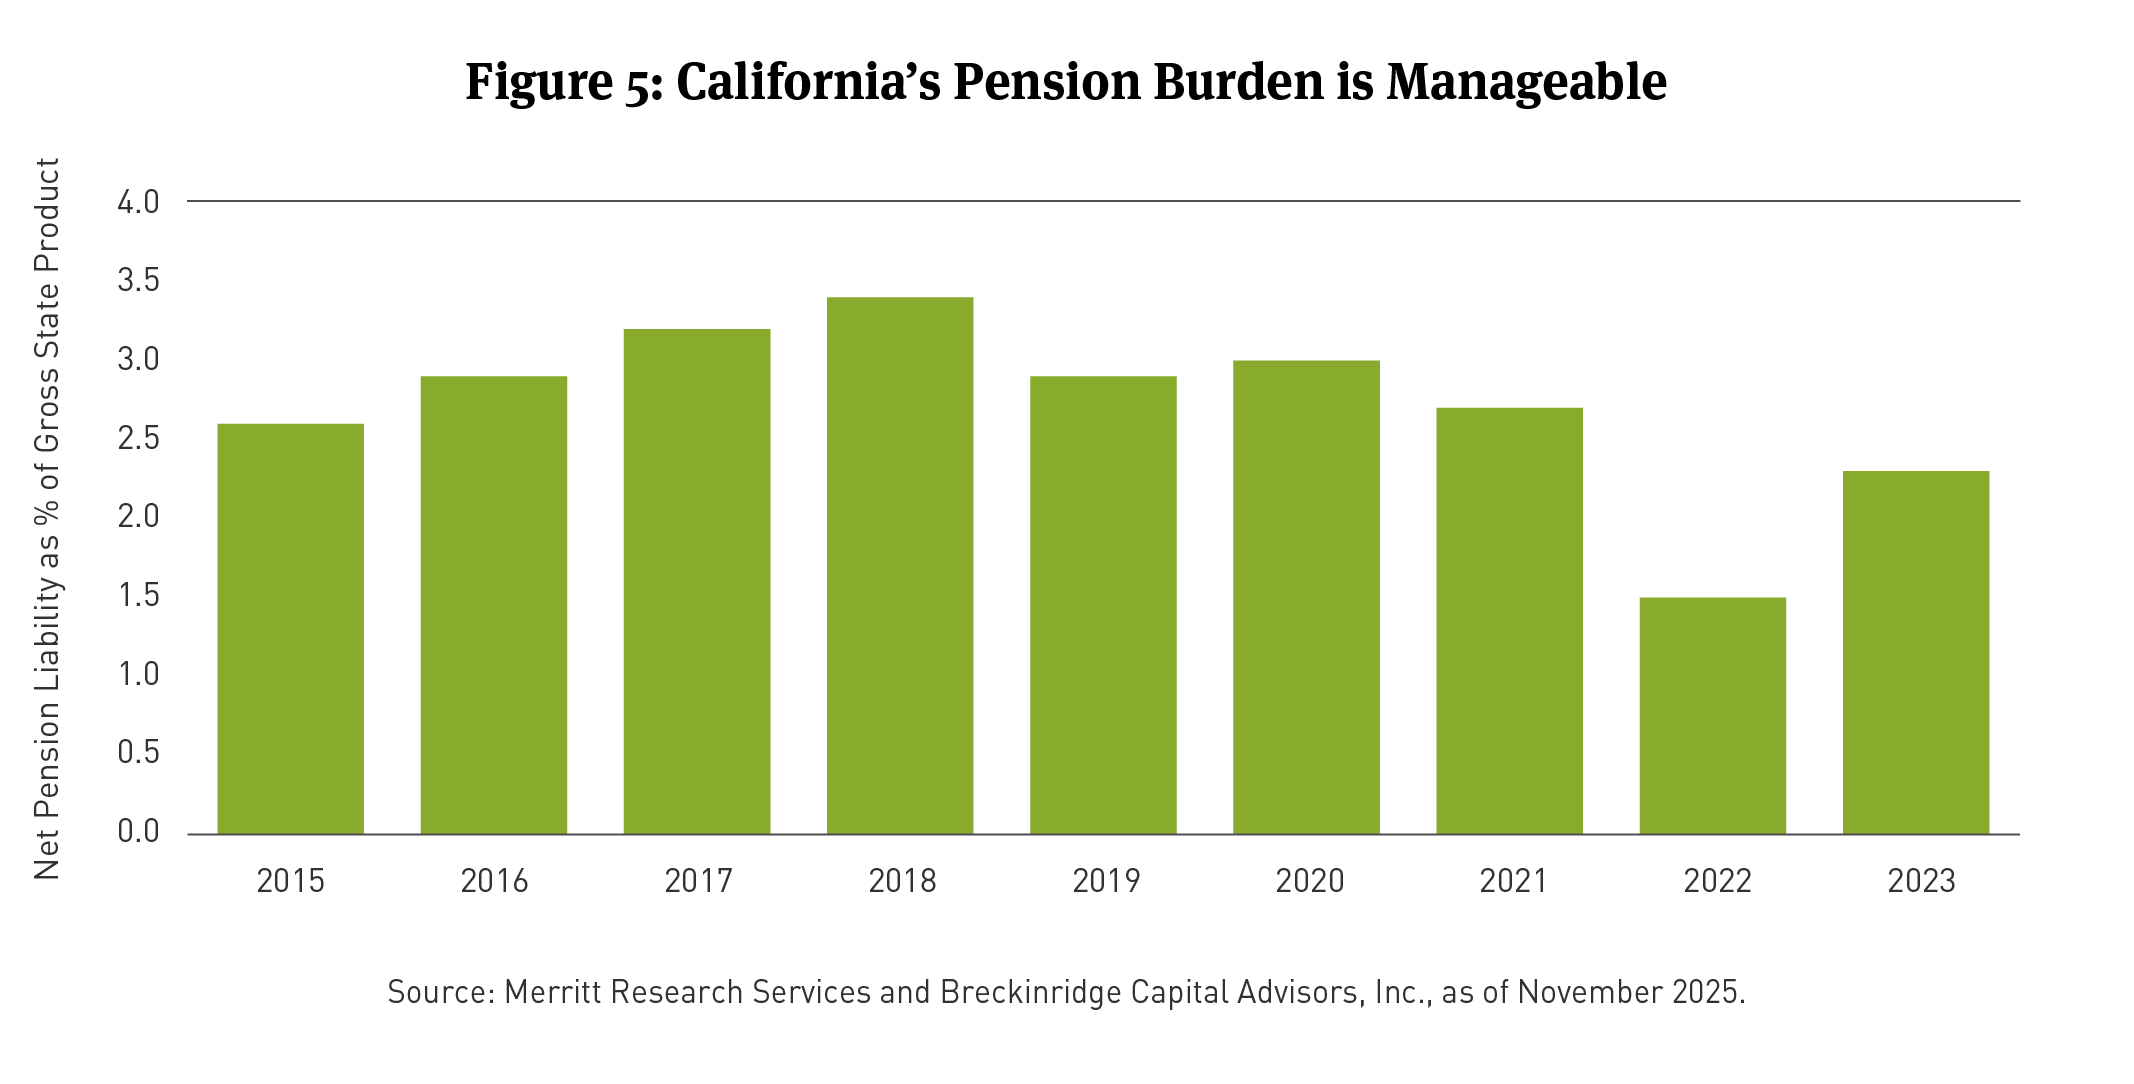
3. California’s pension funding stability also improved. The state’s net pension liability has declined from 3.4 percent of GSP in 2017 to 2.3 percent in the most recent year (See Figure 5). In the event of a large correction in equities markets, contributions into each fund will rise, but they will do so on a smoothed basis, meaning they will be amortized and paid from the budget over a period of years.13 Annual contributions for pension and retiree healthcare obligations were 4 percent of all-funds expenditures in FY24.14
4. Fiscal governance has improved since the last recession. Fiscal rules adopted in 2014 are a key reason reserves are up and debt is down. Voters amended the state constitution in that year to require annual transfers to the state’s rainy-day fund and the prepayment of debt.15 In an AI-driven downturn, the state would likely avoid adhering to these rules, instead declaring an emergency and drawing down reserves. But the existence of reserves increases the likelihood that the state would rebuild fiscal balance with reasonable speed, which reduces the potential for meaningful ratings downgrades.
5. Apart from credit concerns, we note that Breckinridge’s actively managed SMAs are typically underweight California exposures relative to major benchmarks. California bonds typically comprise 18 percent of intermediate municipal bond benchmarks. We aim for no more than a 5 percent California position in our intermediate strategies.16 Conversely, Breckinridge’s California-biased muni accounts are rarely 100 percent invested in California munis. We consider our client’s in-state marginal tax brackets when deciding whether to buy a California bond or an out-of-state security.
AI could impact other sectors and states, not just California
If the state of California likely has the fiscal resources and tools to manage through an AI correction, to which sectors of the municipal bond market might investors in California (and elsewhere) pay more attention? At a high level, a few market segments come to mind:
1. Issuers with significant asset market exposure either via a pension or endowment. Elevated pension contributions remain a credit albatross for some governments. Likewise, some hospitals and private higher education issuers rely, in part, on stock market returns to fund operations via endowments. These issuers may find an AI correction weakens their operating flexibility.
2. Public power. Away from the stock market, AI has spurred a capital spending (capex) boom in data centers. These data centers require electricity, and some public power issuers could procure power (or generate it) with an intent to resell to data centers that are eventually found with overcapacity. This kind of stranded asset risk can lead to ratepayer revolts. For now, Breckinridge sees little evidence of this kind behavior in the utilities we cover but remains vigilant to this possibility.
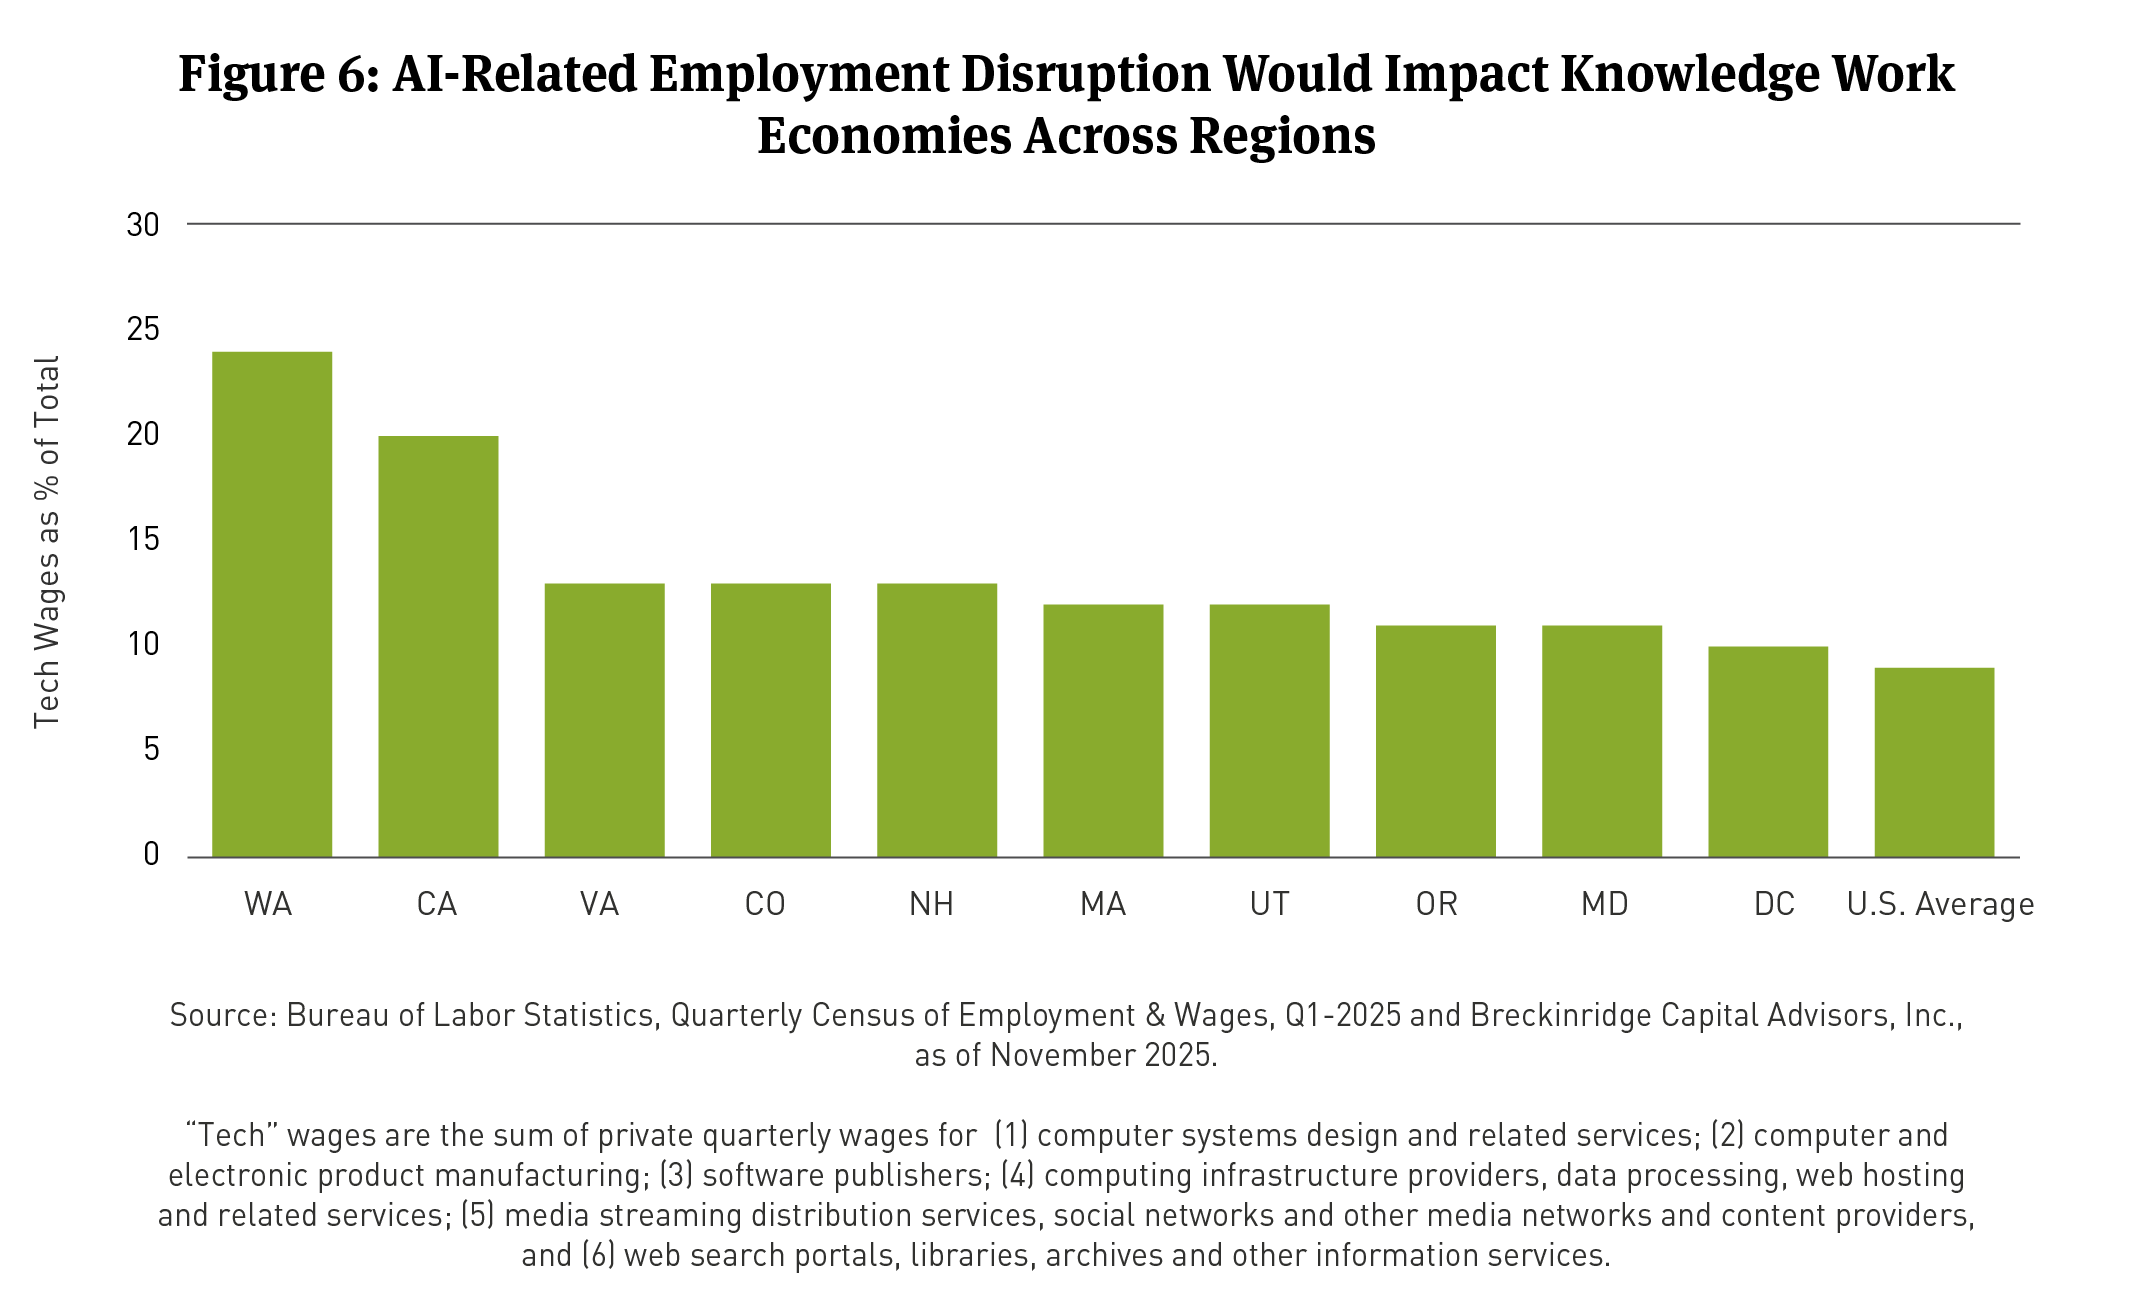
3. Local governments with exposure to tech layoffs. The AI transition may lead to significant net job losses in affluent knowledge-work regions. There are signs this is already happening in the tech sector, as AI replaces some software jobs. In addition to California, the states of Washington, Virginia, Colorado, New Hampshire and Massachusetts have meaningful exposure to AI-related employment disruption (See Figure 6). In our view, each of these states is, like California, reasonably well positioned to manage through such a transition. But specific localities within these states are likely to be more exposed, especially given that states typically reduce local aid in recessions.
Breckinridge expects the deployment of AI-related technologies to have a meaningful impact on markets and the real economy over the next several quarters and years. The broad credit impacts are presently unclear. But we anticipate that our independent underwriting and ability to customize separate accounts may benefit clients in California and elsewhere, to the degree the economy transitions swiftly.
[1] “Gita Gopinath on the crash that could torch $35 trillion of wealth,” Economist.com, October 15, 2025.
[2] Breckinridge calculation based on Bloomberg data, October 2025. For these purposes, enhancement means a bond insurer or a state-based program.
[3] The Tax Foundation ranks California 48th out of 50 states for tax competitiveness. See the Tax Foundation’s 2025 Tax Competitiveness Index.
[4] Tax Foundation data for calendar year 2025, rate applies to joint returns.
[5] Further complicating matters, variable capital gains income comprises ¼ of these taxpayers’ total adjusted gross income. See: State of California adjusted gross income figures (2022), available through the state’s Franchise Tax Board, Table B-4a.
[6] Per the state’s FY24 audit.
[7] Per pp. 127 and 145 of the state’s FY 24 audit.
[8] For FY 24, CalPERS has a 75% funded ratio, CalSTRS 77%.
[9] As of late October 2025, the combined market capitalization of the “Magnificent Seven” was roughly 35% of the entire S&P 500 index (Tesla, Meta, Amazon, Alphabet, Apple, Microsoft, Nvidia).
[10] California’s Fiscal Outlook, Legislative Analyst’s Office, November 19, 2025.
[11] October 2025 Financial Bulletin, available through California Department of Finance.
[12] September 2025 Statement of General Fund Cash Receipts and Disbursements.
[13] For example, CalSTRS amortizes gains and losses over three-year periods, p. EX-1-21 of October 2025 official statement.
[14] Breckinridge analysis of FY 24 annual financial statements.
[15] Proposition 2.
[16] Percentages reflect the Bloomberg Barclays Managed Money Short-Intermediate 1-10 Index on November 6, 2025.
BCAI-11172025-jaff2iwg (11/20/2025)
DISCLAIMERS:
The content is intended for investment professionals and institutional investors.
This material provides general information and should not be construed as a solicitation or offer of services or products or as legal, tax or investment advice. Nothing contained herein should be considered a guide to security selection, asset allocation or portfolio construction.
All information and opinions are current as of the dates indicated and are subject to change. Breckinridge believes the data provided by unaffiliated third parties to be reliable but investors should conduct their own independent verification prior to use. Some economic and market conditions contained herein have been obtained from published sources and/or prepared by third parties, and in certain cases have not been updated through the date hereof.
There is no assurance that any estimate, target, projection or forward-looking statement (collectively, “estimates”) included in this material will be accurate or prove to be profitable; actual results may differ substantially. Breckinridge estimates are based on Breckinridge’s research, analysis and assumptions. Other events that were not considered in formulating such projections could occur and may significantly affect the outcome, returns or performance.
Not all securities or issuers mentioned represent holdings in client portfolios. Some securities have been provided for illustrative purposes only and should not be construed as investment recommendations. Any illustrative engagement or sustainability analysis examples are intended to demonstrate Breckinridge’s research and investment process.
Yields and other characteristics are metrics that can help investors in valuing a security, portfolio or composite. Yields do not represent performance results but they are one of several components that contribute to the return of a security, portfolio or composite. Yields and other characteristics are presented gross of advisory fees.
All investments involve risk, including loss of principal. No investment or risk management strategy, including diversification, can guarantee positive results or risk elimination in any market. Periods of elevated market volatility can significantly impact the value of securities. Investors should consult with their advisors to understand how these risks may affect their portfolios and to develop a strategy that aligns with their financial goals and risk tolerances.
Active investing generally involves more risks than laddered strategies because active managers may take on greater market risk to outperform their index. There is no guarantee that either passive or active investing will achieve their objectives. Active strategies also tend to have higher management fees and operating costs than passive strategies. Investors should consider all the differences and risks before making any investment decisions. Active management does not guarantee a profit or protect against a loss.
Past performance is not indicative of future results. Breckinridge makes no assurances, warranties or representations that any strategies described herein will meet their investment objectives or incur any profits. Performance results for Breckinridge’s investment strategies include the reinvestment of interest and any other earnings, but do not reflect any brokerage or trading costs a client would have paid. Results may not reflect the impact that any material market or economic factors would have had on the accounts during the time period. Due to differences in client restrictions, objectives, cash flows, and other such factors, individual client account performance may differ substantially from the performance presented.
Actual client advisory fees may differ from the advisory fee used to calculate net performance results. Client returns will be reduced by the advisory fees and any other expenses incurred in the management of their accounts. For example, an advisory fee of 1 percent compounded over a 10-year period would reduce a 10 percent return to a 9 percent annual return. Additional information on fees can be found in Breckinridge’s Form ADV Part 2A.
Index results are shown for illustrative purposes and do not represent the performance of any specific investment. Indices are unmanaged and investors cannot directly invest in them. They do not reflect any management, custody, transaction or other expenses, and generally assume reinvestment of dividends, income and capital gains. Performance of indices may be more or less volatile than any investment strategy.
Fixed income investments have varying degrees of credit risk, interest rate risk, default risk, and prepayment and extension risk. In general, bond prices rise when interest rates fall and vice versa.
Equity investments are volatile and can decline significantly in response to investor reception of the issuer, market, economic, industry, political, regulatory or other conditions.
There is no guarantee that integrating sustainability factors, including those associated with climate risks, will improve risk-adjusted returns, lower portfolio volatility over any specific time period, or outperform the broader market or other strategies that do not utilize sustainability factors when selecting investments. The consideration of sustainability factors may limit investment opportunities available to a portfolio. In addition, sustainability data often lacks standardization, consistency and transparency and for certain companies such data may not be available, complete or accurate.
When considering sustainability factors, Breckinridge's investment team will include those factors that they believe are material. However, the investment team may conclude that other attributes outweigh these considerations when making investment decisions. Breckinridge can change its sustainability analysis methodology at any time.
Breckinridge’s sustainability analysis is based on third party data and Breckinridge analysts’ internal analysis. Analysts will review a variety of sources such as corporate sustainability reports, data subscriptions, and research reports to obtain available metrics for internally developed frameworks. Qualitative information is obtained from company reports, engagement discussion with corporate management teams, among others.
Breckinridge believes the data provided by unaffiliated third parties, including rating agencies, to be reliable but investors should conduct their own independent verification prior to use. Some economic and market conditions contained herein have been obtained from published sources and/or prepared by third parties, and in certain cases have not been updated through the date hereof. All information contained herein is subject to revision. Any third-party websites included in the content has been provided for reference only, and does not necessarily indicate an endorsement.
BLOOMBERG® is a trademark and service mark of Bloomberg Finance L.P. and its affiliates (collectively “Bloomberg”). Bloomberg does not approve or endorse this material or guarantees the accuracy or completeness of any information herein, or makes any warranty, express or implied, as to the results to be obtained therefrom and, to the maximum extent allowed by law, neither shall have any liability or responsibility for injury or damages arising in connection therewith.
The S&P500 Index (“Index”) and associated data is a product of S&P Dow Jones Indices LLC, its affiliates and/or their licensors and has been licensed for use by Breckinridge. © 2025 S&P Dow Jones Indices LLC, its affiliates and/or their licensors. All rights reserved. Redistribution or reproduction in whole or in part are prohibited without written permission of S&P Dow Jones Indices LLC. For more information on any of S&P Dow Jones Indices LLC’s indices please visit www.spdji.com. S&P® is a registered trademark of Standard & Poor’s Financial Services LLC (“SPFS”) and Dow Jones® is a registered trademark of Dow Jones Trademark Holdings LLC (“Dow Jones”). Neither S&P Dow Jones Indices LLC, SPFS, Dow Jones, their affiliates nor their licensors (“S&P DJI”) make any representation or warranty, express or implied, as to the ability of any index to accurately represent the asset class or market sector that it purports to represent and S&P DJI shall have no liability for any errors, omissions, or interruptions of any index or the data included therein.