Investing
Commentary published on May 9, 2023
April 2023 Market Commentary
Summary
- U.S. Treasury Curve: Treasury yields from two years and longer were close to unchanged, according to Bloomberg data (See Figure 1). As Treasury bill yields rose, news reports increased about concerns over debt ceiling negotiations.
- Municipal Market Technicals: Monthly performance continued its seesaw pattern in 2023 by declining in April, with the weakest returns from 5 years and shorter. New issue supply continues to disappoint, with April down 6.2 percent from March.
- Corporate Market Technicals: Investment grade (IG) corporate bond issuance was $105 billion. IG bond fund inflows were about $7 billion.
- Securitized Trends: Asset-Backed Securities (ABS) delivered positive excess returns, while Mortgage-Backed Securities (MBS) underperformed like-duration Treasuries, based on Bloomberg data.
(The following commentary is a summary of discussions among members of the Breckinridge Capital Advisors Investment Committee as they reviewed monthly activity in the markets and investment returns. The members of the Investment Committee under the leadership of Chief Investment Officer Ognjen Sosa, CAIA, FRM, are Co-Head of Portfolio Management, Matthew Buscone; Senior Portfolio Manager Sara Chanda; Co-Head of Research, Nicholas Elfner; Co-Head of Portfolio Management, Jeffrey Glenn, CFA; Head of Trading, Benjamin Pease; and Co-Head of Research, Adam Stern, JD.)
Market Review
Markets continued to debate when the Federal Reserve (Fed) will shift from raising rates to pausing after the May meeting. The Fed’s job is a difficult one, given still elevated inflation, strong labor markets and an intensifying debt ceiling debate. The outlook is cloudier now, given the strain on the banking system and uncertainty over the impact of more restrictive lending conditions on the economy.
Inflation remained above the Fed’s 2 percent goal. March Personal Consumption Expenditures (PCE) were up 4.9 percent year-over-year (Y/Y). Gross domestic product was 1.1 percent for the first quarter, per the Bureau of Economic Analysis, down from 2.6 in the fourth quarter. Consumer spending showed a 3.7 percent increase, seemingly at odds with slowing economic growth.
The labor market remained tight. Jobless claims were lower at month end, while job openings have begun to decline.
U.S. House Republicans passed a bill offering to raise the debt-ceiling in exchange for spending cuts, a trade-off that Democrats opposed. After the month closed, the Federal Deposit Insurance Corporation placed First Republic Bank in receivership, the third large bank to close in 2023.
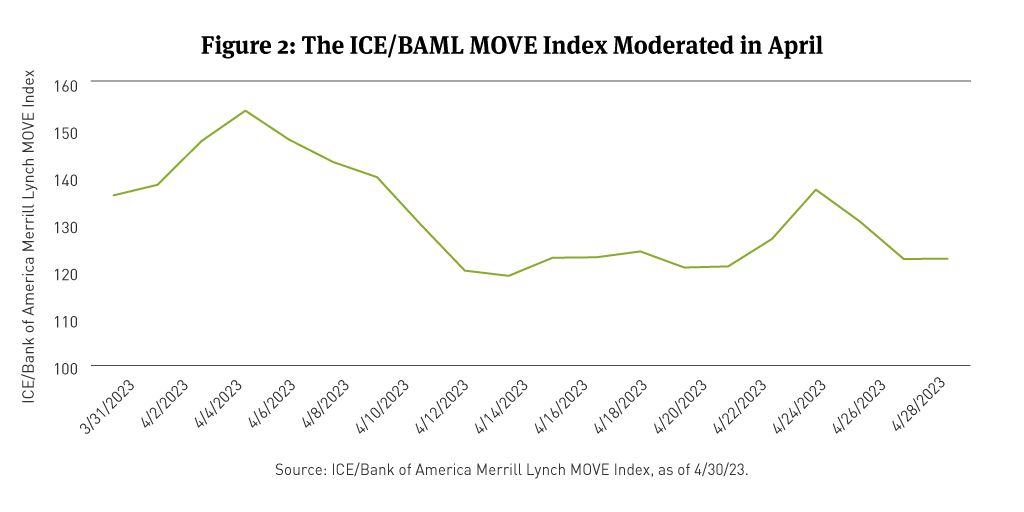
Treasury bond yield changes were muted beyond one year (See Figure 1). The 2-year fell 2 basis points (bps), closing at 4 percent, with a monthly low/high range of 3.78 percent to 4.25 percent, according to Bloomberg data. The 5-year was 9bps lower and the 10-year dropped 4bps. The curve’s inversion from 2 to 10 years steepened. Bond volatility decreased, as measured by the ICE/Bank of America Merrill Lynch MOVE Index1 (See Figure 2).

The Bloomberg U.S. Treasury Bond Index2 gained nearly 0.5 percent in April. The Bloomberg U.S. Aggregate Bond Index3 was 0.6 percent higher.
Municipal Market Review
Municipal bond yields broadly were higher (See Figure 3). Two-year yields were higher by 31bps, five-years by 16bps, 10-years by 8bps, and 30-years by 9bps, per Municipal Markets Analytics (MMA) data. The curve inversion from two to 10 years (2s/10s curve) increased to 34bps.

Muni/Treasury (M/T) ratios improved across the curve, closing at year-to-date highs: 66, 67, 68, and 92 for 2, 5, 10, and 30 years, respectively (See Figure 4), according to MMA data.

The Bloomberg Managed Money Short/Intermediate (1-10) Index4 fell 0.6 percent and the Bloomberg 1-10 Year Municipal Bond Blended Index5 fell 0.3 percent. Bonds in the 3- to 7-year segment of the curve underperformed shorter and longer maturities. Lower-rated bonds outperformed higher-quality bonds.
The Bond Buyer reported that total issuance for April was $30.6 billion, down 24 percent from $40.4 billion a year earlier. Total issuance year-to-date was $107.6 billion, falling 25.2 percent from the same period of 2022. Tax-exempt municipal bond issuance was about 7.5 percent lower Y/Y, while taxable municipal bond issuance was just $2 billion, down approximately 69 percent Y/Y. Lipper/Refinitiv reported municipal bond mutual fund outflows of about $4 billion in April.
Corporate Market Review
Investment grade (IG) corporate bond spreads were 2bps wider, per Bloomberg data, to close at an option-adjusted spread of 136bps. The Bloomberg U.S. Corporate Investment Grade (IG) Index6 gained almost 0.8 percent on a total return basis, with a positive excess return of 18bps compared with duration-matched Treasuries.
Per Bloomberg, the corporate bond sectors delivering the highest relative returns were Oil Field Services, Independent Oil producers, Real Estate Investment Trusts, Banking, Supermarkets, and Midstream Oil service providers. The sectors with the lowest relative returns were Wirelines, Media Entertainment, Aerospace and Defense, Cable Satellite, and Pharmaceuticals.
Based on Bloomberg data, corporate bonds in the 5- to 10-year segment of the curve offered the highest relative total returns, while bonds in the 1- to 5-year segment of the curve had the highest relative excess returns. The highest-rated bonds outperformed other ratings categories on the IG spectrum, with bonds rated AAA and AA faring best.
IG corporate supply was $105.9 billion, per Bloomberg data, with a net total issuance of $32 billion after redemptions. About $7 billion in assets flowed into IG bond mutual funds in April, per Emerging Portfolio Fund Research.
Securitized Market Review
Securitized markets delivered positive total returns and mixed excess returns.
The Bloomberg MBS Index7 had a positive total return of 0.52 percent and a negative excess return of 0.1 percent. The most favorable total and excess returns were among 2 percent coupon conventional8 and Ginnie Mae9 securities.
Bloomberg data showed Agency Commercial MBS (CMBS) earned a positive total return of 0.66 percent and a negative excess return of 1bp. Non-Agency CMBS had a positive total return of 1.04 percent and excess return of 0.49 percent.
Within the ABS sector, securities backed by credit cards and auto loans earned positive total and excess returns. Total returns were 0.51 and 0.40 percent, respectively, while excess returns were 19bps and 11bps, respectively, per Bloomberg.
Equity Market Review
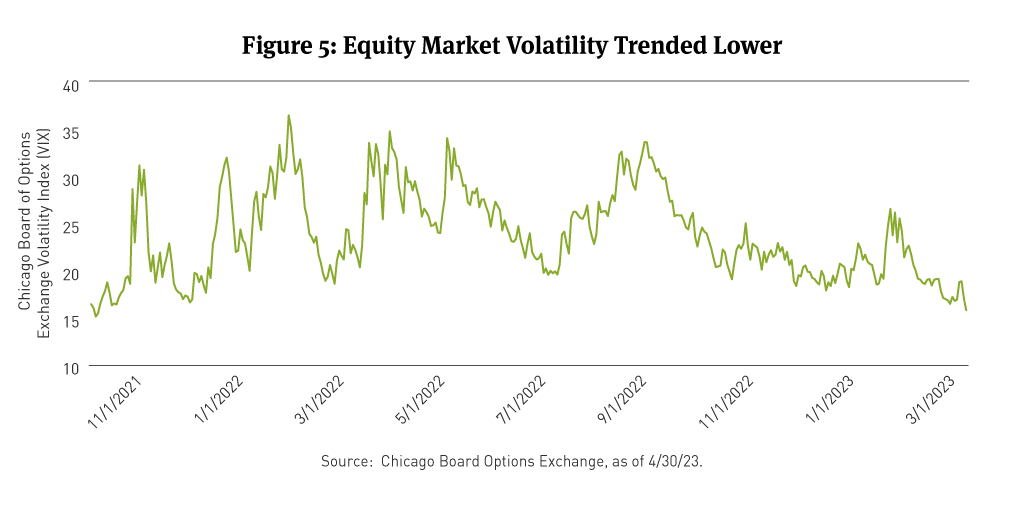
Stock market indices were positive and the Chicago Board Options Exchange Volatility Index10 (VIX) finished at its lowest level since November 2021 (See Figure 5). The Dow Jones Industrial Average11 and the S&P 500 Index12 were up 2.5 percent and 1.5 percent, respectively, while the NASDAQ Composite Index closed just under 0.1 percent higher.13
FactSet reported that at the mid-point of the Q1 2023 earnings season, S&P 500 companies are recording their best performance relative to analyst expectations since Q4 2021. Both the number of companies reporting positive earnings per share (EPS) surprises and the magnitude of EPS surprises are above 10-year averages.
[1] The MOVE Index measures U.S. interest rate volatility by tracking the movement in U.S. Treasury yield volatility implied by current prices of one-month over-the-counter options on 2-year, 5-year, 10-year and 30-year Treasuries. Historically, the index rises as concerns grow that interest rates are moving higher. You cannot invest directly in an index.
[2] The Bloomberg U.S. Treasury Bond Index is an unmanaged index of prices of U.S. Treasury bonds with maturities of 1 to 30 years. You cannot invest directly in an index.
[3] The Bloomberg U.S. Aggregate Bond Index is a broad-based benchmark that measures the investment-grade, U.S.-dollar-denominated, fixed-rate taxable bond market, including Treasuries, government-related and corporate securities, mortgage-backed securities (agency fixed-rate and hybrid adjustable-rate mortgage pass-throughs), asset-backed securities, and commercial mortgage-backed securities. You cannot invest directly in an index.
[4] The Bloomberg Municipal Managed Money Short/Intermediate Index measures the performance of the publicly traded municipal bonds that cover the USD-denominated short/intermediate term tax-exempt bond market, including state and local general obligation bonds, revenue bonds, insured bonds, and pre-refunded bonds. It is rules-based, and market-value weighted. You cannot invest directly in an index.
[5] The Bloomberg Municipal 1-10 Year Blend 1-12 Year Index measures the performance of short and intermediate components of the Municipal Bond Index — an unmanaged, market value-weighted index which covers the U.S. investment grade, tax-exempt bond market. You cannot invest directly in an index.
[6] The Bloomberg U.S. Corporate Bond Index is an unmanaged market-value-weighted index of investment-grade corporate fixed-rate debt issues with maturities of one year or more. You cannot invest directly in an index.
[7] The Bloomberg MBS Index tracks agency mortgage-backed pass-through securities (both fixed-rate and hybrid ARM) guaranteed by Ginnie Mae (GNMA), Fannie Mae (FNMA), and Freddie Mac (FHLMC). The index is constructed by grouping individual pools into aggregates or generics based on program, coupon, and vintage. You cannot invest directly in an index.
[8] Conventional MBS are issued by the Federal National Mortgage Association and the Federal Home Loan Mortgage Corporation.
[9] Ginnie Mae MBS are issued by the Government National Mortgage Association.
[10] The Chicago Board Options Exchange (OEX) Volatility (VIX) Index is the ticker symbol and name for the Chicago Board Options Exchange's (CBOE) Volatility Index, a measure of the stock market's expectation of volatility based on S&P 500 index options. You cannot invest directly in an index.
[11] The Dow Jones Industrial Average Index is a price-weighted average of 30 actively traded blue chip stocks as selected by the editors of The Wall Street Journal. You cannot invest directly in an index.
[12] The S&P 500 Index tracks the performance of 500 widely held, large-capitalization U.S. stocks. You cannot invest directly in an index.
[13] The NASDAQ Composite Index is a market capitalization price-only index that tracks the performance of domestic common stocks traded on the regular NASDAQ market as well as National Market System-traded foreign common stocks and America Depository Receipts. You cannot invest directly in an index.
BCAI-05042023-ggmg4gqk (5/9/2023)
DISCLAIMER:
This material provides general and/or educational information and should not be construed as a solicitation or offer of Breckinridge services or products or as legal, tax or investment advice. The content is current as of the time of writing or as designated within the material. All information, including the opinions and views of Breckinridge, is subject to change without notice.
Not all securities or issuers mentioned represent holdings in client portfolios. Some securities have been provided for illustrative purposes only and should not be construed as investment recommendations.
Past performance is not a guarantee of future results. Any index results shown are for illustrative purposes and do not represent the performance of any specific investment. Indices are unmanaged and investors cannot directly invest in them. They do not reflect any management, custody, transaction or other expenses, and generally assume reinvestment of dividends, income and capital gains. Performance of indices may be more or less volatile than any investment strategy.
All investments involve risk, including loss of principal. Diversification cannot assure a profit or protect against loss. No investment or risk management strategy can guarantee positive results or risk elimination in any market. Fixed income investments have varying degrees of credit risk, interest rate risk, default risk, and prepayment and extension risk. In general, bond prices rise when interest rates fall and vice versa. This effect is usually more pronounced for longer-term securities. Income from municipal bonds can be declared taxable because of unfavorable changes in tax laws, adverse interpretations by the IRS or state tax authorities, or noncompliant conduct of a bond issuer.
Equity investments are volatile and can decline significantly in response to investor reception of the issuer, market, economic , industry, political, regulatory or other conditions.
Separate accounts may not be suitable for all investors.
Breckinridge believes the data provided by unaffiliated third parties to be reliable but investors should conduct their own independent verification prior to use. Some economic and market conditions contained herein have been obtained from published sources and/or prepared by third parties, and in certain cases have not been updated through the date hereof. All information contained herein is subject to revision.
Certain third parties require us to include the following language when using their information:
BLOOMBERG® is a trademark and service mark of Bloomberg Finance L.P. and its affiliates (collectively “Bloomberg”). Bloomberg does not approve or endorse this material or guarantees the accuracy or completeness of any information herein, or makes any warranty, express or implied, as to the results to be obtained therefrom and, to the maximum extent allowed by law, neither shall have any liability or responsibility for injury or damages arising in connection therewith.
The S&P500 Index (“Index”) and associated data is a product of S&P Dow Jones Indices LLC, its affiliates and/or their licensors and has been licensed for use by Breckinridge. © 2023 S&P Dow Jones Indices LLC, its affiliates and/or their licensors. All rights reserved. Redistribution or reproduction in whole or in part are prohibited without written permission of S&P Dow Jones Indices LLC. For more information on any of S&P Dow Jones Indices LLC’s indices please visit www.spdji.com. S&P® is a registered trademark of Standard & Poor’s Financial Services LLC (“SPFS”) and Dow Jones® is a registered trademark of Dow Jones Trademark Holdings LLC (“Dow Jones”). Neither S&P Dow Jones Indices LLC, SPFS, Dow Jones, their affiliates nor their licensors (“S&P DJI”) make any representation or warranty, express or implied, as to the ability of any index to accurately represent the asset class or market sector that it purports to represent and S&P DJI shall have no liability for any errors, omissions, or interruptions of any index or the data included therein.