


Global sustainable debt1 issuance remains resilient in 2026 despite policy uncertainty and softer corporate supply. Bloomberg Intelligence expects issuance to exceed $2.3 trillion, potentially a record, supported by Sovereign, Supranational and Government-Agency borrowers as well as U.S. municipal issuers financing housing and infrastructure projects.2 Although growing, the U.S. dollar (USD)-denominated sustainable bond market is concentrated in the securitized sector and USD corporate sustainable bond issuance has declined significantly since a peak in 2021. At the same time, the opportunity set is evolving, as data centers and structured credit create new sources of green labeled debt.
In our research of sustainable bonds, we believe it is important to look beyond the label to the credit quality of the issuer, use of proceeds, and the potential environmental and social benefits of the transaction.
Sustainable Issuance Remains Strong
Bloomberg Intelligence forecasts green and social bonds to be the largest contributors to sustainable debt issuance this year. Growth is less uniform in 2026 than during the last decade. Corporate sustainable issuance through May declined 28 percent globally and 44 percent in the Americas.3 Meanwhile, government-related borrowers are increasing issuance and shifting the composition of supply toward Sovereigns, Agencies and Supranationals. The supply of sustainability-linked bonds as well as transition bonds has been limited (See Figure 1).

U.S. Dollar Market is Growing but Corporate Issuance is Down
The U.S. dollar sustainable debt market is also growing, largely driven by increased issuance of Government National Mortgage Association (Ginnie Mae) sustainable labeled pools. Labeled securitized bonds accounted for 61 percent of total issuance in 2025, with Ginnie Mae accounting for 40 percent (Figure 2). The underlying mortgages are mainly guaranteed through government programs, including FHA and VA, that promote homeownership for first-time buyers, veterans, low-income households and underserved communities.

Like the global market, the supply of corporate sustainable bonds issued in dollars has also decreased substantially. After hitting a record $514 billion in 2021, corporate issuance declined by 51 percent to $252 billion in 2025. Issuance is also down 24 percent for year-to-date 2026 compared to the same period in 2025 (Figure 3).

USD-denominated sustainable bonds from supranationals and municipalities have remained relatively stable over the past five years. Trends in these two sectors are covered in more detail below.
Supranational Issuers Continue to Issue Labeled Debt to Fund Sustainable Development
Supranationals or multilateral development banks (MDB's) remain significant sources of green, social, and sustainability (GSS) bonds. The International Bank for Reconstruction and Development (IBRD), the World Bank’s original lending vehicle established in 1944, ranked among the largest sustainable debt issuers through midyear 2026, with $20.3 billion of year-to-date issuance, according to Bloomberg data presented by Wells Fargo.4 A $6.0 billion World Bank benchmark sustainable development bond in May 2026 illustrates the scale these issuers bring to market.5,6
In 2026, Breckinridge is engaging with supranationals about their sustainable development programs and plans for issuing labeled debt. One issuer that we spoke with mentioned that GSS bonds generally represent 10 to 15 percent of total annual funding needs.
Data Center Issuance is Expanding the Green Bond Market
Digital infrastructure emerged as a significant source of green bonds in 2026. As development and expansion of AI technology continues, data centers could account for two-thirds of U.S. electricity-load growth over the next decade, according to Wells Fargo Corporate and Investment Banking. Labeled bonds offer a wider financing opportunity for AI capital expenditures.
In one example, a major digital infrastructure and data center provider offered more than $4.5 billion of green bonds in April 2026. Issuance was associated with data center development and highlighted design features such as closed-loop liquid cooling systems intended to minimize local utility stress. The campus drew local scrutiny after county records indicated roughly 29 million gallons of unmetered water were utilized during early construction before a smart-meter billing discrepancy was resolved.
Structured credit also expands the sustainable bond opportunity set. Priced in February 2026, a green asset-backed securitization (ABS) valued at more than $830 million7 was the first time a major credit rating agency awarded a top AAA credit quality rating to a hyperscale data center ABS deal. The project’s green eligibility criteria focus on sustainable design, energy and water efficiency, and low-carbon construction.
Breckinridge’s Approach to Data Center-Related Green Debt
Data center (DC) bonds are single or multi-asset project financings that involve constructing a shell that will house compute for the purposes of AI, often tenanted by a hyperscaler. Breckinridge’s credit analysis of a DC will typically involve assessing the construction risk, power availability and cost, amortization, lease renewal risk, termination risk, creditworthiness of the tenant, and technological obsolescence, among other factors.
While Breckinridge recognizes that data center-related debt is expanding the market, its analysis acknowledges that a green label alone does not establish environmental quality. Green data center debt requires transaction-level scrutiny. Data centers may face headline and reputational risks, particularly as they relate to labeled bonds. If green-labeled data center debt aligns with ICMA principles8, then we are more likely to view it as a credible structure. Alignment requires establishing and reporting on eligible projects including renewable energy, energy efficiency, pollution prevention, and sustainable water management.
Breckinridge investment analysis of data center-related green bonds tends to favor green buildings, energy efficiency, renewable energy and water-related investments, supported by the company's broader sustainability practices. We think green data center labels also need to check all or some of the following boxes:
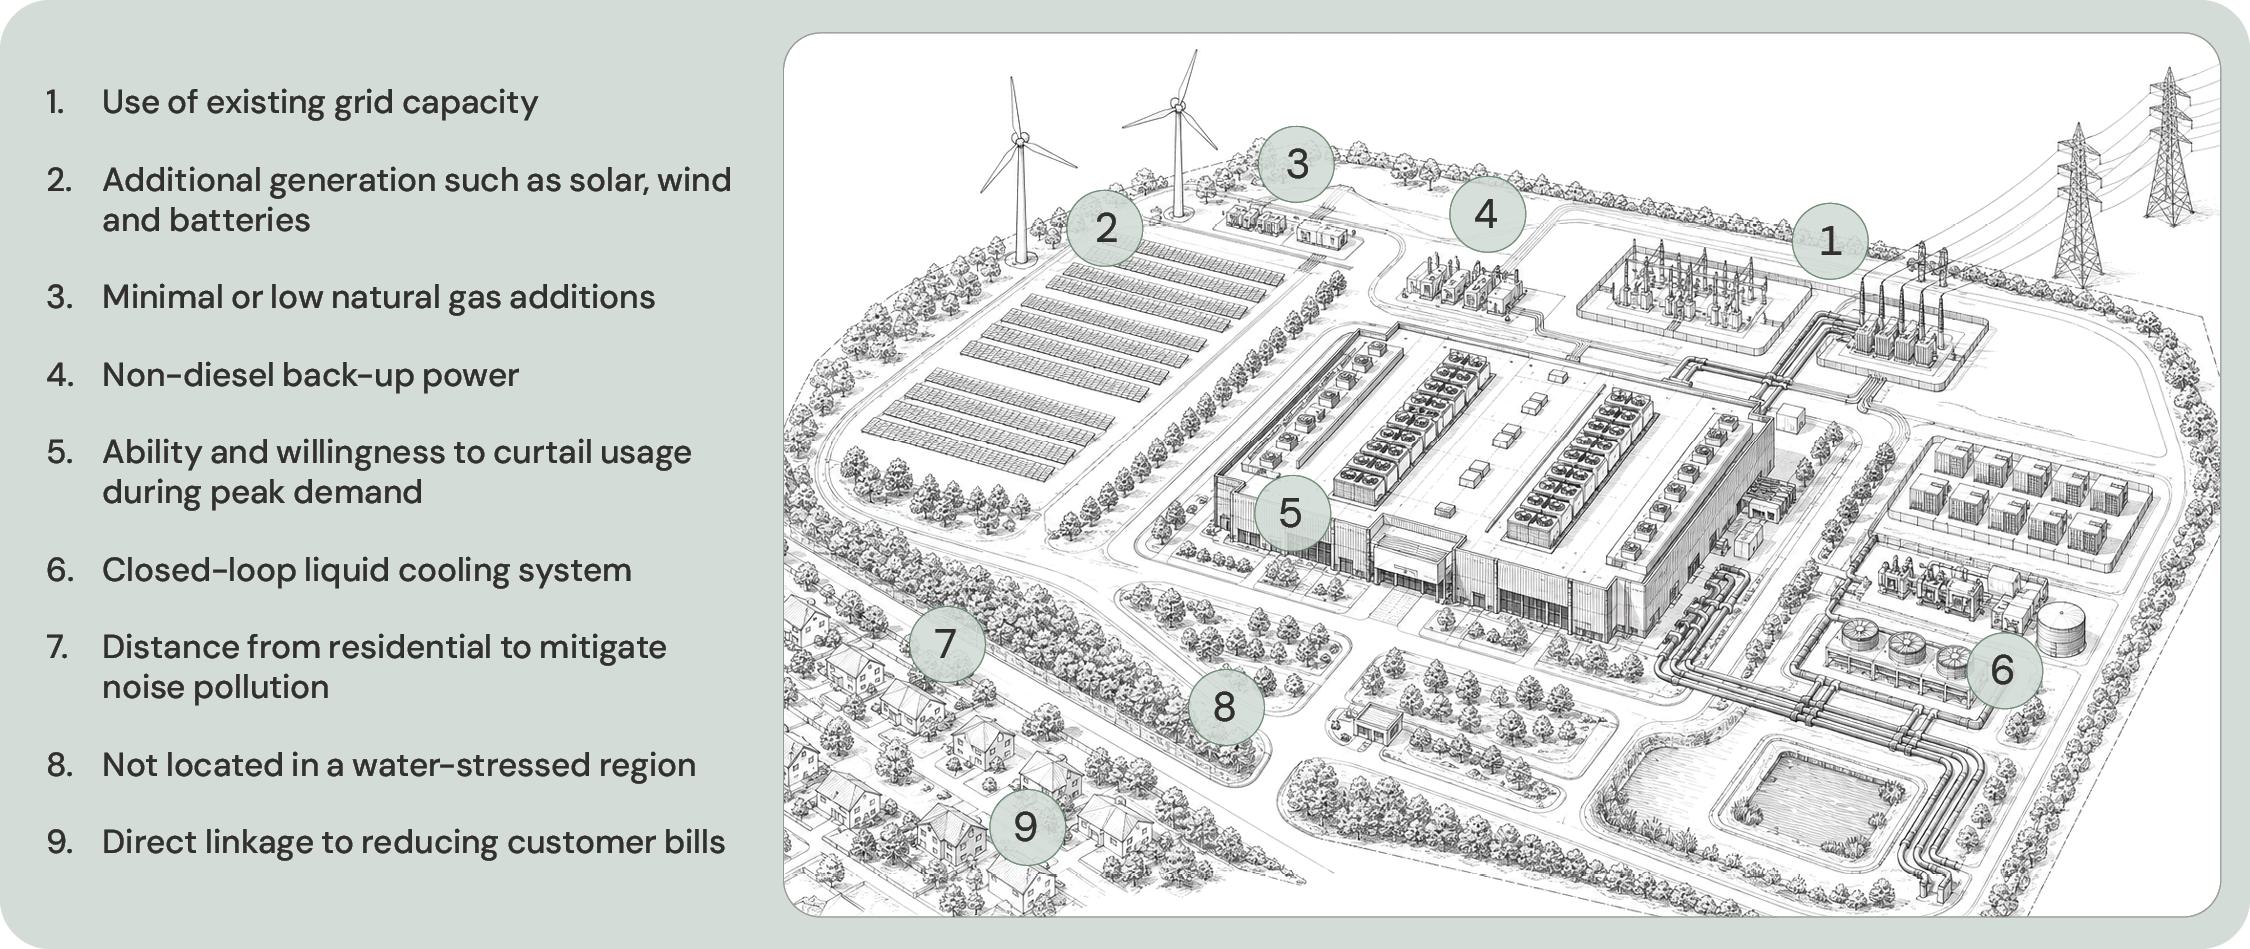
Areas of investment concern can stem from environmental and reputational risks associated with data centers, power usage effectiveness (PUE)9, and impact reporting.
Breckinridge investment analysis of data center bonds, whether green-labelled or not, may consider physical climate risk as an additional lens. Our research typically includes a risk assessment of the geographic area to the extent that higher-level data is available at the city or county level on key climate perils (e.g. wildfire, hurricane, earthquake, flood, heat and drought risks). With single asset project risk, property insurance, force majeure coverage and tenant guarantees can mitigate some risks. We may also consider the primary tenant’s sustainability and climate risk profile through a review of material sustainable risk factors including total energy consumption, physical climate value-at-risk (VaR) and scope 3 emissions reporting.
Municipal Sustainable Debt Remains an Established Market
U.S. municipal bonds represent a relatively mature segment of sustainable fixed income, providing financing across housing, utilities, transportation and other public-purpose infrastructure. U.S. municipal GSS issuance moderated after reaching a record $60 billion in 2024, declining 16 percent to $51 billion in 2025.10 Approximately $24 billion was issued through June 2026.11 Labeled bonds represented 9 percent of overall municipal issuance since 2020.
Municipal sustainable debt also provides exposure to sectors with direct environmental and social uses. Housing accounted for 36 percent of GSS issuance over the last 5 years, followed by Industrial Development/Pollution-Control Revenue bonds and Utilities (See Figures 4 and 5). Issuance is geographically concentrated, with California, New York, and Massachusetts representing 62 percent of the market.12


Sustainable Bond Investment Implications in 2026
The sustainable bond market is changing. While USD corporate issuance is down, supranationals provide scale, municipals offer an established source of public-purpose and infrastructure financing, and data centers and securitized assets are creating newer sources of green supply. In the end, we believe disciplined credit analysis and independent assessment of sustainability characteristics including use of proceeds remain essential. Breckinridge will continue monitoring and analyzing sustainable debt markets, adapting to evolving issuance trends and impact considerations.
[1] The sustainable bond market consists of 1) green, social, sustainability (GSS), and transition issuance, which are also known as labeled or use of proceeds bonds; and 2) sustainability linked bonds, where an issuer’s coupon payment is linked to sustainability targets. An important distinction between the two types of securities is that a labeled bond is issued for environmental or social projects, while a sustainability linked transaction can be used for general purposes. A sustainability bond finances both environmental and social projects. A transition bond would be issued by a high emitting company to help it decarbonize.
[2] Bloomberg Intelligence, Sustainable Finance 2026 Midyear Outlook — Debt, June 30, 2026.
[3] Bloomberg Intelligence, Sustainable Finance 2026 Midyear Outlook — Debt, June 30, 2026.
[4] Wells Fargo Corporate & Investment Banking (CIB, Global Sustainable Finance: 1H 2026 Update, August 2026.
[5] Ibid.
[6] World Bank Sustainable Development Bonds are categorized by Bloomberg as sustainability bonds as their use of proceeds are for both environmental and social purposes.
[7] Ibid.
[8] The International Capital Market Association (ICMA) established The Green Bond Principles (GBP) in January 2014 to enable capital-raising and investment for new and existing projects with environmental benefits. The GBP seek to support issuers in financing environmentally sound and sustainable projects that foster a net-zero emissions economy and protect the environment. GBP-aligned issuance should provide transparent green credentials alongside an investment opportunity. By recommending that issuers report on the use of Green Bond proceeds, the GBP promote a step change in transparency that facilitates the tracking of funds to environmental projects, while simultaneously aiming to improve insight into their estimated impact. The GBP, updated as of June 2025, are voluntary process guidelines that recommend transparency and disclosure and promote integrity in the development of the Green Bond market by clarifying the approach for issuance of a Green Bond. The GBP recommend a clear process and disclosure for issuers, which investors, banks, underwriters, arrangers, placement agents and others may use to understand the characteristics of any given Green Bond. The GBP emphasize the required transparency, accuracy and integrity of the information that will be disclosed and reported by issuers to stakeholders through core components and key recommendations.
[9] For example, a PUE of 1.5 means that for every 1.0 unit of electricity consumed by servers and equipment, 1.5 is used for lighting, HVAC, and other energy needs. The closer a data center’s PUE is to 1.0, the more energy efficient it is. For context, a data center REIT that Breckinridge covers produced a PUE of 1.37 in 2025, a 5.3% improvement from 2024. It has a goal of achieving 1.33 by 2030.
[10] S&P Global Ratings, Moody's Investors Service, Inc., and Securities Industry and Financial Markets Association (SIFMA) data, as of August 15, 2026.
[11] RBC Capital Markets, U.S. Municipal Sustainable Debt Market Update, April 2026, Bloomberg New Energy Finance (NEF) data, as of March 31, 2026. Data excludes Fannie Mae, Freddie Mac and Ginnie Mae.
[12] Ibid.
#489776 (9/4/2026)
DISCLAIMERS:
The content is intended for investment professionals and institutional investors.
This material provides general information and should not be construed as a solicitation or offer of services or products or as legal, tax or investment advice. Nothing contained herein should be considered a guide to security selection, asset allocation or portfolio construction.
All information and opinions are current as of the dates indicated and are subject to change. Breckinridge believes the data provided by unaffiliated third parties to be reliable but investors should conduct their own independent verification prior to use. Some economic and market conditions contained herein have been obtained from published sources and/or prepared by third parties, and in certain cases have not been updated through the date hereof.
There is no assurance that any estimate, target, projection or forward-looking statement (collectively, “estimates”) included in this material will be accurate or prove to be profitable; actual results may differ substantially. Breckinridge estimates are based on Breckinridge’s research, analysis and assumptions. Other events that were not considered in formulating such projections could occur and may significantly affect the outcome, returns or performance.
Not all securities or issuers mentioned represent holdings in client portfolios. Some securities have been provided for illustrative purposes only and should not be construed as investment recommendations. Any illustrative engagement or sustainability analysis examples are intended to demonstrate Breckinridge’s research and investment process.
Yields and other characteristics are metrics that can help investors in valuing a security, portfolio or composite. Yields do not represent performance results but they are one of several components that contribute to the return of a security, portfolio or composite. Yields and other characteristics are presented gross of advisory fees.
All investments involve risk, including loss of principal. No investment or risk management strategy, including diversification, can guarantee positive results or risk elimination in any market. Periods of elevated market volatility can significantly impact the value of securities. Investors should consult with their advisors to understand how these risks may affect their portfolios and to develop a strategy that aligns with their financial goals and risk tolerances.
Active investing generally involves more risks than laddered strategies because active managers may take on greater market risk to outperform their index. There is no guarantee that either passive or active investing will achieve their objectives. Active strategies also tend to have higher management fees and operating costs than passive strategies. Investors should consider all the differences and risks before making any investment decisions. Active management does not guarantee a profit or protect against a loss.
Past performance is not indicative of future results. Breckinridge makes no assurances, warranties or representations that any strategies described herein will meet their investment objectives or incur any profits. Performance results for Breckinridge’s investment strategies include the reinvestment of interest and any other earnings, but do not reflect any brokerage or trading costs a client would have paid. Results may not reflect the impact that any material market or economic factors would have had on the accounts during the time period. Due to differences in client restrictions, objectives, cash flows, and other such factors, individual client account performance may differ substantially from the performance presented.
Actual client advisory fees may differ from the advisory fee used to calculate net performance results. Client returns will be reduced by the advisory fees and any other expenses incurred in the management of their accounts. For example, an advisory fee of 1 percent compounded over a 10-year period would reduce a 10 percent return to a 9 percent annual return. Additional information on fees can be found in Breckinridge’s Form ADV Part 2A.
Index results are shown for illustrative purposes and do not represent the performance of any specific investment. Indices are unmanaged and investors cannot directly invest in them. They do not reflect any management, custody, transaction or other expenses, and generally assume reinvestment of dividends, income and capital gains. Performance of indices may be more or less volatile than any investment strategy.
Fixed income investments have varying degrees of credit risk, interest rate risk, default risk, and prepayment and extension risk. In general, bond prices rise when interest rates fall and vice versa.
Equity investments are volatile and can decline significantly in response to investor reception of the issuer, market, economic, industry, political, regulatory or other conditions.
There is no guarantee that integrating sustainability factors, including those associated with climate risks, will improve risk-adjusted returns, lower portfolio volatility over any specific time period, or outperform the broader market or other strategies that do not utilize sustainability factors when selecting investments. The consideration of sustainability factors may limit investment opportunities available to a portfolio. In addition, sustainability data often lacks standardization, consistency and transparency and for certain companies such data may not be available, complete or accurate.
When considering sustainability factors, Breckinridge's investment team will include those factors that they believe are material. However, the investment team may conclude that other attributes outweigh these considerations when making investment decisions. Breckinridge can change its sustainability analysis methodology at any time.
Breckinridge’s sustainability analysis is based on third party data and Breckinridge analysts’ internal analysis. Analysts will review a variety of sources such as corporate sustainability reports, data subscriptions, and research reports to obtain available metrics for internally developed frameworks. Qualitative information is obtained from company reports, engagement discussion with corporate management teams, among others.
Breckinridge believes the data provided by unaffiliated third parties, including rating agencies, to be reliable but investors should conduct their own independent verification prior to use. Some economic and market conditions contained herein have been obtained from published sources and/or prepared by third parties, and in certain cases have not been updated through the date hereof. All information contained herein is subject to revision. Any third-party websites included in the content has been provided for reference only, and does not necessarily indicate an endorsement.
BLOOMBERG® is a trademark and service mark of Bloomberg Finance L.P. and its affiliates (collectively “Bloomberg”). Bloomberg does not approve or endorse this material or guarantees the accuracy or completeness of any information herein, or makes any warranty, express or implied, as to the results to be obtained therefrom and, to the maximum extent allowed by law, neither shall have any liability or responsibility for injury or damages arising in connection therewith.
The S&P500 Index (“Index”) and associated data is a product of S&P Dow Jones Indices LLC, its affiliates and/or their licensors and has been licensed for use by Breckinridge. © 2025 S&P Dow Jones Indices LLC, its affiliates and/or their licensors. All rights reserved. Redistribution or reproduction in whole or in part are prohibited without written permission of S&P Dow Jones Indices LLC. For more information on any of S&P Dow Jones Indices LLC’s indices please visit www.spdji.com. S&P® is a registered trademark of Standard & Poor’s Financial Services LLC (“SPFS”) and Dow Jones® is a registered trademark of Dow Jones Trademark Holdings LLC (“Dow Jones”). Neither S&P Dow Jones Indices LLC, SPFS, Dow Jones, their affiliates nor their licensors (“S&P DJI”) make any representation or warranty, express or implied, as to the ability of any index to accurately represent the asset class or market sector that it purports to represent and S&P DJI shall have no liability for any errors, omissions, or interruptions of any index or the data included therein.


Subscribe to Insights
Sign up to receive curated insights directly in your inbox.


