
The following commentary is a summary performance update for the Breckinridge High Quality Dividend (HQD) and Sustainable High Quality Dividend (SHQD) Strategies, which offers timely insights into Breckinridge’s repeatable rules-based process focused on delivering consistent dividend growth and long-term capital appreciation, as equity market cycles turn.
The Breckinridge HQD and SHQD Strategies employ a rules-based security selection process grounded in the firm’s core belief in quality investing. As such, its disciplined investing process seeks out companies with strong balance sheets and the potential for increased dividends over time. Stocks are selected by emphasizing factors that reflect these traits, including high return on equity (ROE), a long track record of growing dividends, dividend yield, low payout ratios and proprietary investment grade (IG) credit ratings, as determined by Breckinridge’s team of specialist corporate credit analysts.
Breckinridge’s HQD Strategy outperformed the Bloomberg U.S. Large Cap Index (B500, the Index) by ~3.4 percent during Q2 2026 and by ~8.3 percent year-to-date (YTD) through 6/30/26, on a net basis (See Figure 1). SHQD outperformed the Index by ~1.6 percent and ~6.1 percent (net) for the same periods, respectively.

Net results include a maximum advisory fee of 25 basis points (“bps”) after October 1, 2025 and 35 bps before that date. Previously, net returns subtracted an annual max fee of 35 bps, pro-rated for partial years, from compounded gross returns. Strategy results include reinvested earnings but exclude brokerage or trading costs. Past performance is not indicative of future results, and there can be no assurance that any investment strategy will achieve its investment objective or avoid losses. All investments involve risk, including the possible loss of principal. GIPS reports are available here.
Attribution
During the quarter, portfolio outperformance came entirely from security selection. Sector allocation underperformed due to a significant underweight to the IT sector, which continued to outperform the market. Despite this underweight, it was the IT names in our strategy that have meaningfully contributed to the Strategy’s outperformance. On the negative side, performance of consumer names like Costco and Pepsi lagged their sector while exposure to defense company Lockheed Martin also underperformed (See Figure 2).
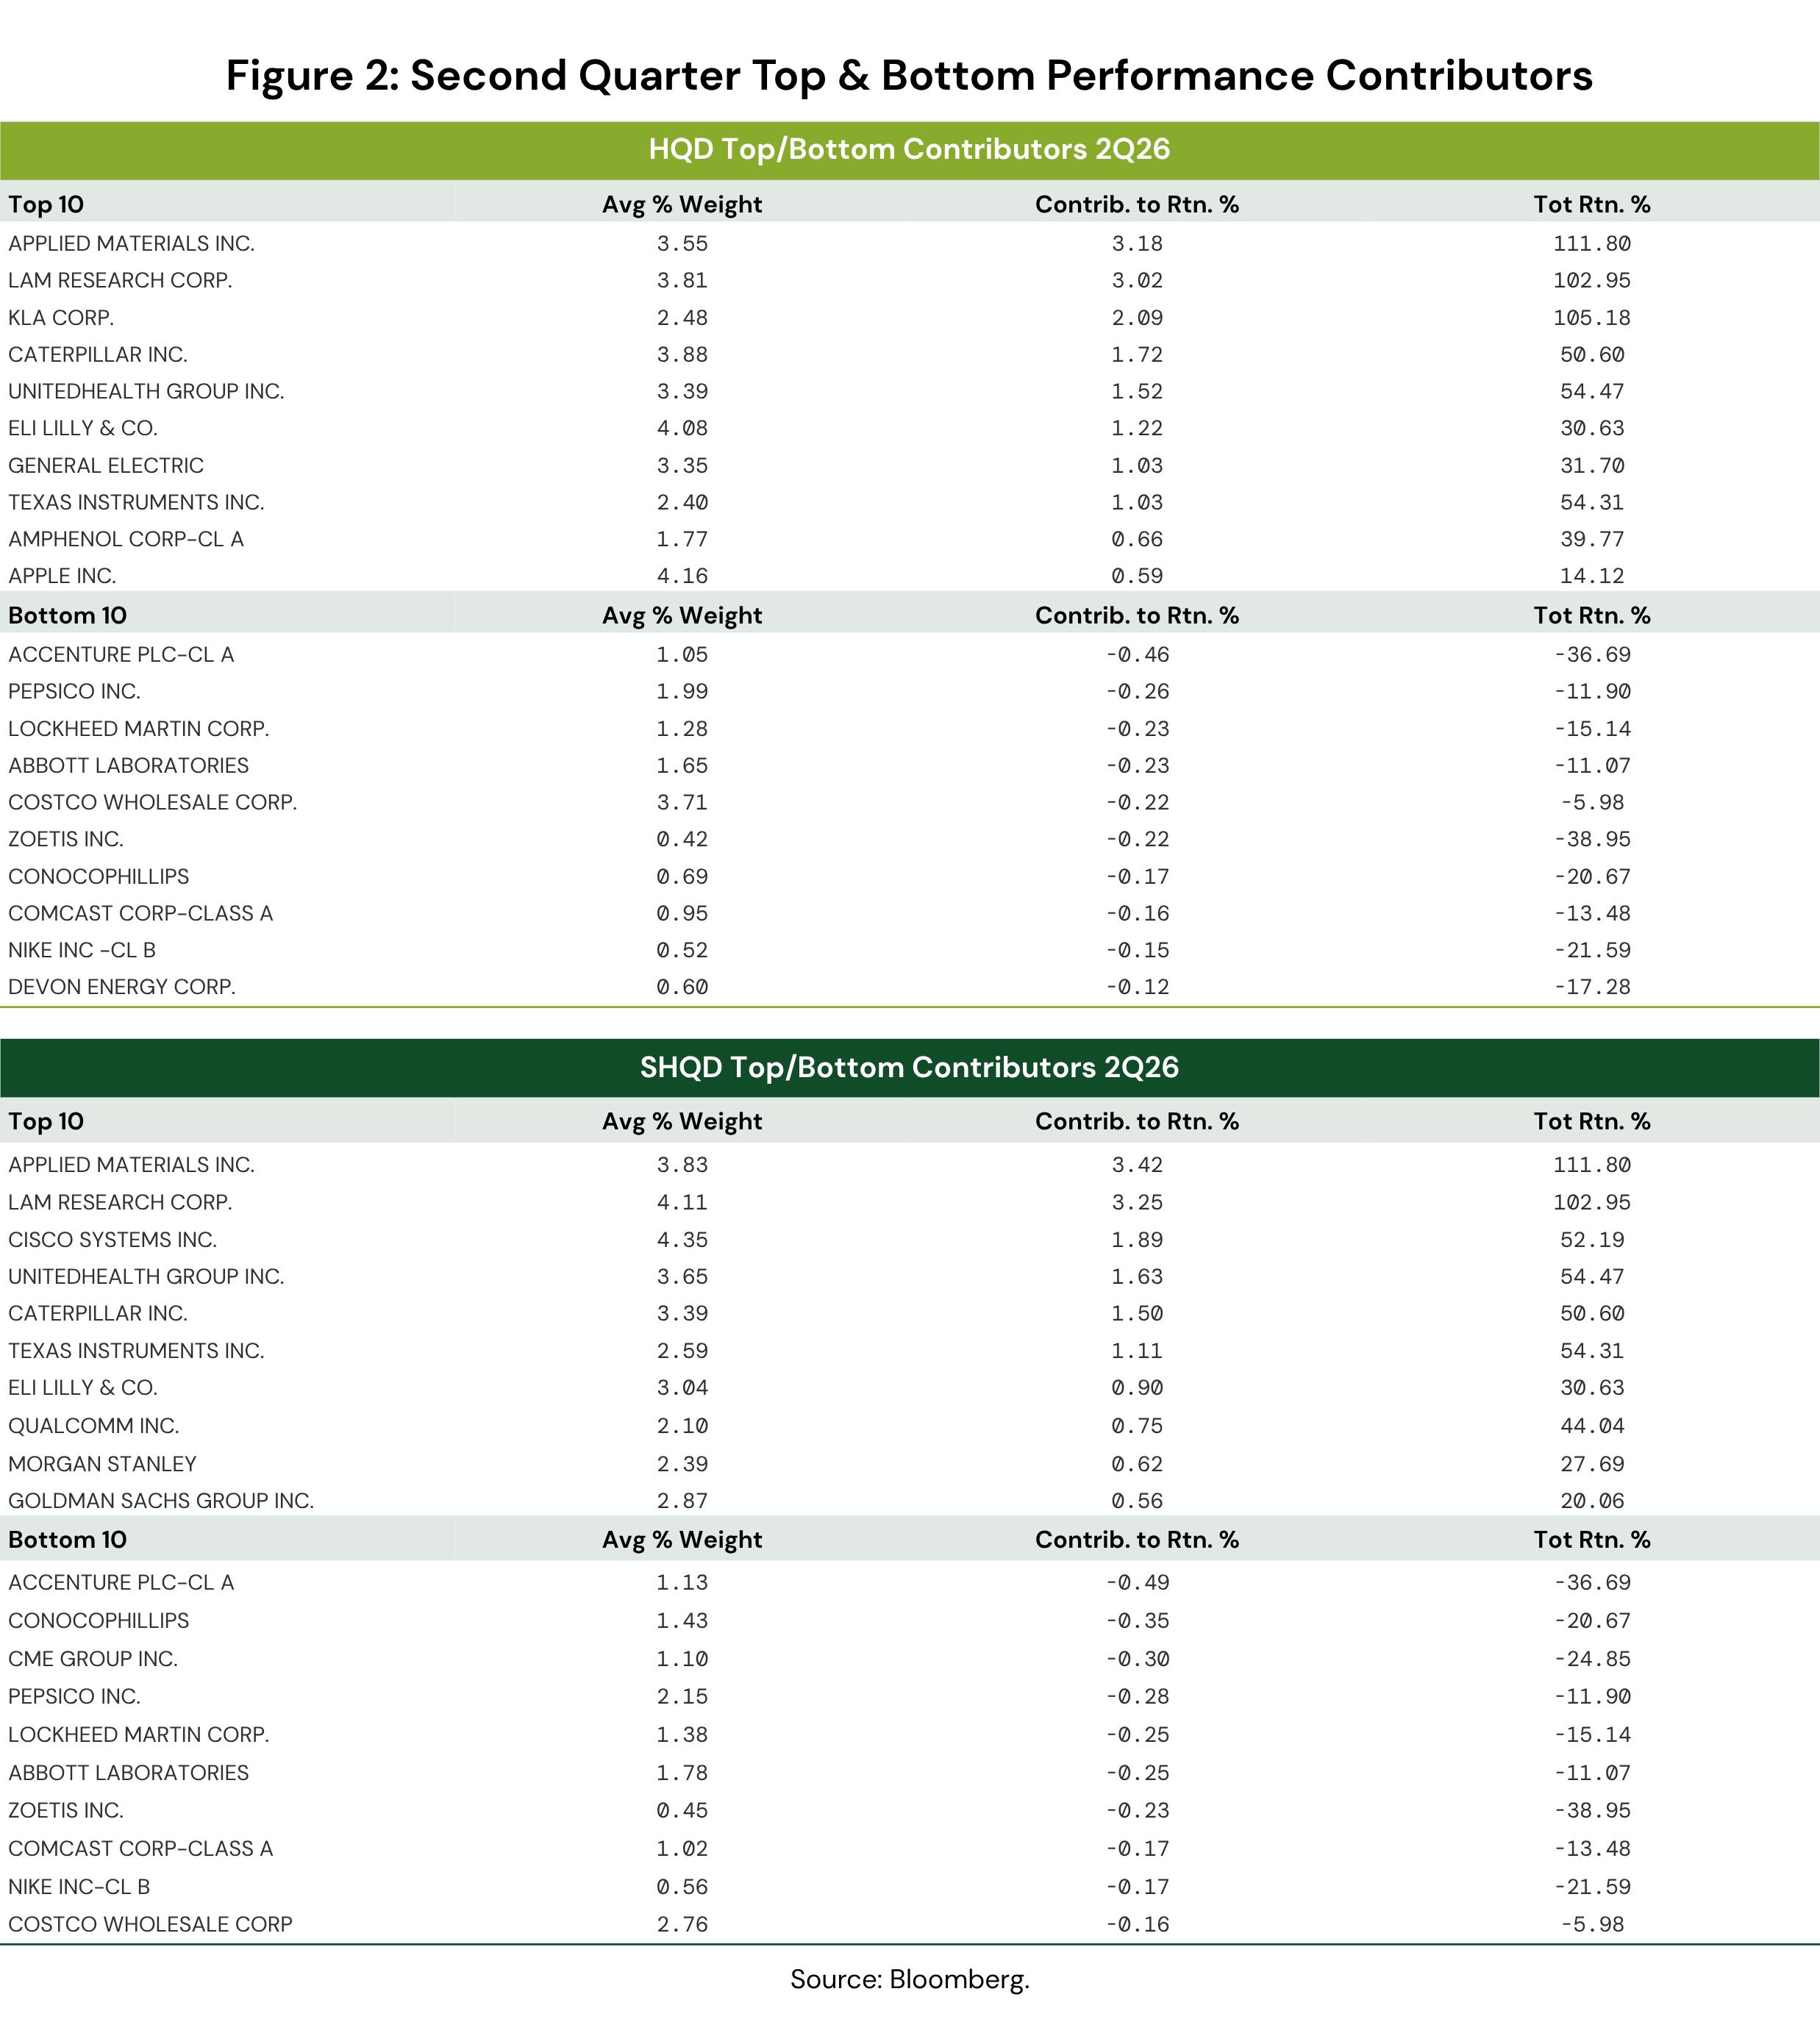
The securities identified above represent the ten largest positive and ten largest negative contributors to portfolio return for the period shown and do not represent all securities purchased, sold or recommended for client accounts. The methodology used to identify securities is applied consistently based on each security's contribution to portfolio return during the period. Contribution to return and security-level total returns shown above are presented gross of investment management fees and other expenses and should not be interpreted as the return experienced by an investor. Please refer to the accompanying gross and net performance of the applicable strategy for information regarding the effect of fees and expenses on investment returns. Past performance does not guarantee future results.
Factor Spotlight
Value and Quality underperformed during the quarter, as Momentum and Growth dominated overall market returns (See Figure 3). While the HQD/SHQD model maintains a High Value and High-Quality bias, stock selection was strong, which supported strong returns during the period. Most of the portfolios’ IT holdings benefited from continued AI growth, resultant earnings beats, and upward estimate revisions that drove continued stock appreciation in the sector.

Factor returns reflect equal weighting of constituents in a long / short framework + the broad market return of the B500 for each period. Constituents are re-balanced monthly. Factor Returns are derived from subtracting the average stock returns of companies included in the 1st quintile from those included in the 5th quintile. Factors are defined as follows; Beta: the sensitivity of excess stock returns vs excess returns of the cap-weighted market portfolio; Momentum: the trailing 12-month returns minus the most recent month; Growth: a composite of trailing and forward growth characteristics including historical 5-year sales growth, historical 5-year earnings growth, consensus estimated growth for 2-year and 3-year forward EPS; Size: log of market capitalization; Quality: a composite of profitability (including Return on Equity, Return on Assets and Profit Margin), leverage and variability (of sales earnings and cash flows); Dividend yield: annual dividends per share divided by price per share; Value: a composite of valuation (book to price, sales to price, cash flow to price) and earnings yield (trailing and forward earnings yield).
Stock Spotlight
In the HQD Strategy’s post 6/30 quarterly rebalance, NVIDIA (NVDA) entered the portfolio at a ~4 percent weight. NVDA, which started paying dividends in 2012, thus meeting the model’s 10-year minimum eligibility screening criteria, had previously fallen short of the model’s de minimis dividend yield standard. It moved to the top of the model’s rules-based ranking during Q2, as the company hiked the dividend significantly to $0.25/share from just $0.01/share previously.
NVDA’s entry into the HQD strategy results in it now owning three of the MAG 7 stocks, as it joins Apple (AAPL) and Microsoft (MSFT). The SHQD strategy holds only MSFT at this point. Additional companies that entered the HQD strategy include Hartford Insurance, where the internal credit rating was upgraded during the quarter resulting in an increase in ranking from 38 to 15; Intuit – where the dividend yield increased materially, helping it to improve in rank from 44 to 19; and Wells Fargo – which maintained its strong ranking and entered the strategy. Four companies also were divested from the strategy, including Texas Instruments and UnitedHealth – due to price appreciation that reduced the dividend yield; Merck – due to lower earnings that resulted in a higher payout ratio and lower ROE; and Cintas – on weak dividend growth. There were no changes in holdings in the SHQD strategy over the quarter. These are examples of the strategy’s rules-based framework in motion (See Figure 4).

The securities shown represent all positions added to and all positions exited from the Strategy during the period indicated. The presentation is intended to illustrate changes to the Strategy during the period and should not be considered a recommendation to buy or sell any security. Securities identified do not represent all securities purchased, sold or held by the Strategy during the period, and no assumption should be made that investments in the securities identified were or will be profitable. The securities shown were selected solely based on their status as new or exited positions during the period and were not selected based on investment performance. Holdings and portfolio characteristics are subject to change without notice. Past performance does not guarantee future results.
Looking Ahead
While not overly worrisome at current valuation levels, increased volatility due to uncertainty about future returns on the massive AI spend cycle could drive investor sentiment away from IT. Interestingly, upward inflation and rates have not had the same immediate impact on valuations as prior inflation scares (as compared to Q4 2022, for example), which likely means the market currently is discounting this as temporary. There is clearly a battle in the minds of many investors pitting AI efficiency against structural inflation drivers from deglobalization, labor power, and energy volatility.
The HQD and SHQD process discipline helps Breckinridge to look beyond the short-term view that the IT sector's relative performance will drive portfolio performance. As seen this quarter, the Strategy outperformed thanks to solid security selection, even with a healthy underweight to IT during a period in which the sector outperformed. IT positions in the portfolio significantly outperformed the sector and the market.
BCAI- 08112026-1mflbvtm (8/11/2026)
DISCLAIMERS:
This material provides general information and should not be construed as a solicitation or offer of services or products or as legal, tax or investment advice. Nothing contained herein should be considered a guide to security selection, asset allocation or portfolio construction.
All information and opinions are current as of the dates indicated and are subject to change. Breckinridge believes the data provided by unaffiliated third parties to be reliable but investors should conduct their own independent verification prior to use. Some economic and market conditions contained herein have been obtained from published sources and/or prepared by third parties, and in certain cases have not been updated through the date hereof.
There is no assurance that any estimate, target, projection or forward-looking statement (collectively, “estimates”) included in this material will be accurate or prove to be profitable; actual results may differ substantially. Breckinridge estimates are based on Breckinridge’s research, analysis and assumptions. Other events that were not considered in formulating such projections could occur and may significantly affect the outcome, returns or performance.
Index results are shown for illustrative purposes and do not represent the performance of any specific investment. Indices are unmanaged and investors cannot directly invest in them. They do not reflect any management, custody, transaction or other expenses, and generally assume reinvestment of dividends, income and capital gains. Performance of indices may be more or less volatile than any investment strategy.
Equity investments are volatile and can decline significantly in response to investor reception of the issuer, market, economic, industry, political, regulatory or other conditions.
Diversification cannot assure a profit or protect against loss. Investments in fixed income securities involve risks.
Dividend payments are not guaranteed. Investors cannot invest directly in an index.
The indices selected to represent the equity markets are generally viewed as reasonable measures of their respective asset class’s performance. Results may differ if other indices were used in the same analysis.
BLOOMBERG® is a trademark and service mark of Bloomberg Finance L.P. and its affiliates (collectively “Bloomberg”). Bloomberg does not approve or endorse this material or guarantees the accuracy or completeness of any information herein, or makes any warranty, express or implied, as to the results to be obtained therefrom and, to the maximum extent allowed by law, neither shall have any liability or responsibility for injury or damages arising in connection therewith.
The S&P 500 Index (“Index”) and associated data is a product of S&P Dow Jones Indices LLC, its affiliates and/or their licensors and has been licensed for use by Breckinridge. © 2026 S&P Dow Jones Indices LLC, its affiliates and/or their licensors. All rights reserved. Redistribution or reproduction in whole or in part are prohibited without written permission of S&P Dow Jones Indices LLC. For more information on any of S&P Dow Jones Indices LLC’s indices, please visit www.spdji.com. S&P® is a registered trademark of Standard & Poor’s Financial Services LLC (“SPFS”) and Dow Jones® is a registered trademark of Dow Jones Trademark Holdings LLC (“Dow Jones”). Neither S&P Dow Jones Indices LLC, SPFS, Dow Jones, their affiliates nor their licensors (“S&P DJI”) make any representation or warranty, express or implied, as to the ability of any index to accurately represent the asset class or market sector that it purports to represent and S&P DJI shall have no liability for any errors, omissions, or interruptions of any index or the data included therein.


Subscribe to Insights
Sign up to receive curated insights directly in your inbox.


