
The following commentary is a summary of discussions among members of the Breckinridge Capital Advisors Investment Committee as they reviewed monthly activity in the markets and investment returns. All data is as of October 30, 2026, sourced from Bloomberg unless otherwise noted. The members of the Investment Committee, under the leadership of Co-Chief Investment Officers Matthew Buscone and Jeffrey Glenn, CFA, are Co-Heads of Research Nicholas Elfner and Adam Stern, J.D., M.P.A., and Portfolio Manager and Director, Corporate Research Josh Perez, CFA.
Market Review
U.S. financial markets saw increased volatility in October, as investors reassessed artificial intelligence (AI)-related investment, geopolitical developments, and the monetary policy outlook. The Nasdaq Composite declined 5.3 percent, while the S&P 500 fell 0.87 percent. Given the rally in Treasury yields, municipal and corporate bonds earned positive returns, per Bloomberg (BBG) indices.
Economic activity remained resilient. U.S. real gross domestic product (GDP) expanded at a 3.4 percent annualized pace in the third quarter, exceeding consensus expectations. Personal consumption and AI-related business investment accounted for nearly all of the reported growth, with government expenditures contributing to a lesser extent. Despite the above-trend pace of economic activity, the Breckinridge Investment Committee (IC) expects growth to moderate toward 2 percent, as higher interest rates weigh on demand and the pace of AI-related investment eventually slows.
Following September’s 25bps increase, the Fed maintained its policy rate in October. Inflation remained above the Fed's target but continued to moderate, leading market participants to price in another 25bps increase by the January meeting. The combination of resilient economic activity and persistent inflation reinforced uncertainty surrounding the future path of monetary policy.
The U.S. Treasury yield curve bull flattened during October, as declining equity markets and a pause in Fed tightening supported demand for government bonds (See Figure 1). The 2-year Treasury yield declined 30bps, the 5-year fell 37bps, the 10-year decreased 36bps and the 30-year declined 32bps. The Bloomberg U.S. Treasury Index returned 2.36 percent for the month.

The ICE Bank of America MOVE Index ended the month at approximately 100, above its trailing 200-day moving average (See Figure 2). Elevated interest rate volatility continued to influence fixed income valuations and investor positioning.

Municipal Market Review
The municipal bond market rebounded in October, reversing much of September's weakness, as yields declined across the curve. The Bloomberg Managed Money Short/Intermediate Index returned 3.79 percent for the month, while the broader Bloomberg tax-exempt index returned 3.85 percent, its strongest October performance since 1985.
Municipal yields declined across maturities, with the 2-year yield falling 88bps, the 5-year declining 76bps, the 10-year decreasing 71bps, and the 30-year falling 32bps (See Figure 3). The larger declines at shorter maturities resulted in a bull steepening of the municipal yield curve.

At month-end, Municipal/Treasury (M/T)1 ratios stood at 58 percent for 2-year bonds, 63 percent for 5-year bonds, 69 percent for 10-year bonds and 90 percent for 30-year bonds (See Figure 4).

New issue supply remained elevated but moderated from recent months. Municipal issuance totaled $55.21 billion in October, compared with $58.96 billion in September and approximately $66 billion in August. Lower issuance and higher demand for munis given attractive nominal and tax-equivalent yields contributed to the rally.
Fund flows were mixed. Investment Company Institute data showed municipal fund outflows totaling $16.79 billion. Open-end mutual fund redemptions and bids-wanted associated with tax-loss harvesting were offset in part by strong ETF inflows, supporting the performance of index-eligible municipal bonds.
Municipal credit fundamentals remained stable despite elevated interest rates and rising infrastructure costs. The IC noted that year-over-year economic growth through the second quarter placed California and New York among the 10 strongest states, suggesting continued economic resilience in these higher-tax jurisdictions.
Looking forward, the IC expects attractive tax-equivalent yields and favorable seasonal technicals to support municipal demand. New issuance could increase following the U.S. midterm elections, as borrowing conditions stabilize. The potential for changes in federal tax policy also remains an important consideration for municipal investors.
Corporate Market Review
The Bloomberg U.S. IG Corporate Index OAS widened in October, with substantial dispersion across sectors. Despite wider spreads, declining Treasury yields supported a positive total return of 2.16 percent, while excess return was negative 59bps.
Spread widening was most pronounced in sectors with exposure to AI-related investment and financing activity. Communications spreads widened 34bps, Technology widened 21bps, and Finance widened 14bps. Energy, Health Care, and Banks experienced comparatively modest widening of 3bps, 5bps, and 7bps, respectively. According to Bloomberg sector performance data, Supranationals, Foreign Agencies, Environmental, and Independent and Oil Field Services were among the strongest performers, while Cable Satellite, Wirelines, Media Entertainment, Technology, and Wireless were among the weakest.
Corporate bond issuance declined amid increased market volatility. Gross IG issuance totaled $135.1 billion in October, compared with $229.1 billion in September and $177.1 billion in August. October issuance was approximately 10 percent lower than a year earlier. Redemptions totaled $115.9 billion, resulting in approximately $19.3 billion of net issuance. Investor demand remained supportive despite widening spreads. Investment Company Institute data indicated corporate fund inflows of $32.7 billion during the reported period.
Corporate fundamentals continued to benefit from resilient earnings and margins, although the scale of AI-related capex and associated debt financing presented emerging risks. The IC noted that AI-related debt outstanding has become the third-largest sector exposure by market value within the U.S. IG corporate market and could approach the Banking sector's market value within the next two years. Elevated investment spending, negative free cash flow among some hyperscalers,2 and uncertainty surrounding AI business models contributed to spread dispersion.
Following October's widening, the IC estimated that IG spreads and yields stood at the 17th and 90th percentiles, respectively, relative to their 20-year histories. While absolute yields remained attractive, valuations and issuer-specific risks warranted continued selectivity.
Securitized Market Review
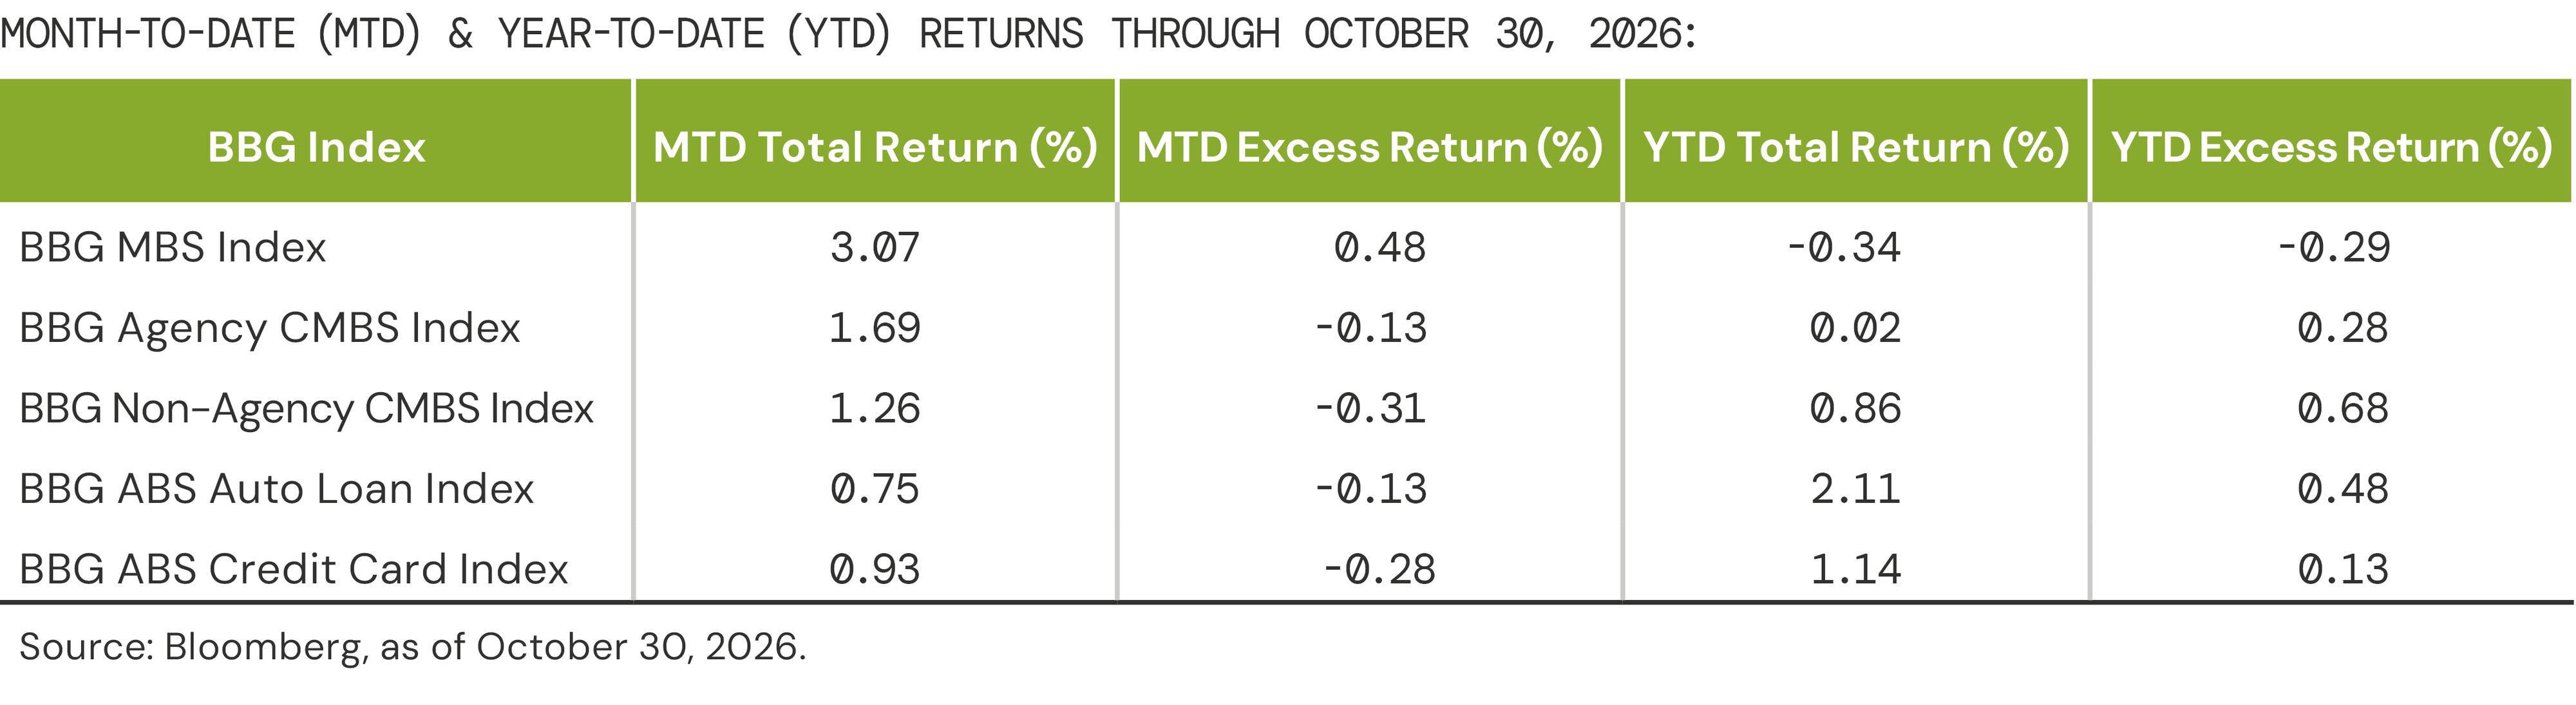
Agency mortgage-backed securities (MBS) performed well in October, benefiting from declining Treasury yields and tighter spreads. The Bloomberg MBS Index generated a 3.07 percent total return and 48bps of excess return. Spreads on intermediate coupons in the 3.5 percent to 5 percent range tightened approximately 15bps, outperforming both lower- and higher-coupon securities.
The IC continues to view mortgage-related securities through the lens of interest rate volatility, spread valuations, and collateral fundamentals. Agency MBS performance remains sensitive to changes in rate volatility, while differentiated credit and structural characteristics across ABS and CMBS sectors support a selective approach.
Equity Market Review
The S&P 500 declined 0.87 percent in October, as losses among several large-cap Technology and Communication Services companies outweighed positive returns across other sectors. More than 70 percent of index constituents generated positive returns, highlighting the influence of index concentration on headline performance.
Communication Services was the weakest-performing sector, declining 15.11 percent, followed by Information Technology, which fell 6.80 percent. Energy led performance with a 14 percent gain, supported by higher oil prices and earnings growth. Consumer Staples rose 11.62 percent, while Utilities and Health Care advanced 10.17 percent and 9.87 percent, respectively.
Equity market volatility rose modestly in October, as investors reassessed Technology sector valuations and AI-related investment expectations. The Chicago Board Options Exchange Volatility Index (VIX) ended the month near 19, compared with its trailing 200-day moving average of 18.25 (See Figure 5).

[1] The Municipal/Treasury (M/T) ratio compares yields of municipal bonds with those of U.S. Treasury bonds of the same maturity. M/T ratios can show the relative value of municipal bonds compared with taxable bonds, by indicating when yields for municipal bonds exceed the after-tax yields on taxable bonds.
[2] Hyperscalers are large cloud service providers that own and operate outsized global data centers that offer on-demand computing, storage, and networking resources.
Request #503199 (11/9/2026)
DISCLAIMERS:
The content is intended for investment professionals and institutional investors.
This material provides general information and should not be construed as a solicitation or offer of services or products or as legal, tax or investment advice. Nothing contained herein should be considered a guide to security selection, asset allocation or portfolio construction.
All information and opinions are current as of the dates indicated and are subject to change. Breckinridge believes the data provided by unaffiliated third parties to be reliable, but investors should conduct their own independent verification prior to use. Some economic and market conditions contained herein have been obtained from published sources and/or prepared by third parties, and in certain cases have not been updated through the date hereof.
There is no assurance that any estimate, target, projection or forward-looking statement (collectively, “estimates”) included in this material will be accurate or prove to be profitable; actual results may differ substantially. Breckinridge estimates are based on Breckinridge's research, analysis and assumptions. Other events that were not considered in formulating such projections could occur and may significantly affect the outcome, returns or performance.
Not all securities or issuers mentioned represent holdings in client portfolios. Some securities have been provided for illustrative purposes only and should not be construed as investment recommendations. Any illustrative engagement or sustainability analysis examples are intended to demonstrate Breckinridge’s research and investment process.
Yields and other characteristics are metrics that can help investors in valuing a security, portfolio or composite. Yields do not represent performance results, but they are one of several components that contribute to the return of a security, portfolio or composite. Yields and other characteristics are presented gross of advisory fees.
All investments involve risk, including loss of principal. No investment or risk management strategy, including diversification, can guarantee positive results or risk elimination in any market.
Past performance is not indicative of future results. Breckinridge makes no assurances, warranties, or representations that any strategies described herein will meet their investment objectives or incur any profits. Performance results for Breckinridge’s investment strategies include the reinvestment of interest and any other earnings, but do not reflect any brokerage or trading costs a client would have paid. Results may not
reflect the impact that any material market or economic factors would have had on the accounts during the time period. Due to differences in client restrictions, objectives, cash flows, and other such factors, individual client account performance may differ substantially from the performance presented.
Actual client advisory fees may differ from the advisory fee used to calculate net performance results. Client returns will be reduced by the advisory fees and any other expenses incurred in the management of their accounts. For example, an advisory fee of 1 percent compounded over a 10-year period would reduce a 10 percent return to a 9 percent annual return. Additional information on fees can be found in Breckinridge’s Form ADV Part 2A.
Index results are shown for illustrative purposes and do not represent the performance of any specific investment. Indices are unmanaged and investors cannot directly invest in them. They do not reflect any management, custody, transaction or other expenses, and generally assume reinvestment of dividends, income and capital gains. Performance of indices may be more or less volatile than any investment strategy.
There is no guarantee that the strategies or approaches discussed will achieve their objectives, lower volatility or be profitable. All investments involve risk, including loss of principal. Diversification cannot assure a profit or protect against loss. No investment or risk management strategy can guarantee positive results or risk elimination in any market.
Fixed income investments have varying degrees of credit risk, interest rate risk, default risk, and prepayment and extension risk. In general, bond prices rise when interest rates fall and vice versa.
Equity investments are volatile and can decline significantly in response to investor reception of the issuer, market, economic, industry, political, regulatory or other conditions.
Breckinridge believes the data provided by unaffiliated third parties, including rating agencies, to be reliable but investors should conduct their own independent verification prior to use. Some economic and market conditions contained herein have been obtained from published sources and/or prepared by third parties, and in certain cases have not been updated through the date hereof. All information contained herein is subject to revision. Any third-party websites included in the content has been provided for reference only, and does not necessarily indicate an endorsement.
BLOOMBERG® is a trademark and service mark of Bloomberg Finance L.P. and its affiliates (collectively “Bloomberg”). Bloomberg does not approve or endorse this material or guarantee the accuracy or completeness of any information herein, or make any warranty, express or implied, as to the results to be obtained therefrom and, to the maximum extent allowed by law, neither shall have any liability or responsibility for injury or damages arising in connection therewith.
The S&P 500 Index (“Index”) and associated data is a product of S&P Dow Jones Indices LLC, its affiliates and/or their licensors and has been licensed for use by Breckinridge. © 2026 S&P Dow Jones Indices LLC, its affiliates and/or their licensors. All rights reserved. Redistribution or reproduction in whole or in part are prohibited without written permission of S&P Dow Jones Indices LLC. For more information on any of S&P Dow Jones Indices LLC's indices, please visit www.spdji.com.
S&P® is a registered trademark of Standard & Poor's Financial Services LLC (“SPFS”) and Dow Jones® is a registered trademark of Dow Jones Trademark Holdings LLC (“Dow Jones”).
Neither S&P Dow Jones Indices LLC, SPFS, Dow Jones, their affiliates nor their licensors (“S&P DJI”) make any representation or warranty, express or implied, as to the ability of any index to accurately represent the asset class or market sector that it purports to represent, and S&P DJI shall have no liability for any errors, omissions or interruptions of any index or the data included therein.


Subscribe to Insights
Sign up to receive curated insights directly in your inbox.


