Investing
Commentary published on October 14, 2025
September 2025 Market Commentary
Summary
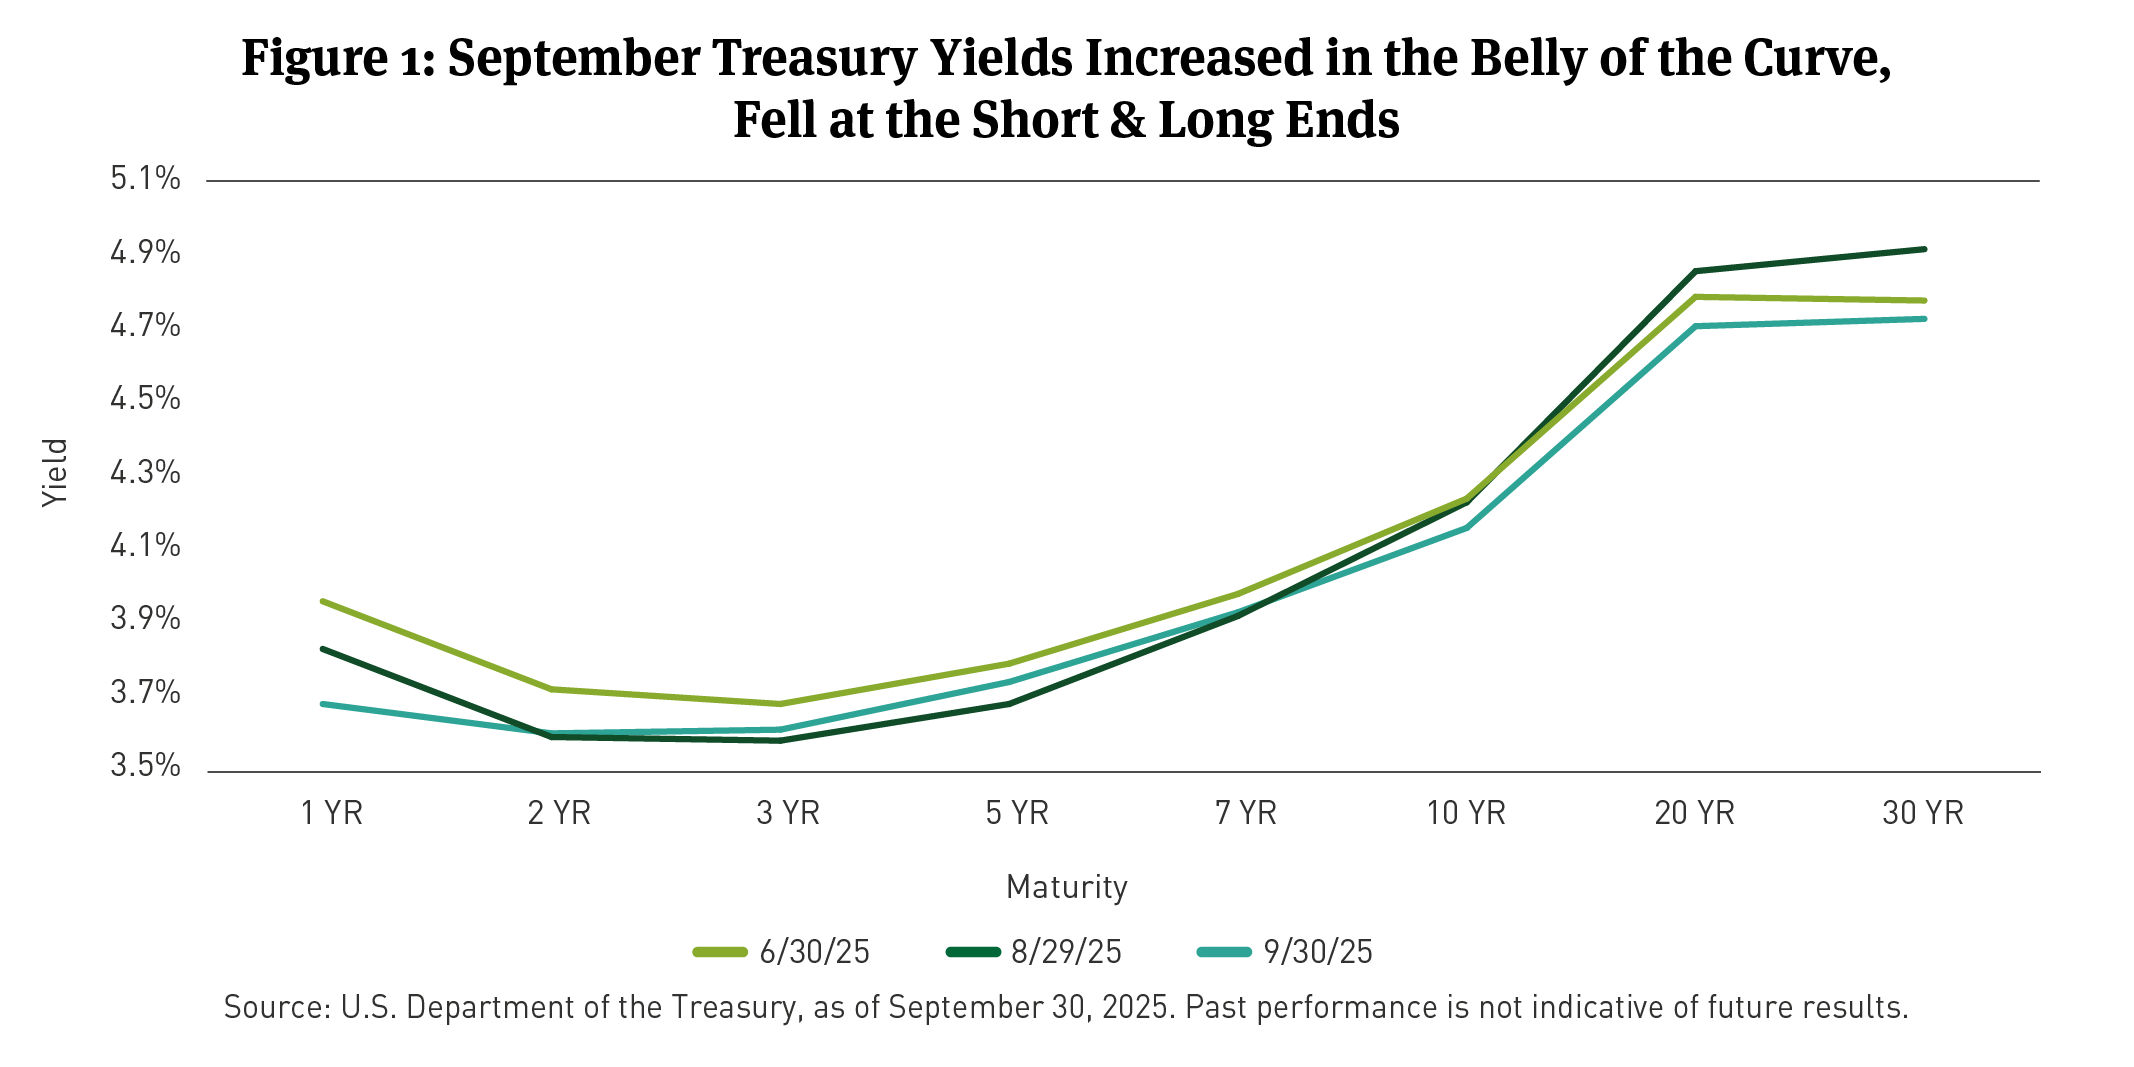
- U.S. Treasury Curve: The Treasury yield curve bull flattened in September, with the 10-year yield falling by eight basis points (bps).
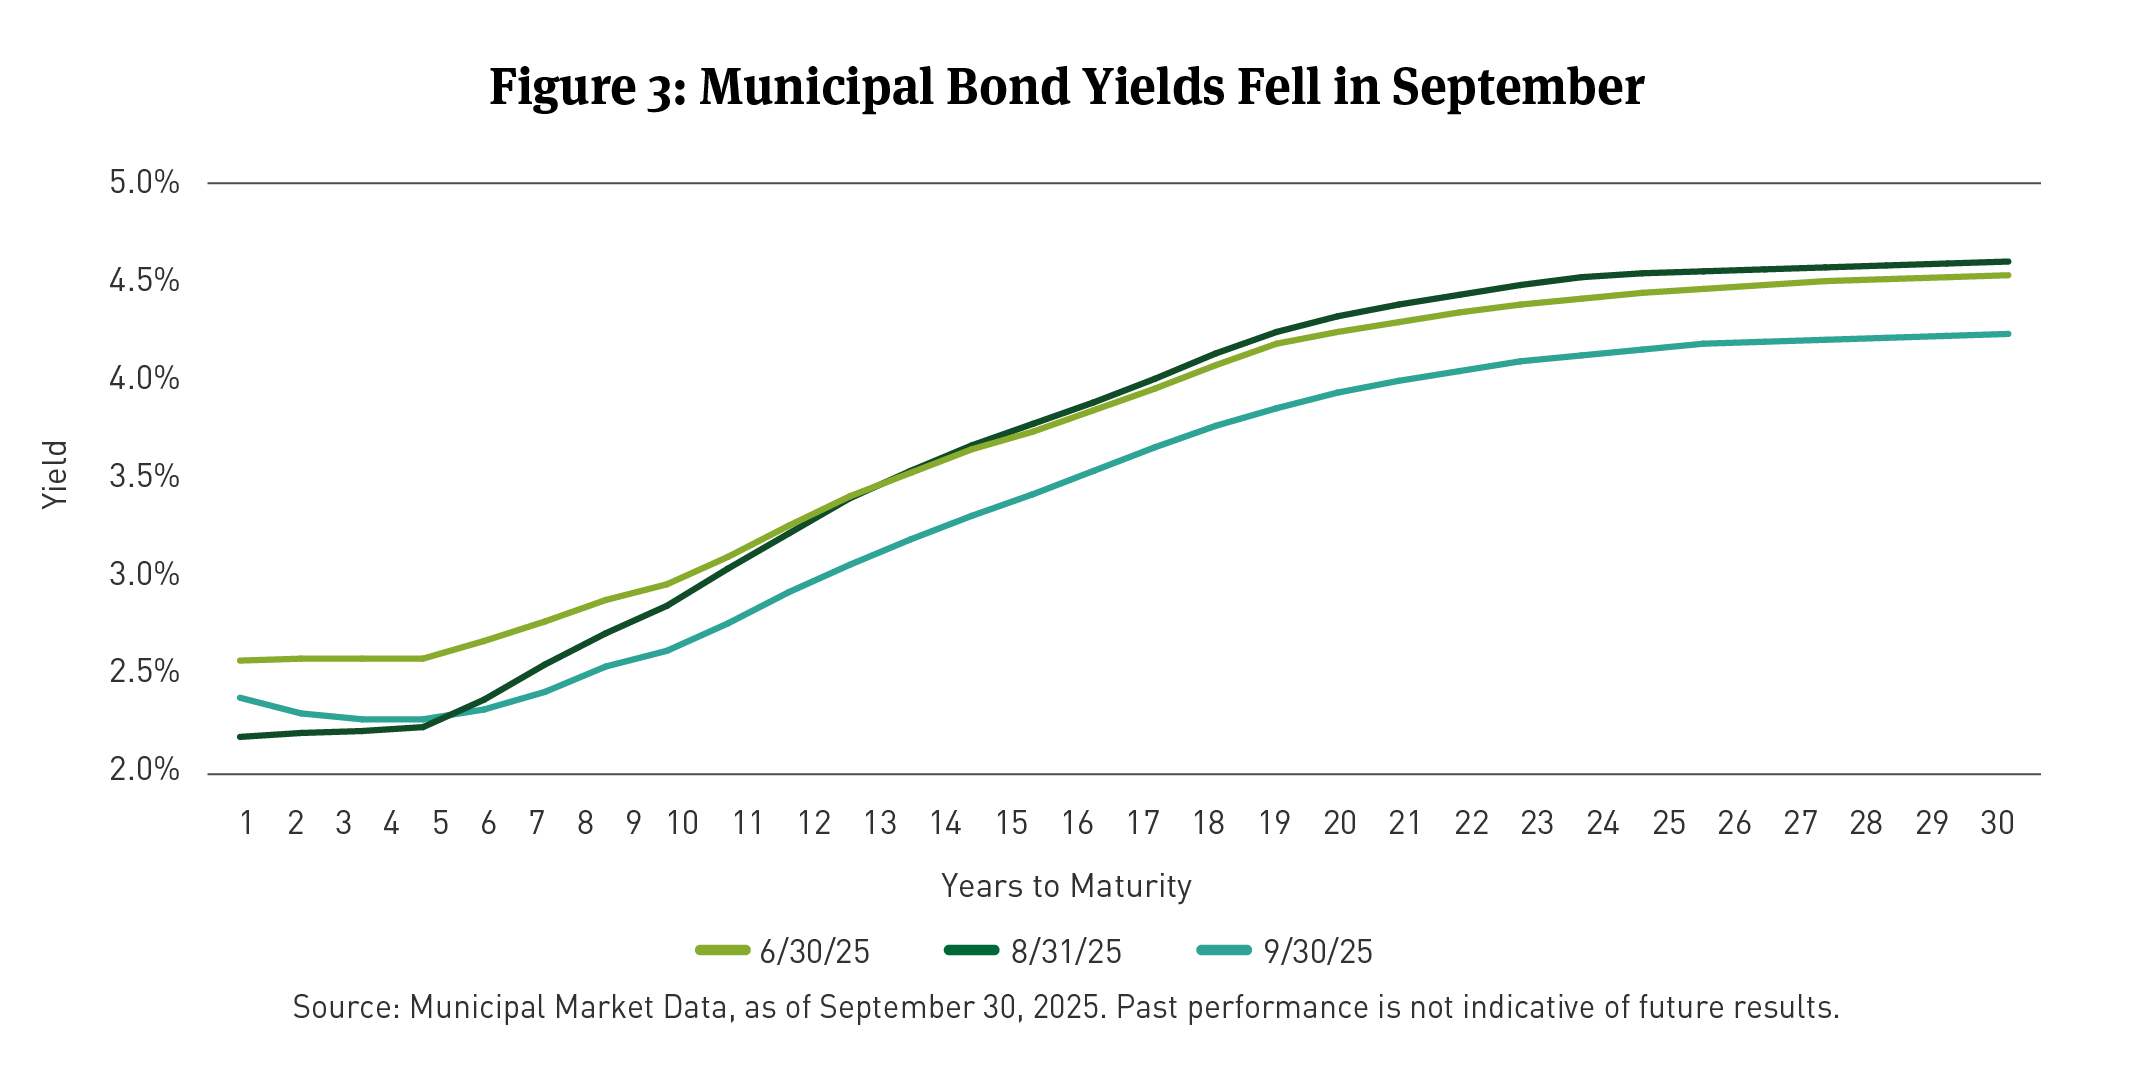
- Municipal Market Rates and Technicals: Municipal bond yields declined, particularly at the long end, with the 10-year AAA yield falling by 28bps.
- Corporate Market Technicals: The option-adjusted spread (OAS) for the Bloomberg (BBG) Corporate Investment Grade (IG) Index [1] tightened by 5bps, and corporate bond issuance reached $226 billion.
- Securitized Trends: Mortgage-backed securities (MBS) and asset-backed securities (ABS) saw positive returns, with MBS outperforming due to a 4bps spread tightening.
- Equity Market Trends: The S&P 500 Index gained 3.65 percent in September, driven by strong performance in the Information Technology and Communication Services sectors.
The following commentary is a summary of discussions among members of the Breckinridge Capital Advisors Investment Committee, as they reviewed monthly activity in the markets and investment returns. The members of the Investment Committee, under the leadership of Co-Chief Investment Officers Matthew Buscone and Jeffrey Glenn, CFA, are Co-Heads of Research, Nicholas Elfner and Adam Stern, J.D., M.P.A.; and Portfolio Manager and Director, Corporate Research, Josh Perez, CFA.
MARKET REVIEW
Risk assets continued their summer rally in September, with the S&P 500 Index rising more than three percent. The economy showed constructive data, including robust consumption and personal spending, which increased by 0.6 percent in August.2 The Federal Reserve (Fed) cut interest rates by 25bps in mid-September, as expected, and its Dot Plot3 suggests one or two more cuts in the fourth quarter.
The Treasury curve bull flattened4 in September, with the 30-year yield down 20bps and the 2-year yield down 1bp (See Figure 1). The Bloomberg U.S. Treasury Index5 returned 0.85 percent for the month. Treasury yields ended the quarter lower across the curve.
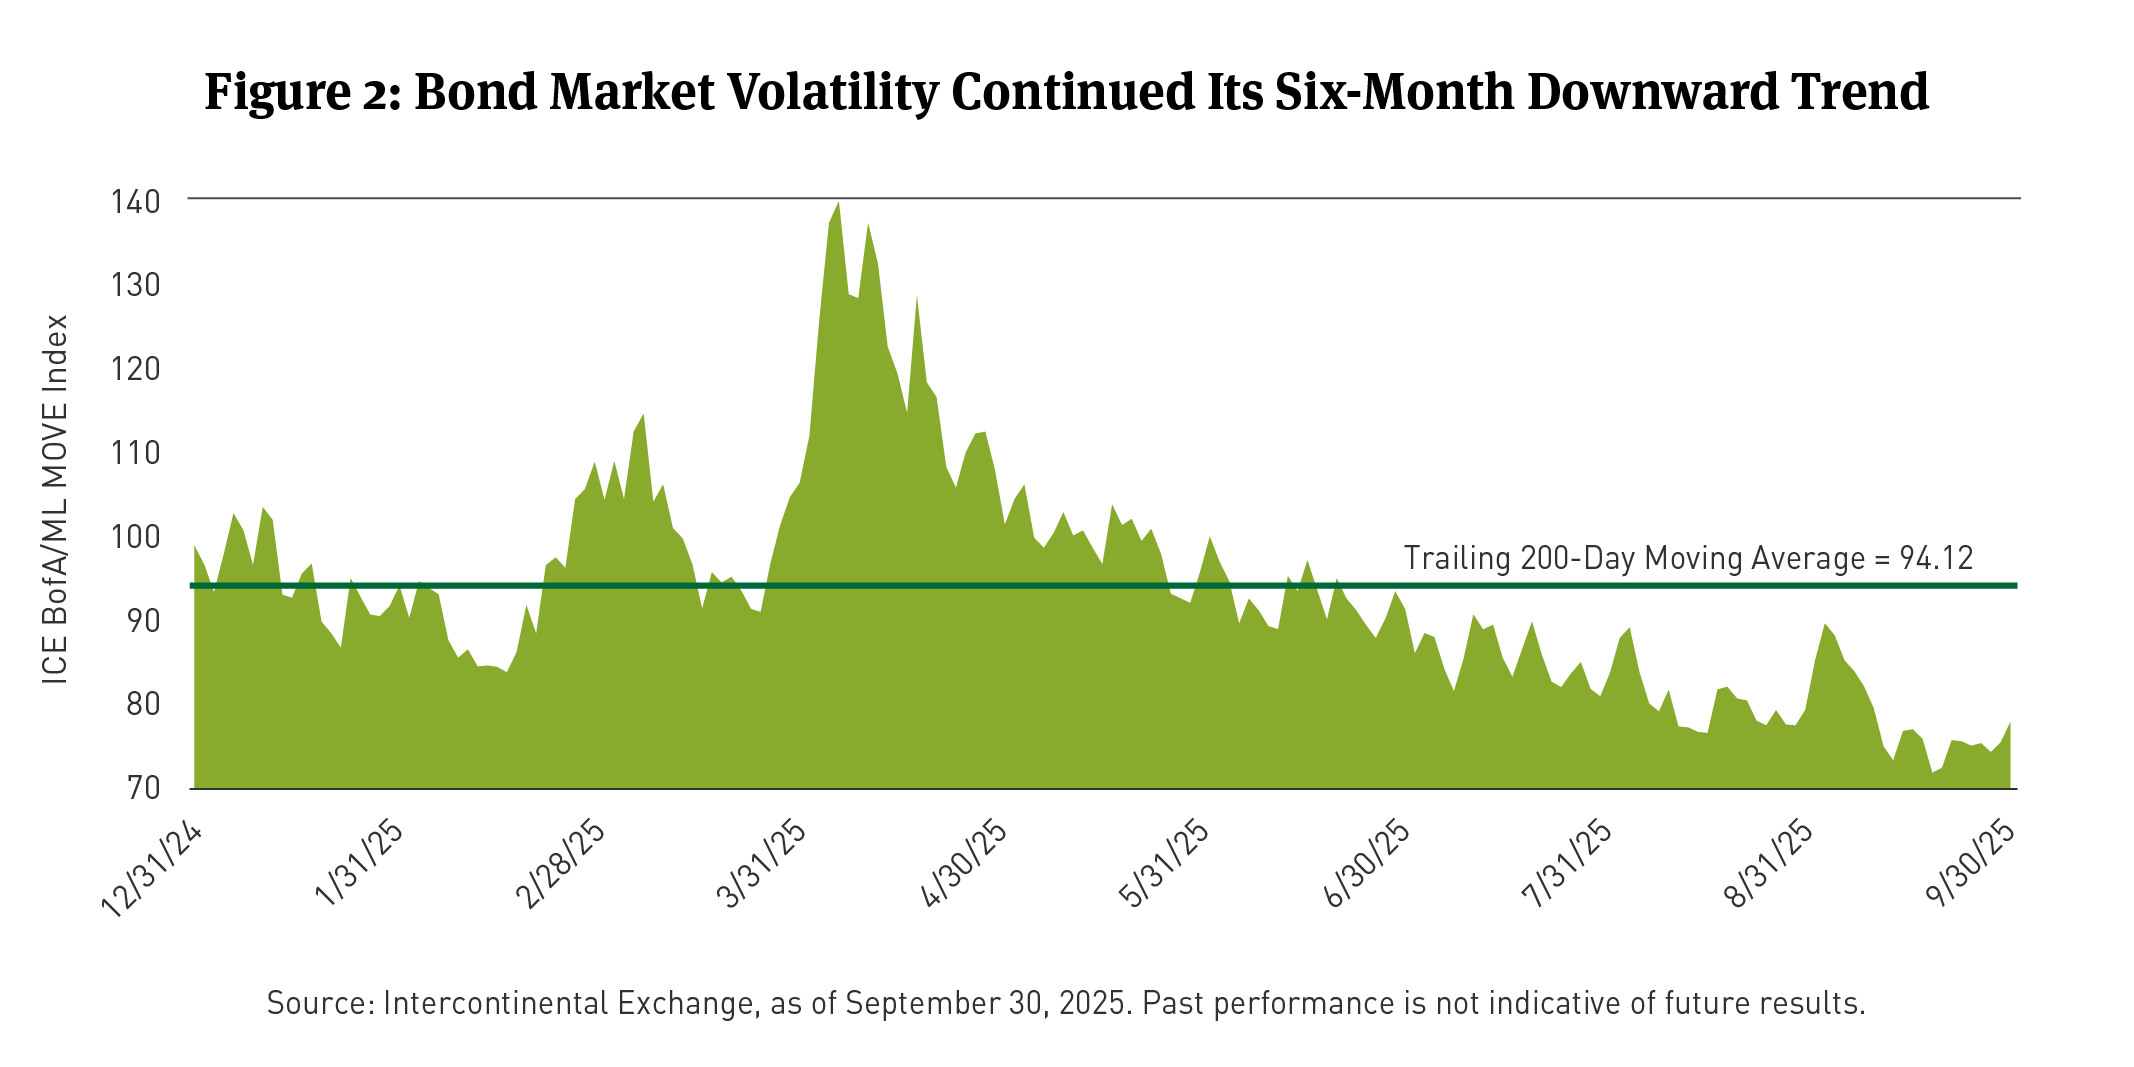
Since peaking in April, the Intercontinental Exchange (ICE) Bank of America/Merrill Lynch Option Volatility Estimate (MOVE) Index, a measure of bond market volatility, has continued its downward trend. (See Figure 2).
The Breckinridge Investment Committee (IC) expects the Fed to cut rates one more time this year, recognizing the potential impact of slowing job growth on economic expansion. Given the outlook for moderate growth, portfolio positioning remains defensive, with a focus on very tight valuations in most spread sectors and continued fund flows into fixed income.
MUNICIPAL MARKET REVIEW
In September 2025, the municipal bond market saw a modest increase in new issuance, totaling $49 billion, a slight decrease from the $52 billion issued in August. This supply was met with strong demand, particularly in the short and intermediate sectors, driven by favorable economic conditions and the Fed's rate cut.
The Bloomberg Short/Intermediate Municipal Bond Index6 returned 0.96 percent in September, outperforming Treasuries. Longer-term municipal yields generally declined in the month, and the quarter ended September 30. The 2-year yield added 6bps, the 5-year, 10-year, and 30-year yields fell by 6, 28, and 35bps, respectively in September (See Figure 3). These yield changes contributed to outperformance for longer maturity bonds.
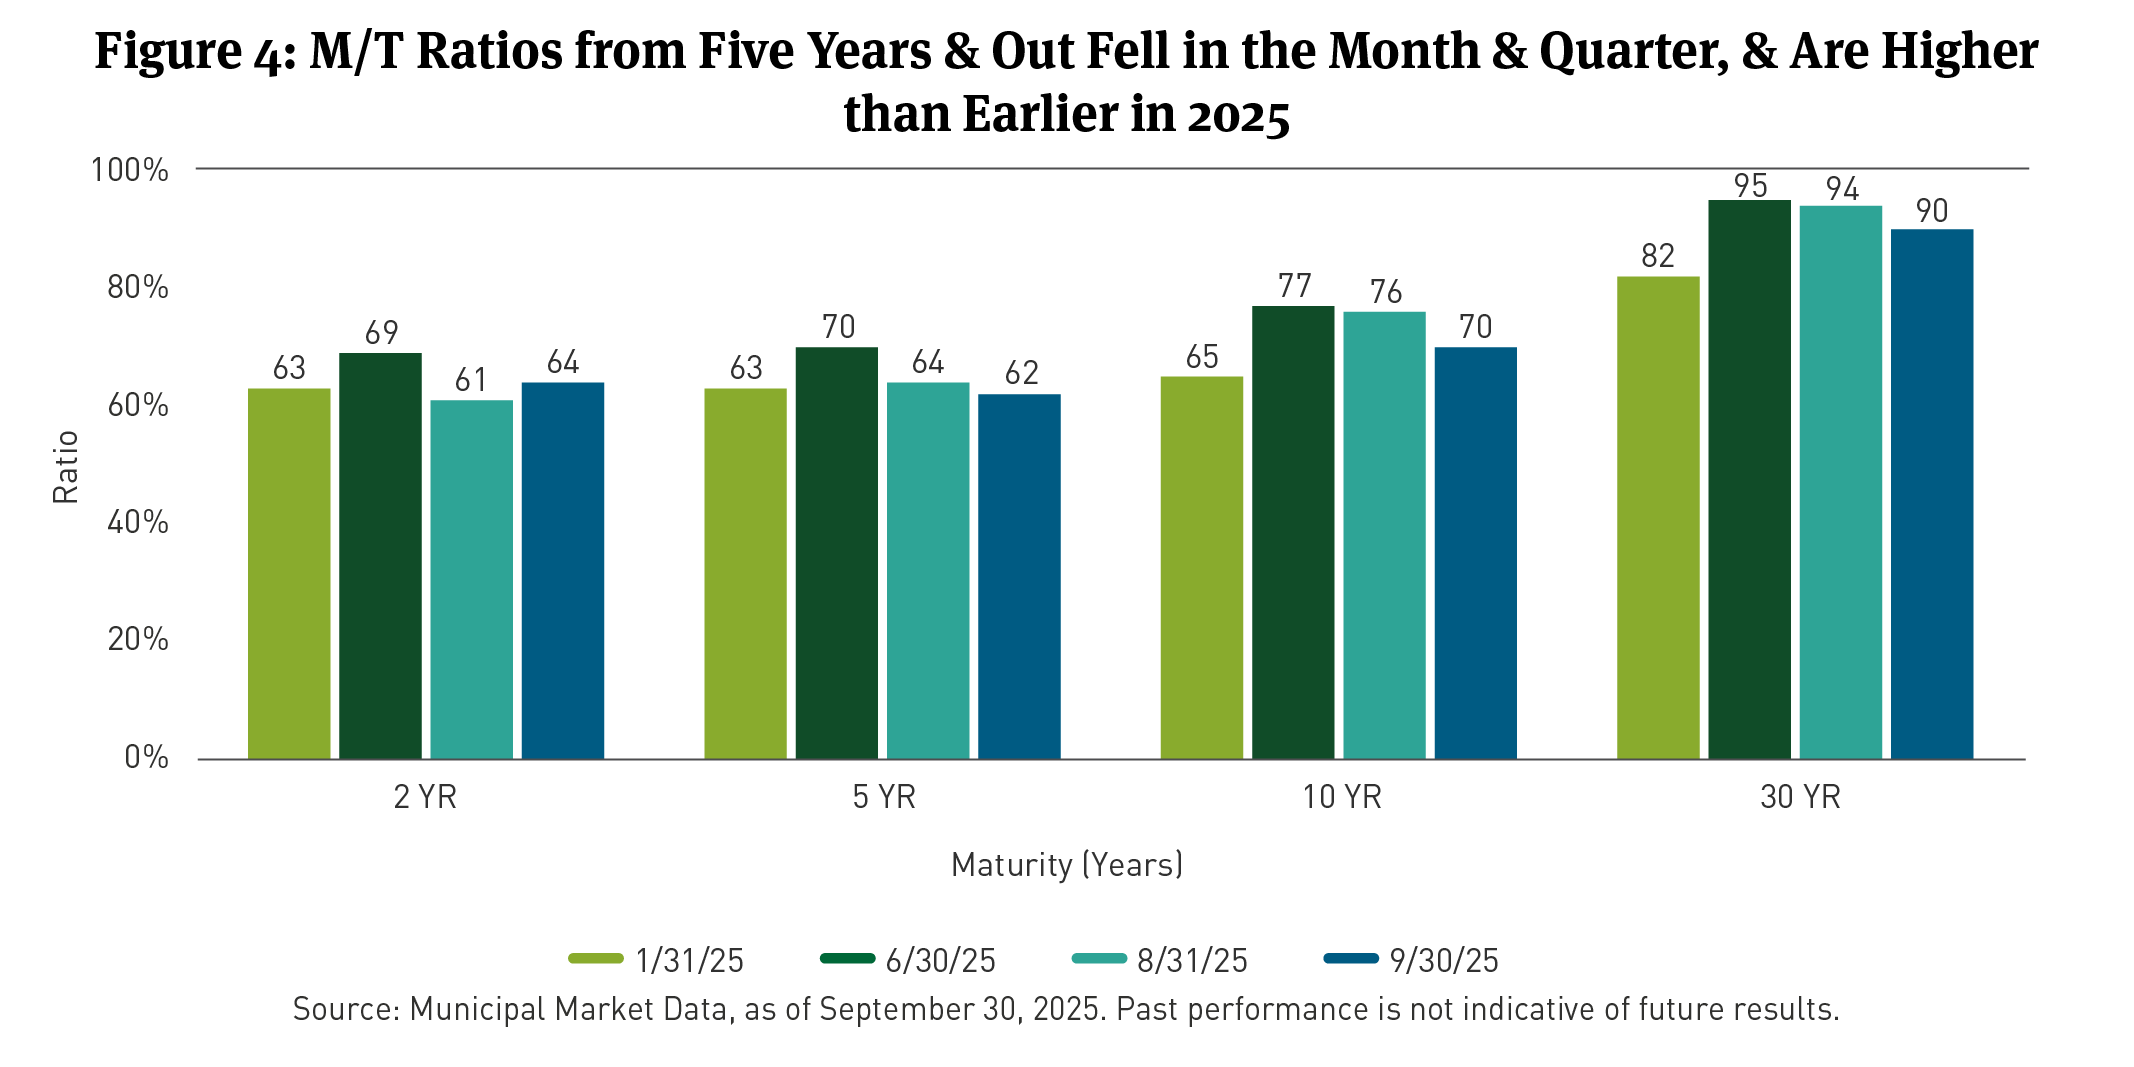
Municipal/Treasury7 (M/T) ratios rose slightly in 2 years but declined across the rest of the curve, outperforming in 10 years and 30 years (See Figure 4). These ratios suggest that municipal bonds continue to offer attractive yields relative to Treasuries, particularly at the longer end of the curve.
Municipal bond fund flows were positive, with net inflows of $969 million in September. This inflow reflects continued investor interest in the sector, driven by the search for yield and the tax advantages of municipal bonds. The IC expects this trend to continue, with potential for higher net supply in October, creating buying opportunities. Over the longer-term, the IC anticipates that the Fed's easing cycle and reduced supply in the fourth quarter will place downward pressure on yields and ratios in the municipal bond market.
CORPORATE MARKET REVIEW
The U.S. Corporate Index OAS tightened by 5bps in September. On a total return basis, the Corporate Bond Index returned 1.50 percent, with an excess return of 0.48 percent.
Per BBG the best-performing sectors in September were Sovereigns, Health Insurance, Oil Field Services, and supermarkets. Conversely, the worst-performing sectors were Supranationals, Foreign Agencies, Cable Satellite Services, Foreign Local Governments, and Chemicals.
Total fixed-rate gross IG corporate supply was $226 billion in September. After accounting for redemptions of $116 billion, net supply was $110 billion.
Through September 30, a net total of approximately $71 billion flowed into long-term taxable bond mutual and exchange-traded funds (ETFs), according to the Investment Company Institute.
SECURITIZED MARKET REVIEW
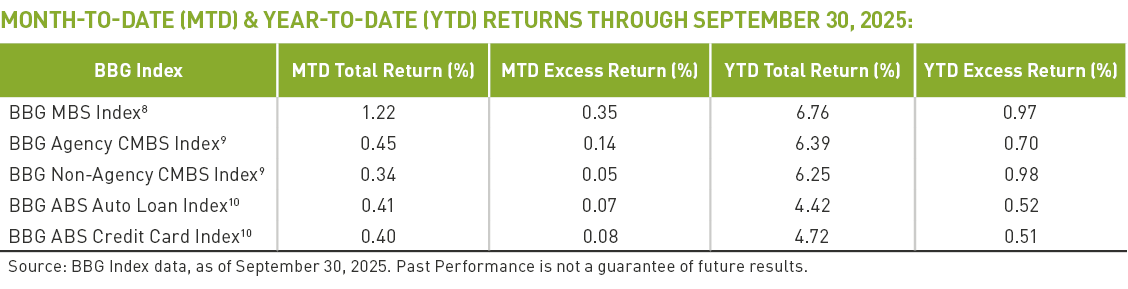
During September, MBS generated a total return of 1.22 percent, with an excess return of 0.35 percent as spreads tightened 4bps. Lower coupons (2.0 and 2.5) led the sector, delivering 65 to 73bps of excess return.
In the ABS market, total returns were positive. Auto loans returned 0.41 percent, while credit card loans returned 0.4 percent. Excess returns were modest, with auto loans generating 7bps and credit card loans 8bps.
The securitized market outlook remains healthy with fundamentals remaining stable away from recent subprime auto headlines. Lower rate volatility and strong demand are supporting MBS, while ABS and RMBS sectors are holding steady despite heavy supply.
EQUITY MARKET REVIEW
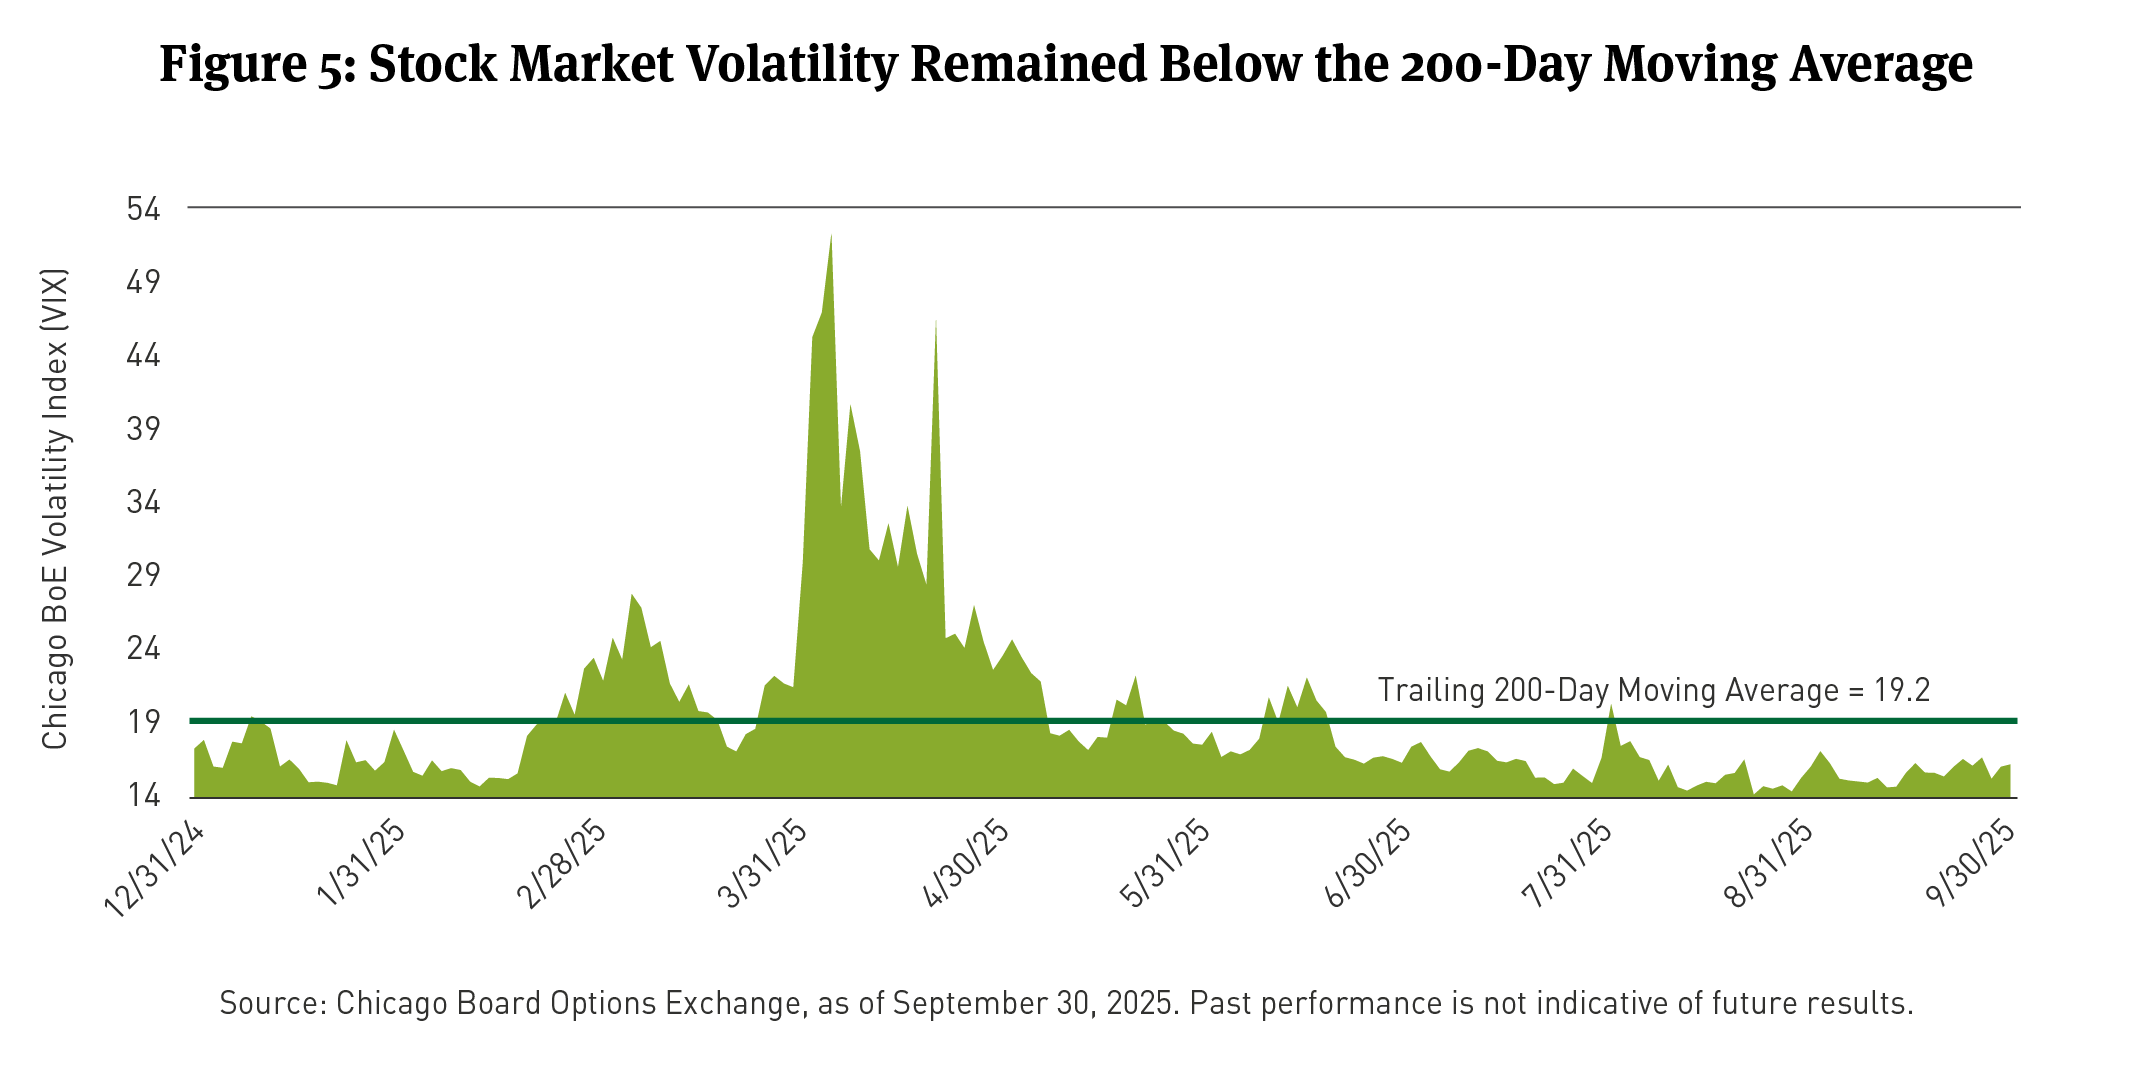
The S&P 500 Index returned 3.65 percent in September. The VIX Index, a measure of market volatility, trended below the 200-day moving average of 19.2, indicating low volatility (See Figure 5).
The best-performing sectors were Information Technology, up 7.25 percent, and Communication Services, up 5.6 percent. The worst-performing sectors were Materials, down 2.08 percent, and Consumer Staples, down 1.56 percent.
The Russell 1000 Growth Index11 gained 5.3 percent, outperforming the Russell 1000 Value Index12, which returned 1.5 percent.
In September, momentum and large capitalization were the strongest performing factors while dividend yield and high value underperformed.
[1] As of September 30, 2025, as measured by the BBG U.S. Corporate Investment Grade Bond Index, an unmanaged market-value-weighted index of investment grade corporate fixed-rate debt issues with maturities of one year or more. You cannot invest directly in an index.
[2] U.S. Department of Commerce, as of September 16, 2025.
[3] The Fed’s dot plot is a chart that records each Fed official’s projection for the central bank’s key short-term interest rate.
[4] A curve that bull flattens shows long-term interest rates falling faster than short-term interest rates, causing the spread between them to narrow.
[5] The Bloomberg U.S. Treasury Bond Index is an unmanaged index of prices of U.S. Treasury bonds with maturities of 1 to 30 years. You cannot invest directly in an index.
[6] Municipal bond performance is as measured by the BBG Managed Money Short/Intermediate (1-10) Index, which measures the performance of the publicly traded municipal bonds that cover the USD-denominated short/intermediate term tax-exempt bond market, including state and local general obligation bonds, revenue bonds, insured bonds, and pre-refunded bonds. It is rules-based, and market-value weighted. You cannot invest directly in an index.
[7] The Municipal/Treasury (M/T) ratio compare yields of municipals bonds with those of U.S. Treasury bonds of the same maturity. M/T ratios can show the relative value of municipal bonds compared with taxable bonds, by indicating when yields for municipal bonds exceed the after-tax yields on taxable bonds. M/T ratio data is per Municipal Market Data, as of September 30, 2025.
[8] The Bloomberg MBS Index tracks agency mortgage-backed pass-through securities (both fixed-rate and hybrid ARM) guaranteed by government-sponsored enterprises (GSEs) Government National Mortgage Association (Ginnie Mae) (GNMA), Federal National Mortgage Association (Fannie Mae) (FNMA), and Federal Home Loan Mortgage Corporation (Freddie Mac) (FHLMC). The index is constructed by grouping individual pools into aggregates or generics based on program, coupon, and vintage. You cannot invest directly in an index.
[9] The Bloomberg U.S. CMBS Investment Grade Index measures the market of U.S. Agency (GNMA, FNMA, and (FHLMC) and U.S. Non-Agency conduit and fusion CMBS deals with a minimum current deal size of $300mn. You cannot invest directly in an index.
[10] Bloomberg U.S. Asset-Backed Securities (ABS) Index is the ABS component of the Bloomberg U.S. Aggregate Bond Index, a flagship measure of the U.S. investment grade, fixed-rate bond market. The ABS index has three subsectors: credit and credit cards, autos, and utility. You cannot invest directly in an index.
[11] The Russell 1000® Growth Index is an unmanaged market capitalization-weighted index of growth-oriented stocks of U.S. domiciled companies that are included in the Russell 1000 Index. Growth-oriented stocks tend to have higher price-to-book ratios and higher forecasted growth values. You cannot invest directly in an index.
[12] The Russell 1000® Value Index is an unmanaged market capitalization-weighted index of value-oriented stocks of U.S. domiciled companies that are included in the Russell 1000 Index. Value-oriented stocks tend to have lower price-to-book ratios and lower forecasted growth values. You cannot invest directly in an index.
BCAI- 10092025-zphhrsne (10/10/2025)
DISCLAIMERS:
This material provides general information and should not be construed as a solicitation or offer of services or products or as legal, tax or investment advice. Nothing contained herein should be considered a guide to security selection, asset allocation or portfolio construction.
All information and opinions are current as of the dates indicated and are subject to change. Breckinridge believes the data provided by unaffiliated third parties to be reliable but investors should conduct their own independent verification prior to use. Some economic and market conditions contained herein have been obtained from published sources and/or prepared by third parties, and in certain cases have not been updated through the date hereof.
There is no assurance that any estimate, target, projection or forward-looking statement (collectively, “estimates”) included in this material will be accurate or prove to be profitable; actual results may differ substantially. Breckinridge estimates are based on Breckinridge’s research, analysis and assumptions. Other events that were not considered in formulating such projections could occur and may significantly affect the outcome, returns or performance.
Not all securities or issuers mentioned represent holdings in client portfolios. Some securities have been provided for illustrative purposes only and should not be construed as investment recommendations. Any illustrative engagement or sustainability analysis examples are intended to demonstrate Breckinridge’s research and investment process.
Yields and other characteristics are metrics that can help investors in valuing a security, portfolio or composite. Yields do not represent performance results but they are one of several components that contribute to the return of a security, portfolio or composite. Yields and other characteristics are presented gross of advisory fees.
All investments involve risk, including loss of principal. No investment or risk management strategy, including diversification, can guarantee positive results or risk elimination in any market. Periods of elevated market volatility can significantly impact the value of securities. Investors should consult with their advisors to understand how these risks may affect their portfolios and to develop a strategy that aligns with their financial goals and risk tolerances.
Past performance is not indicative of future results. Breckinridge makes no assurances, warranties or representations that any strategies described herein will meet their investment objectives or incur any profits. Performance results for Breckinridge’s investment strategies include the reinvestment of interest and any other earnings, but do not reflect any brokerage or trading costs a client would have paid. Results may not reflect the impact that any material market or economic factors would have had on the accounts during the time period. Due to differences in client restrictions, objectives, cash flows, and other such factors, individual client account performance may differ substantially from the performance presented.
Actual client advisory fees may differ from the advisory fee used to calculate net performance results. Client returns will be reduced by the advisory fees and any other expenses incurred in the management of their accounts. For example, an advisory fee of 1 percent compounded over a 10-year period would reduce a 10 percent return to a 9 percent annual return. Additional information on fees can be found in Breckinridge’s Form ADV Part 2A.
Index results are shown for illustrative purposes and do not represent the performance of any specific investment. Indices are unmanaged and investors cannot directly invest in them. They do not reflect any management, custody, transaction or other expenses, and generally assume reinvestment of dividends, income and capital gains. Performance of indices may be more or less volatile than any investment strategy.
Fixed income investments have varying degrees of credit risk, interest rate risk, default risk, and prepayment and extension risk. In general, bond prices rise when interest rates fall and vice versa.
Equity investments are volatile and can decline significantly in response to investor reception of the issuer, market, economic, industry, political, regulatory or other conditions.
BLOOMBERG® is a trademark and service mark of Bloomberg Finance L.P. and its affiliates (collectively “Bloomberg”). Bloomberg does not approve or endorse this material or guarantees the accuracy or completeness of any information herein, or makes any warranty, express or implied, as to the results to be obtained therefrom and, to the maximum extent allowed by law, neither shall have any liability or responsibility for injury or damages arising in connection therewith.
The S&P500 Index (“Index”) and associated data is a product of S&P Dow Jones Indices LLC, its affiliates and/or their licensors and has been licensed for use by Breckinridge. © 2025 S&P Dow Jones Indices LLC, its affiliates and/or their licensors. All rights reserved. Redistribution or reproduction in whole or in part are prohibited without written permission of S&P Dow Jones Indices LLC. For more information on any of S&P Dow Jones Indices LLC’s indices please visit www.spdji.com. S&P® is a registered trademark of Standard & Poor’s Financial Services LLC (“SPFS”) and Dow Jones® is a registered trademark of Dow Jones Trademark Holdings LLC (“Dow Jones”). Neither S&P Dow Jones Indices LLC, SPFS, Dow Jones, their affiliates nor their licensors (“S&P DJI”) make any representation or warranty, express or implied, as to the ability of any index to accurately represent the asset class or market sector that it purports to represent and S&P DJI shall have no liability for any errors, omissions, or interruptions of any index or the data included therein.