Sustainable
Sustainable Investing Newsletter published on January 15, 2026
Quantifying Power Demand from Artificial Intelligence
Summary
- U.S. electricity consumption is forecasted to grow up to 25 percent by 2030, with over half of growth from data centers.
- Rising demand will be served through a mix of existing resources, renewables, storage, natural gas, and nuclear, with data center customers increasingly valuing speed-to-power attributes of solar and batteries.
- Utilities are adopting specialized rates for large load customers to shield existing ratepayers from capital costs and stranded-asset risk.
Even in casual conversations, the rising cost of utility bills has become a common topic. It’s no question the number of kilowatts zipping through the grid is increasing. Fingers are quick to point at data centers and artificial intelligence (AI) as the buzzwords of the time.
Electricity demand is increasing. AI is accelerating the trend. Higher demand has collided with slow power supply growth and significant plant retirements over the last decade, resulting in higher price signals across the power industry.
Breckinridge is investigating these themes to better understand evolving risk and reward opportunities in the Utilities sector. Our research focuses on quantifying power demand and its impact on the energy transition. We also are exploring the ways utilities may protect rate payers from rising bills, while maintaining reliability and increasing generation capacity. (For further insights into shifting energy transition trends, see our 2025 Climate Report.)
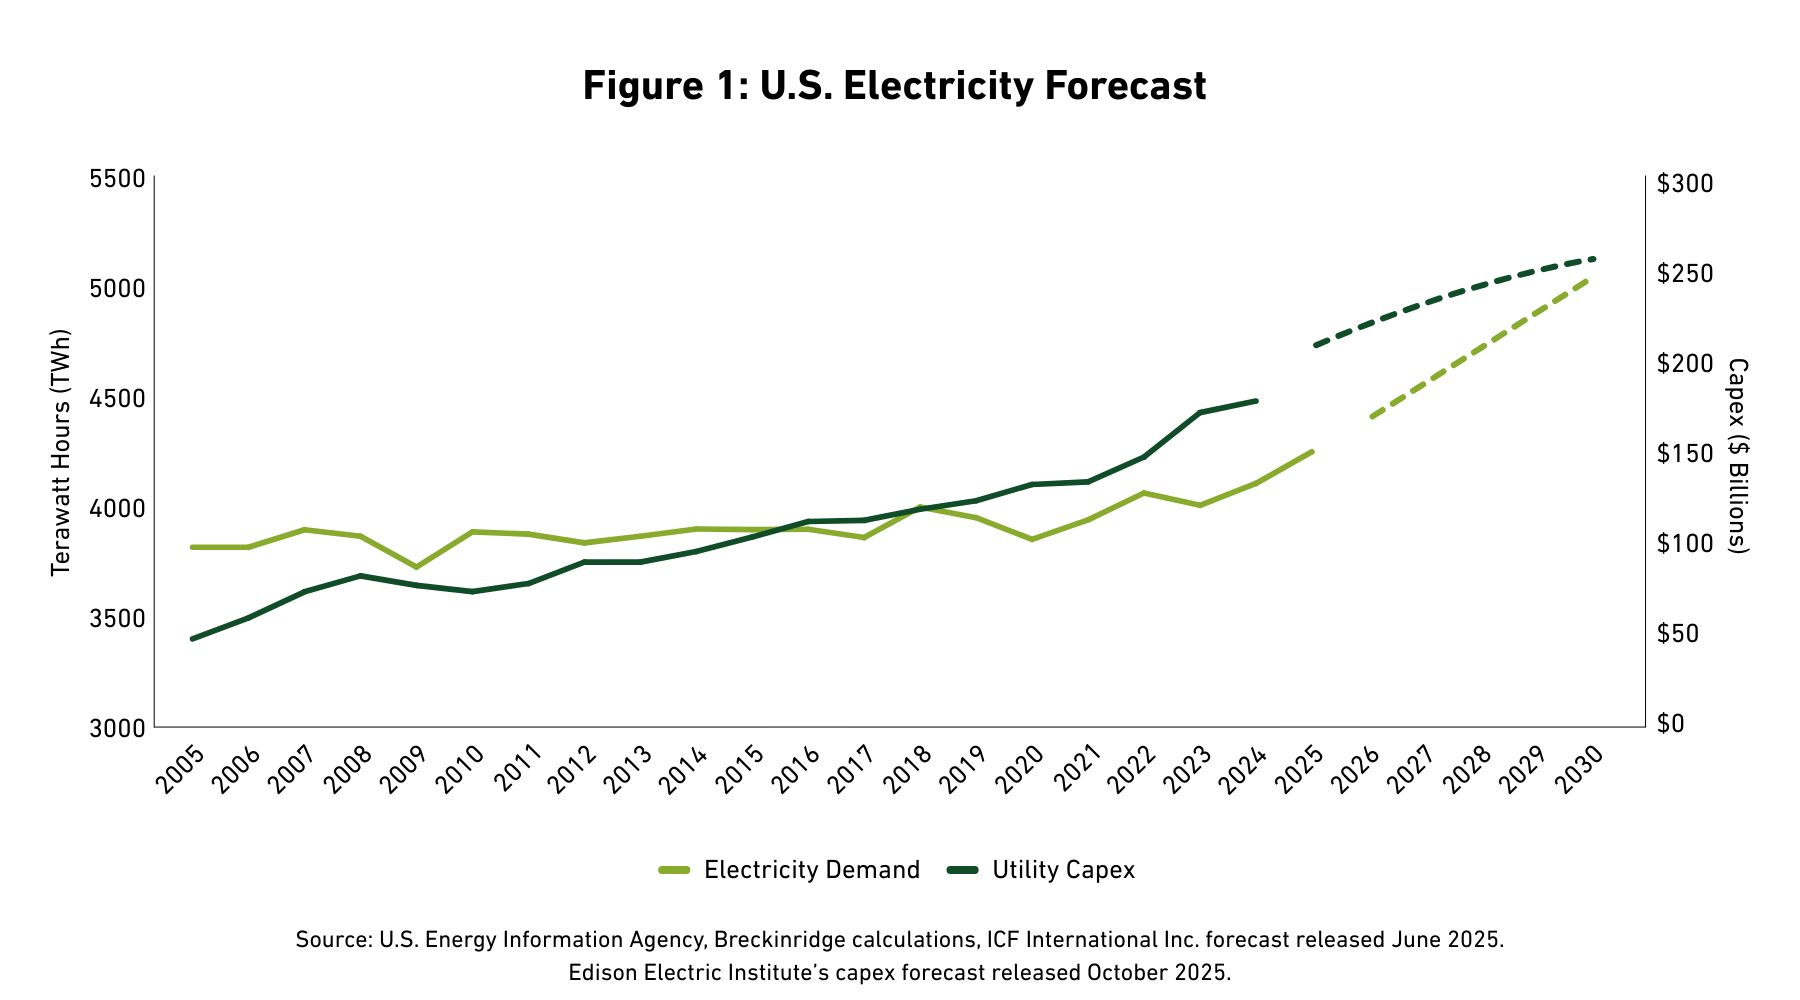
U.S. power demand is back on an upward trajectory
Electric demand flatlined from 2005-2020, with energy efficiency and outsourcing offsetting economic growth. From 2020 to 2024, growth averaged 1.5 percent, entering new stages of electrification such as electric vehicles and industrial processes. More recently, power demand forecasts accelerated with some estimating up to 25 percent growth by 2030, equating to 3 to 4 percent annual growth.1
Per the U.S. Energy Information Administration (EIA), the U.S. consumed over 4,000 terawatts2 per hour (TWh) of electricity in 2024. Based on growth assumptions, U.S. electricity consumption would approach 5,000 TWH in 2030. For comparison, 1,000 TWh of incremental demand equates to approximately 100 million homes or alternatively, the electricity usage of California, Texas, and Florida combined (See Figure 1).
How much demand relates to AI?
Third-party power consumption estimates for data centers are wide, ranging from 300 TWh to over 1,000 TWh by 2030. The midpoint is about 650 TWh. This means over 50 percent of forecasted electricity growth is attributable to data centers. It also means non-data center demand represents significant growth. Without AI, demand would still be growing. Non-data center sources include electric vehicles, electric heating, reshoring of manufacturing, electrification of oil and gas drilling, liquid natural gas (LNG) exports, and other industrial growth.
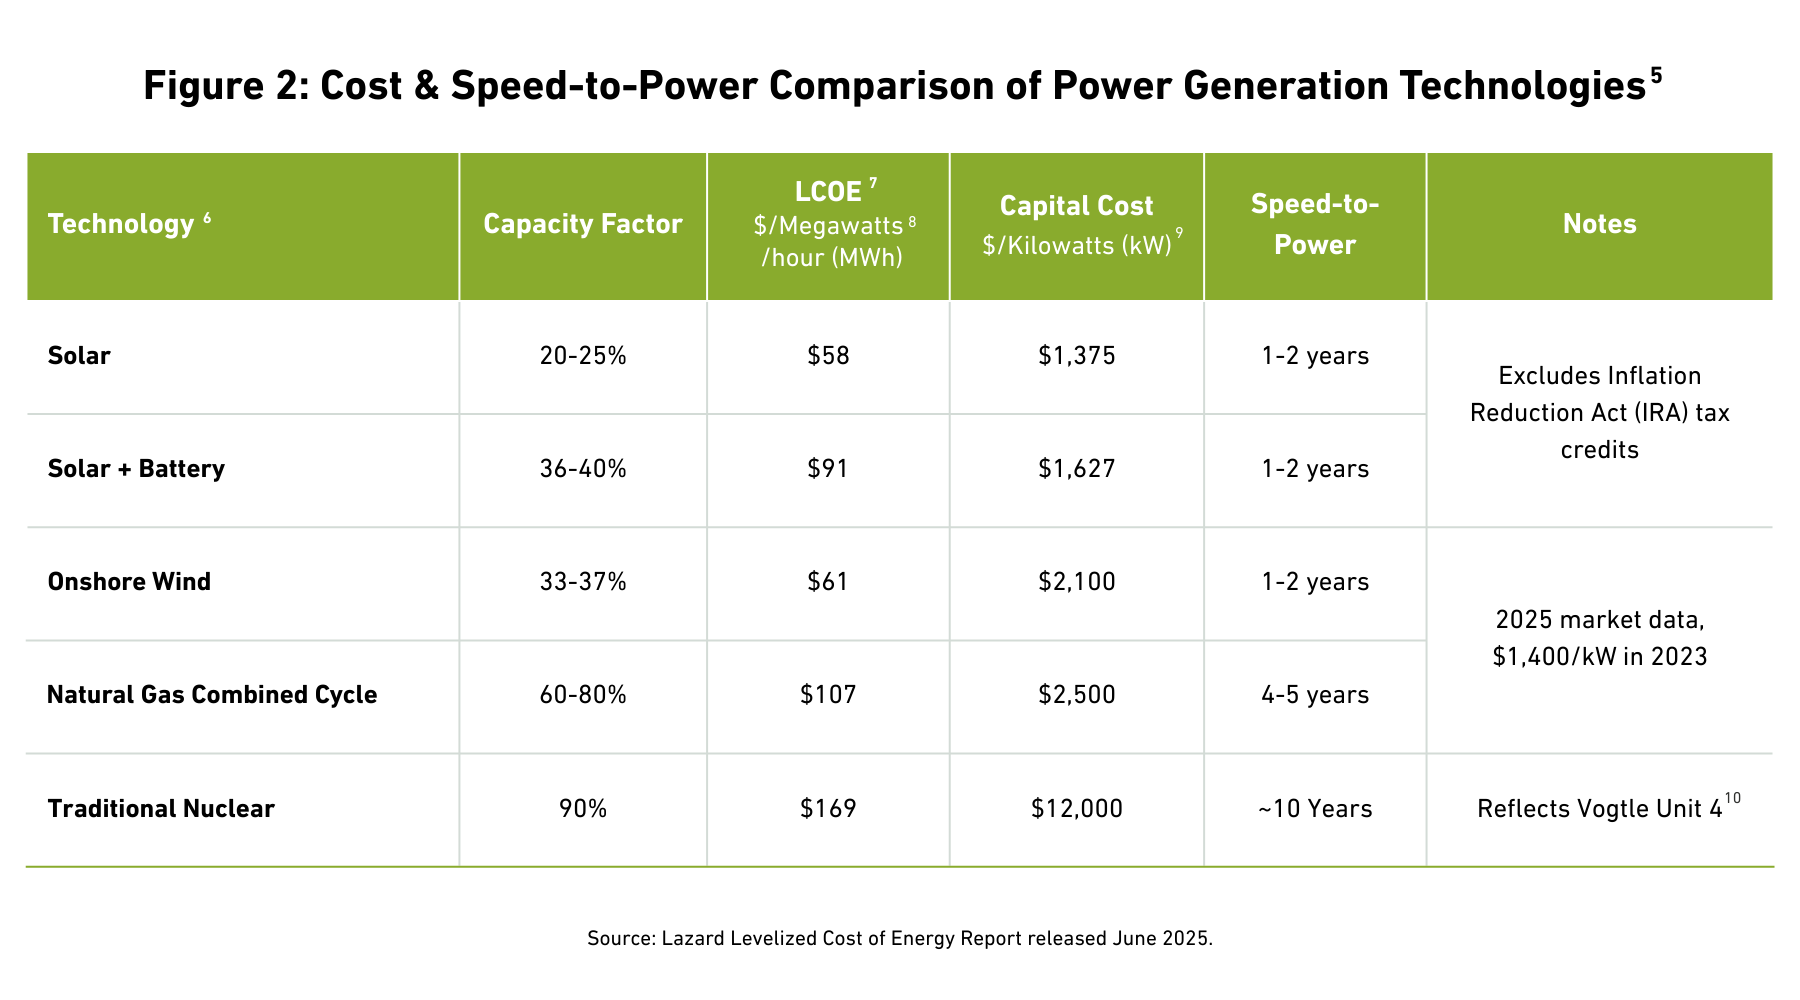
New demand requires about 140 gigawatts3 (GW) of generation capacity by 2030. Breckinridge expects an energy-abundance approach4 for grid additions. New sources of generation include operating the existing fleet at higher utilization while adding renewables, battery storage, natural gas, and nuclear. Fuel type will depend on cost and speed-to-power (See Figure 2 and corresponding notes).
As utilities increase capital spending and electricity consumption accelerates, affordability risk emerges
Higher electricity demand is contributing to record utility capital spending (capex). Utility sector capex doubled from $104 billion in 2015 to $208 billion in 2025 and is expected to reach $248 billion in 2029.11 Regulated utilities pass through a portion of capital costs and earn a regulated return on investment.
Over 50 percent of spending is on Transmission and Distribution modernization. For data center-specific capex, utilities are adopting specialized large-load tariffs to protect rate payers from data center connection costs and stranded asset risk. A utility may spend hundreds of millions or billions of dollars to supply power to a large load, only for the customer to use less power or shut down sooner than expected.
Utilities working alongside regulators are establishing contract provisions that provide ratepayer protections. Terms include a combination of upfront fees, exit fees, minimum volume commitments, contract length requirements, and collateral postings. Provisions vary by state.
We see affordability risk in states with weaker large load contract provisions and higher utility bill wallet share. We are also monitoring customer concentration risk as data centers become a greater portion of an individual utility’s load.
We also see greater affordability risk in regions with unregulated or competitive power generation, which accounts for two-thirds of the U.S. In these regions, electric bills consist of supply and delivery components. The delivery component is controlled by regulators and utilities. However, the supply charge is set by market prices, which follow supply and demand curves, meaning utilities and regulators have minimal control over a large portion of the bill.
Market power prices12 have more than doubled from $20 to 30/MWh to $50 to 70/MWh depending on the region, since 2020. Revenue raised from the PJM13 capacity auction increased from $2.2 billion for delivery year 2024-2025 to $14.7 billion for delivery year 2025-2026, $16.1billion for delivery year 2026-2027, and $16.4 billion for delivery year 2027-2028. PJM capped the clearing price to prevent further increases in the two most recent auctions. We are monitoring PJM and FERC policy changes that could impact future results. Capacity revenue is ultimately paid by ratepayers to power plant owners as an incentive to stabilize revenue, maintain grid reliability, and provide lead time to build or retire assets.
Breckinridge is monitoring power market dynamics, data center trends, and evolving federal and state policies. Affordability and reliability remain top of mind for investors, ratepayers, management teams, regulators, and politicians.
Utility capital spending will bring a wave of new debt issuance. We expect utilities to maintain current credit ratings driven by rate increases, increased equity funding in the form of common stock and hybrid issuance, and asset sales. Breckinridge also integrates energy transition factors into the fundamental research process.
Spotlight on Power Generation Technologies
Solar and Batteries
Solar and batteries are among the lowest cost and can be operational in less than two years. Pairing a 4-hour battery to a solar farm can boost capacity factors to nearly 40 percent, reducing at least some dispatchability concerns. While H.R. 1 – One Big Beautiful Bill Act sunset solar and wind IRA credits earlier than expected, credits for batteries will provide incentives through most of the 2030s. Batteries will also help shave pricing during peak demand periods helping to reduce customer bills. The U.S. installed 56 GW of power in 2024 of which 60 percent was solar.14
Nuclear
Nuclear matches the always-on operating profile of a data center, while generating zero emissions. Recognizing clean and reliable attributes, hyperscalers15 have entered long-term contracts with existing plants to secure power at premium prices. They have also partnered with asset owners to restart recently retired reactors. Restarts are expected to be online by 2029 but add only 2 to 3 GW of incremental capacity. Hyperscalers have also announced agreements to explore advanced nuclear technology such as Small Module Reactors. The willingness for well capitalized players to provide funding for emerging technology is positive for the energy transition but SMRs are not expected to be viable until well after 2030. History suggests a new large-scale nuclear reactor would take over 10 years to build.16
Natural Gas
Breckinridge expects higher natural gas usage. Gas is dispatchable and will provide important baseload and peaking generation during high demand or during low renewable resource availability. However, high global demand for gas turbines has nearly doubled the cost of new build. The lead time for a new gas plant is four to five years due to turbine backlogs, in addition to permitting and lateral pipeline buildout.
Existing Resources
The U.S. is estimated to have 15 GW of available excess capacity.17 Higher asset utilization leads to increased revenue and lower per unit costs. Savings can be passed through to customers. However, higher utilization would contribute to higher emissions. Natural gas is 42 percent of the U.S. grid.18 Coal accounts for only 16 percent of generation but contributes half of electric sector emissions.19 Since 2015, the U.S. retired about 120 GW of coal. The Institute of Energy Economics and Financial Analysis (IEEFA) forecasts 60 GW of coal retirements by 2030.20 Retirements could be delayed one to two years to maintain grid reliability, but planned coal shutdowns are expected to proceed due to operational and environmental costs.
[1] Rising Current: America’s Growing Electricity Demand, ICF, June 2025
[2] 1 TWh is a trillion watts per hour, equal to the electricity used by approximately 100,000 homes in a year.
[3] 1 GW is 1 billion watts.
[4] An energy-abundance approach is a policy or economic framework that emphasizes expanding the supply of affordable, reliable, and clean energy as a foundation for growth, rather than focusing on conservation or scarcity.
[5] Please see Spotlight on Power Generation Technologies in this paper for more details on the technologies discussed in this table.
[6] The Lazard Levelized Cost of Energy (LCOE) Report is an annual analysis that compares the cost of generating electricity across different technologies such as solar, wind, gas, coal, and nuclear. The data in the table reflects the midpoint of Lazard estimates unless otherwise noted. For more, see the Lazard Leveled Cost of Energy Report. June 2025.
[7] LCOE is the average cost to generate a unit of electricity over the project lifetime factoring capital costs, capacity factor, fuel costs, fixed and variable operating costs, and other variables.
[8] 1 MWh equals 1 million watts per hour.
[9] 1 KWh equals 1,000 watt hours., the unit reported on residential electricity bills.
[10] Vogtle Unit 4 is the newest nuclear reactor at the Alvin W. Vogtle Electric Generating Plant in Georgia, which began commercial operations on April 29, 2024. It is part of the first new nuclear units built in the U.S. in more than 30 years.
[11] Edison Electric Institute (EEI) Financial Analysis Department, updated September 2025.
[12] Calendar year around the clock forward power prices in PJM and Energy Reliability Council of Texas (ERCOT).
[13] The PJM Interconnection is a regional transmission organization that coordinates wholesale electricity across 13 states. The PJM auction results released December 17, 2025 for delivery year 2027-2028 cleared at $333/MW-day setting a record high. PJM estimates that without the temporary price cap, the capacity price would have been $530/MW-day.
[14] Dan McCarthy, “Chart: 96 percent of new US power capacity was carbon-free in 2024,” Canary Media, January 10, 2025.
[15] Hyperscaler refers to cloud and internet companies like Amazon, Microsoft, and Google that operate large hyperscale data centers.
[16] U.S. Energy Information Administration, “U.S. commercial nuclear capacity comes from reactors built primarily between 1970 and 1990,” June 30, 2011.
[17] Morgan Stalney, "Turning Up the GPU Dial, and Assessing the Intelligence Bottlenecks,” December 1, 2025.
[18] International Energy Agency, as of December 31, 2024.
[19] Environmental Protection Agency, March 31, 2025.
[20] Dennis Wamsted, Seth Feaster, “Nowhere to go but down for U.S. coal capacity, generation,” IEEFA, October 24, 2024.
BCAI-12192025-dcmsj8pi (12/29/2025)
DISCLAIMERS:
The content is intended for investment professionals and institutional investors.
This material provides general information and should not be construed as a solicitation or offer of services or products or as legal, tax or investment advice. Nothing contained herein should be considered a guide to security selection, asset allocation or portfolio construction.
All information and opinions are current as of the dates indicated and are subject to change. Breckinridge believes the data provided by unaffiliated third parties to be reliable but investors should conduct their own independent verification prior to use. Some economic and market conditions contained herein have been obtained from published sources and/or prepared by third parties, and in certain cases have not been updated through the date hereof.
There is no assurance that any estimate, target, projection or forward-looking statement (collectively, “estimates”) included in this material will be accurate or prove to be profitable; actual results may differ substantially. Breckinridge estimates are based on Breckinridge’s research, analysis and assumptions. Other events that were not considered in formulating such projections could occur and may significantly affect the outcome, returns or performance.
Not all securities or issuers mentioned represent holdings in client portfolios. Some securities have been provided for illustrative purposes only and should not be construed as investment recommendations. Any illustrative engagement or sustainability analysis examples are intended to demonstrate Breckinridge’s research and investment process.
Yields and other characteristics are metrics that can help investors in valuing a security, portfolio or composite. Yields do not represent performance results but they are one of several components that contribute to the return of a security, portfolio or composite. Yields and other characteristics are presented gross of advisory fees.
All investments involve risk, including loss of principal. No investment or risk management strategy, including diversification, can guarantee positive results or risk elimination in any market. Periods of elevated market volatility can significantly impact the value of securities. Investors should consult with their advisors to understand how these risks may affect their portfolios and to develop a strategy that aligns with their financial goals and risk tolerances.
Active investing generally involves more risks than laddered strategies because active managers may take on greater market risk to outperform their index. There is no guarantee that either passive or active investing will achieve their objectives. Active strategies also tend to have higher management fees and operating costs than passive strategies. Investors should consider all the differences and risks before making any investment decisions. Active management does not guarantee a profit or protect against a loss.
Past performance is not indicative of future results. Breckinridge makes no assurances, warranties or representations that any strategies described herein will meet their investment objectives or incur any profits. Performance results for Breckinridge’s investment strategies include the reinvestment of interest and any other earnings, but do not reflect any brokerage or trading costs a client would have paid. Results may not reflect the impact that any material market or economic factors would have had on the accounts during the time period. Due to differences in client restrictions, objectives, cash flows, and other such factors, individual client account performance may differ substantially from the performance presented.
Actual client advisory fees may differ from the advisory fee used to calculate net performance results. Client returns will be reduced by the advisory fees and any other expenses incurred in the management of their accounts. For example, an advisory fee of 1 percent compounded over a 10-year period would reduce a 10 percent return to a 9 percent annual return. Additional information on fees can be found in Breckinridge’s Form ADV Part 2A.
Index results are shown for illustrative purposes and do not represent the performance of any specific investment. Indices are unmanaged and investors cannot directly invest in them. They do not reflect any management, custody, transaction or other expenses, and generally assume reinvestment of dividends, income and capital gains. Performance of indices may be more or less volatile than any investment strategy.
Fixed income investments have varying degrees of credit risk, interest rate risk, default risk, and prepayment and extension risk. In general, bond prices rise when interest rates fall and vice versa.
Equity investments are volatile and can decline significantly in response to investor reception of the issuer, market, economic, industry, political, regulatory or other conditions.
There is no guarantee that integrating sustainability factors, including those associated with climate risks, will improve risk-adjusted returns, lower portfolio volatility over any specific time period, or outperform the broader market or other strategies that do not utilize sustainability factors when selecting investments. The consideration of sustainability factors may limit investment opportunities available to a portfolio. In addition, sustainability data often lacks standardization, consistency and transparency and for certain companies such data may not be available, complete or accurate.
When considering sustainability factors, Breckinridge's investment team will include those factors that they believe are material. However, the investment team may conclude that other attributes outweigh these considerations when making investment decisions. Breckinridge can change its sustainability analysis methodology at any time.
Breckinridge’s sustainability analysis is based on third party data and Breckinridge analysts’ internal analysis. Analysts will review a variety of sources such as corporate sustainability reports, data subscriptions, and research reports to obtain available metrics for internally developed frameworks. Qualitative information is obtained from company reports, engagement discussion with corporate management teams, among others.
Breckinridge believes the data provided by unaffiliated third parties, including rating agencies, to be reliable but investors should conduct their own independent verification prior to use. Some economic and market conditions contained herein have been obtained from published sources and/or prepared by third parties, and in certain cases have not been updated through the date hereof. All information contained herein is subject to revision. Any third-party websites included in the content has been provided for reference only, and does not necessarily indicate an endorsement.
The S&P500 Index (“Index”) and associated data is a product of S&P Dow Jones Indices LLC, its affiliates and/or their licensors and has been licensed for use by Breckinridge. © 2025 S&P Dow Jones Indices LLC, its affiliates and/or their licensors. All rights reserved. Redistribution or reproduction in whole or in part are prohibited without written permission of S&P Dow Jones Indices LLC. For more information on any of S&P Dow Jones Indices LLC’s indices please visit www.spdji.com. S&P® is a registered trademark of Standard & Poor’s Financial Services LLC (“SPFS”) and Dow Jones® is a registered trademark of Dow Jones Trademark Holdings LLC (“Dow Jones”). Neither S&P Dow Jones Indices LLC, SPFS, Dow Jones, their affiliates nor their licensors (“S&P DJI”) make any representation or warranty, express or implied, as to the ability of any index to accurately represent the asset class or market sector that it purports to represent and S&P DJI shall have no liability for any errors, omissions, or interruptions of any index or the data included therein.