Corporate
Commentary published on October 7, 2025
Q4 2025 Corporate Bond Market Outlook
Summary
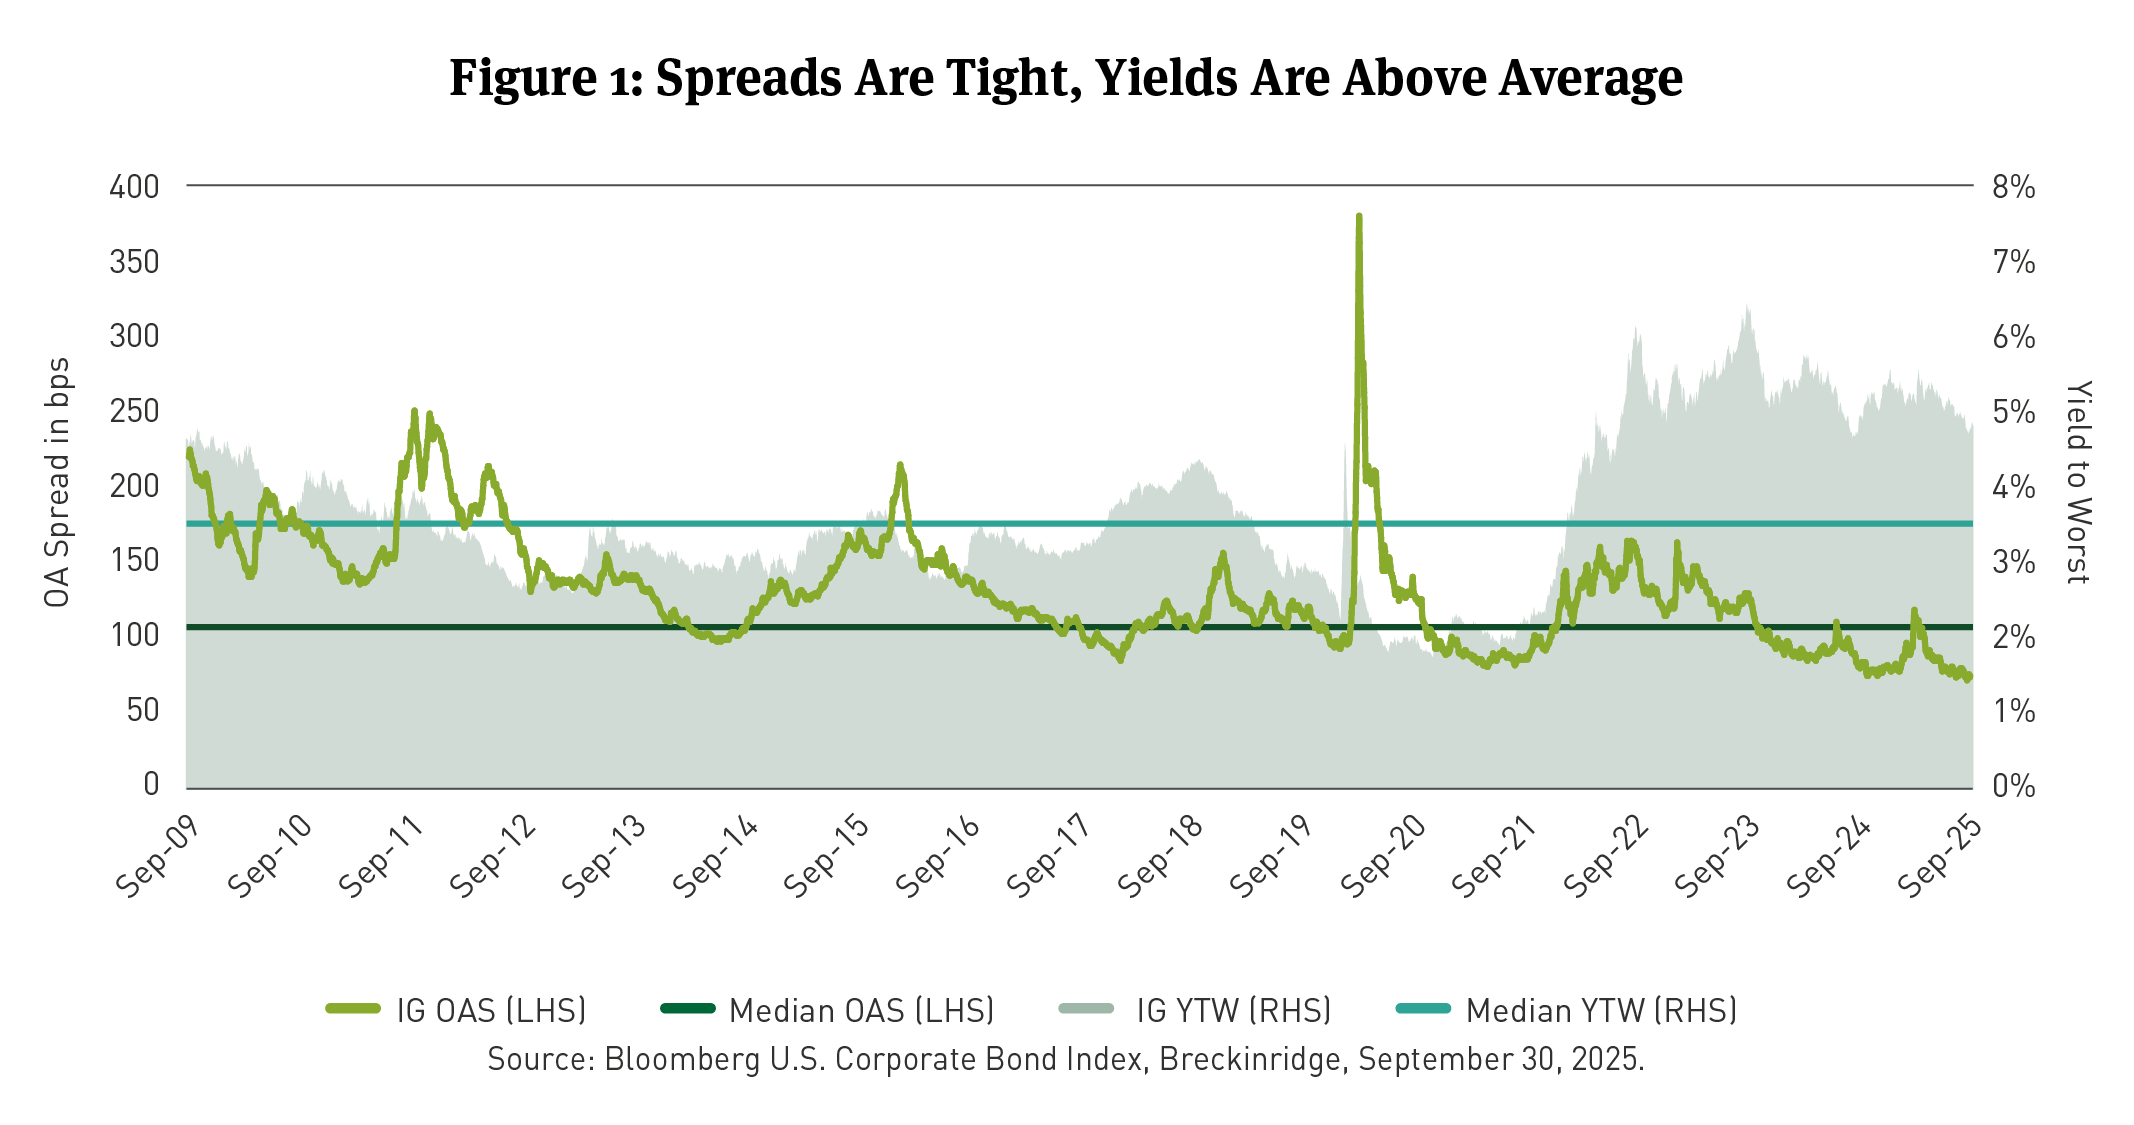
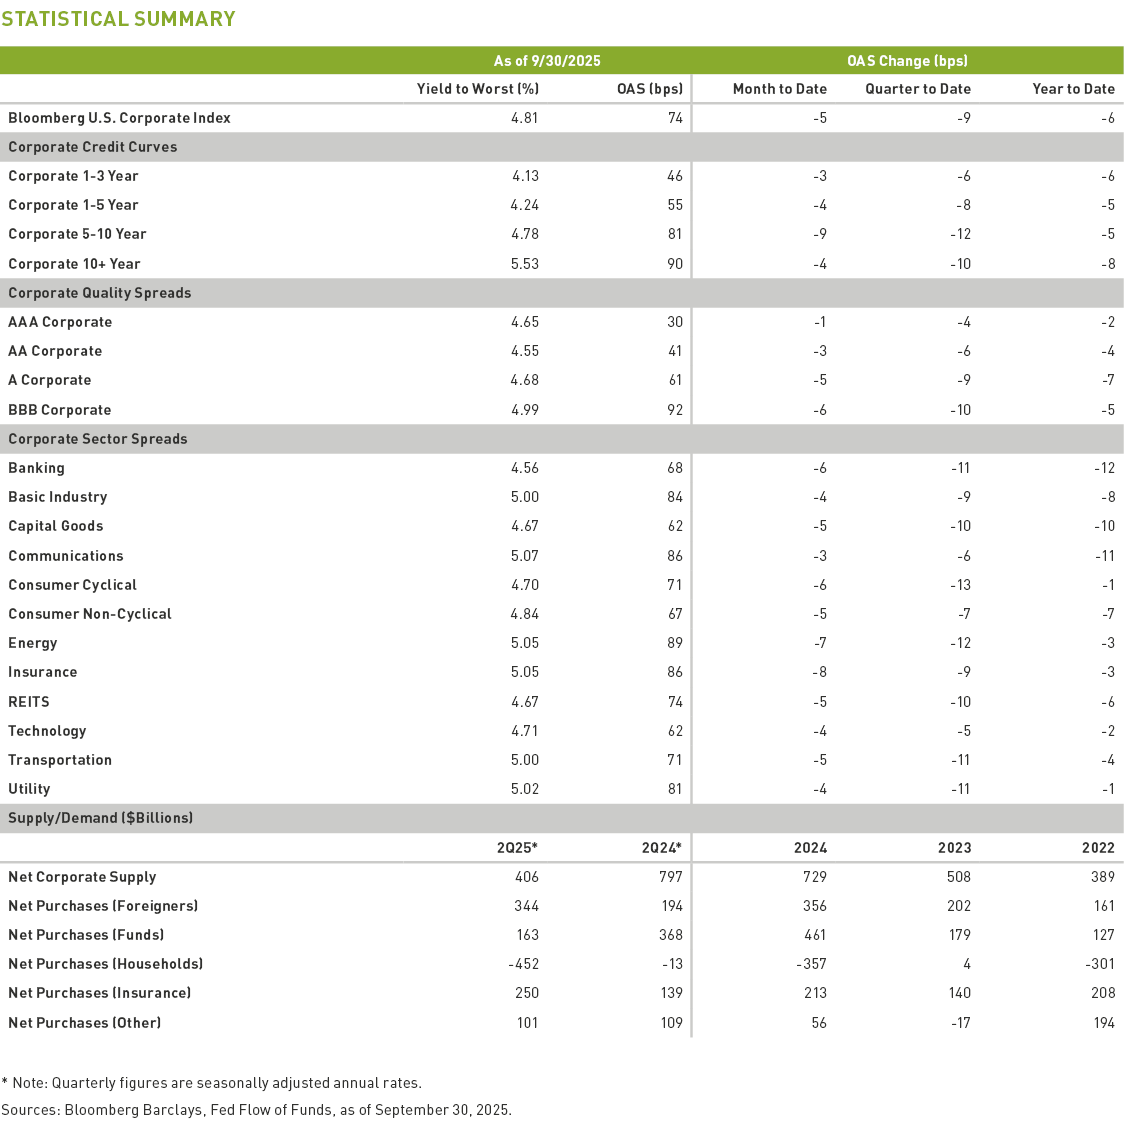
- Investment grade (IG) corporate bond spreads tightened by 9 basis points (bps), ending the third quarter at an option-adjusted spread (OAS) of 74bps. [1]
- While all-in yields are well above average, corporate spreads touched their tightest level in 15 years and traded in a 10bps range during the quarter. [2]
- The yield-to-worst (YTW) for the Index was 4.81 percent on September 30. An IG YTW in the 81st percentile, since 2009, may support investor demand. [3]
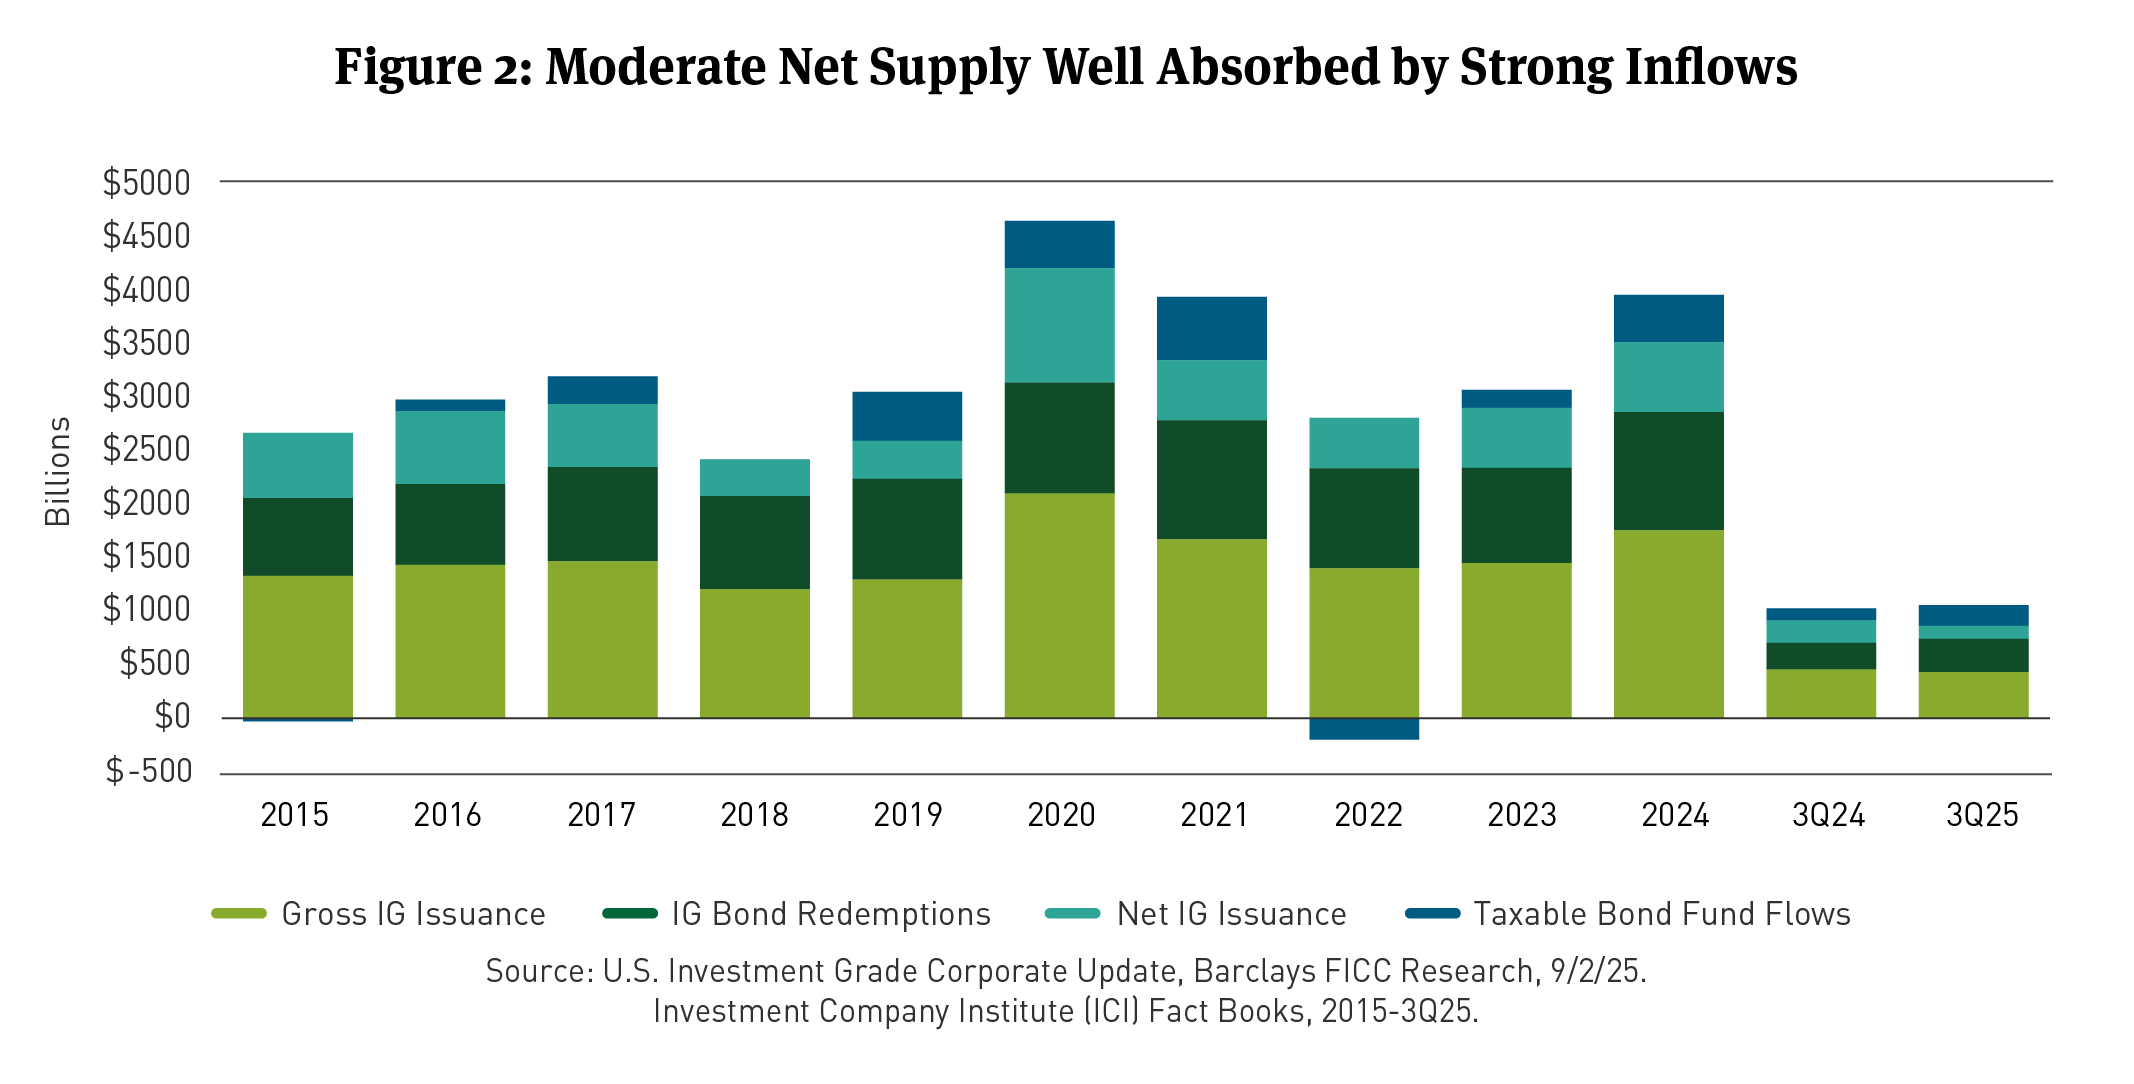
- IG gross bond supply was $433 billion in the third quarter, a decrease of 5 percent over the prior year. On a net basis, after elevated redemptions, issuance was $121 billion. [4]
- Inflows into taxable bond funds and exchange-traded funds (ETFs) were robust, at about $193 billion. [5] Foreign investor net corporate purchases were $92 billion for the three months through July. [6]
- Credit fundamentals are stable and have improved slightly with strong earnings. [7] But event risk has reemerged, with rising mergers and acquisitions (M&A) due to animal spirits [8] and deregulation.
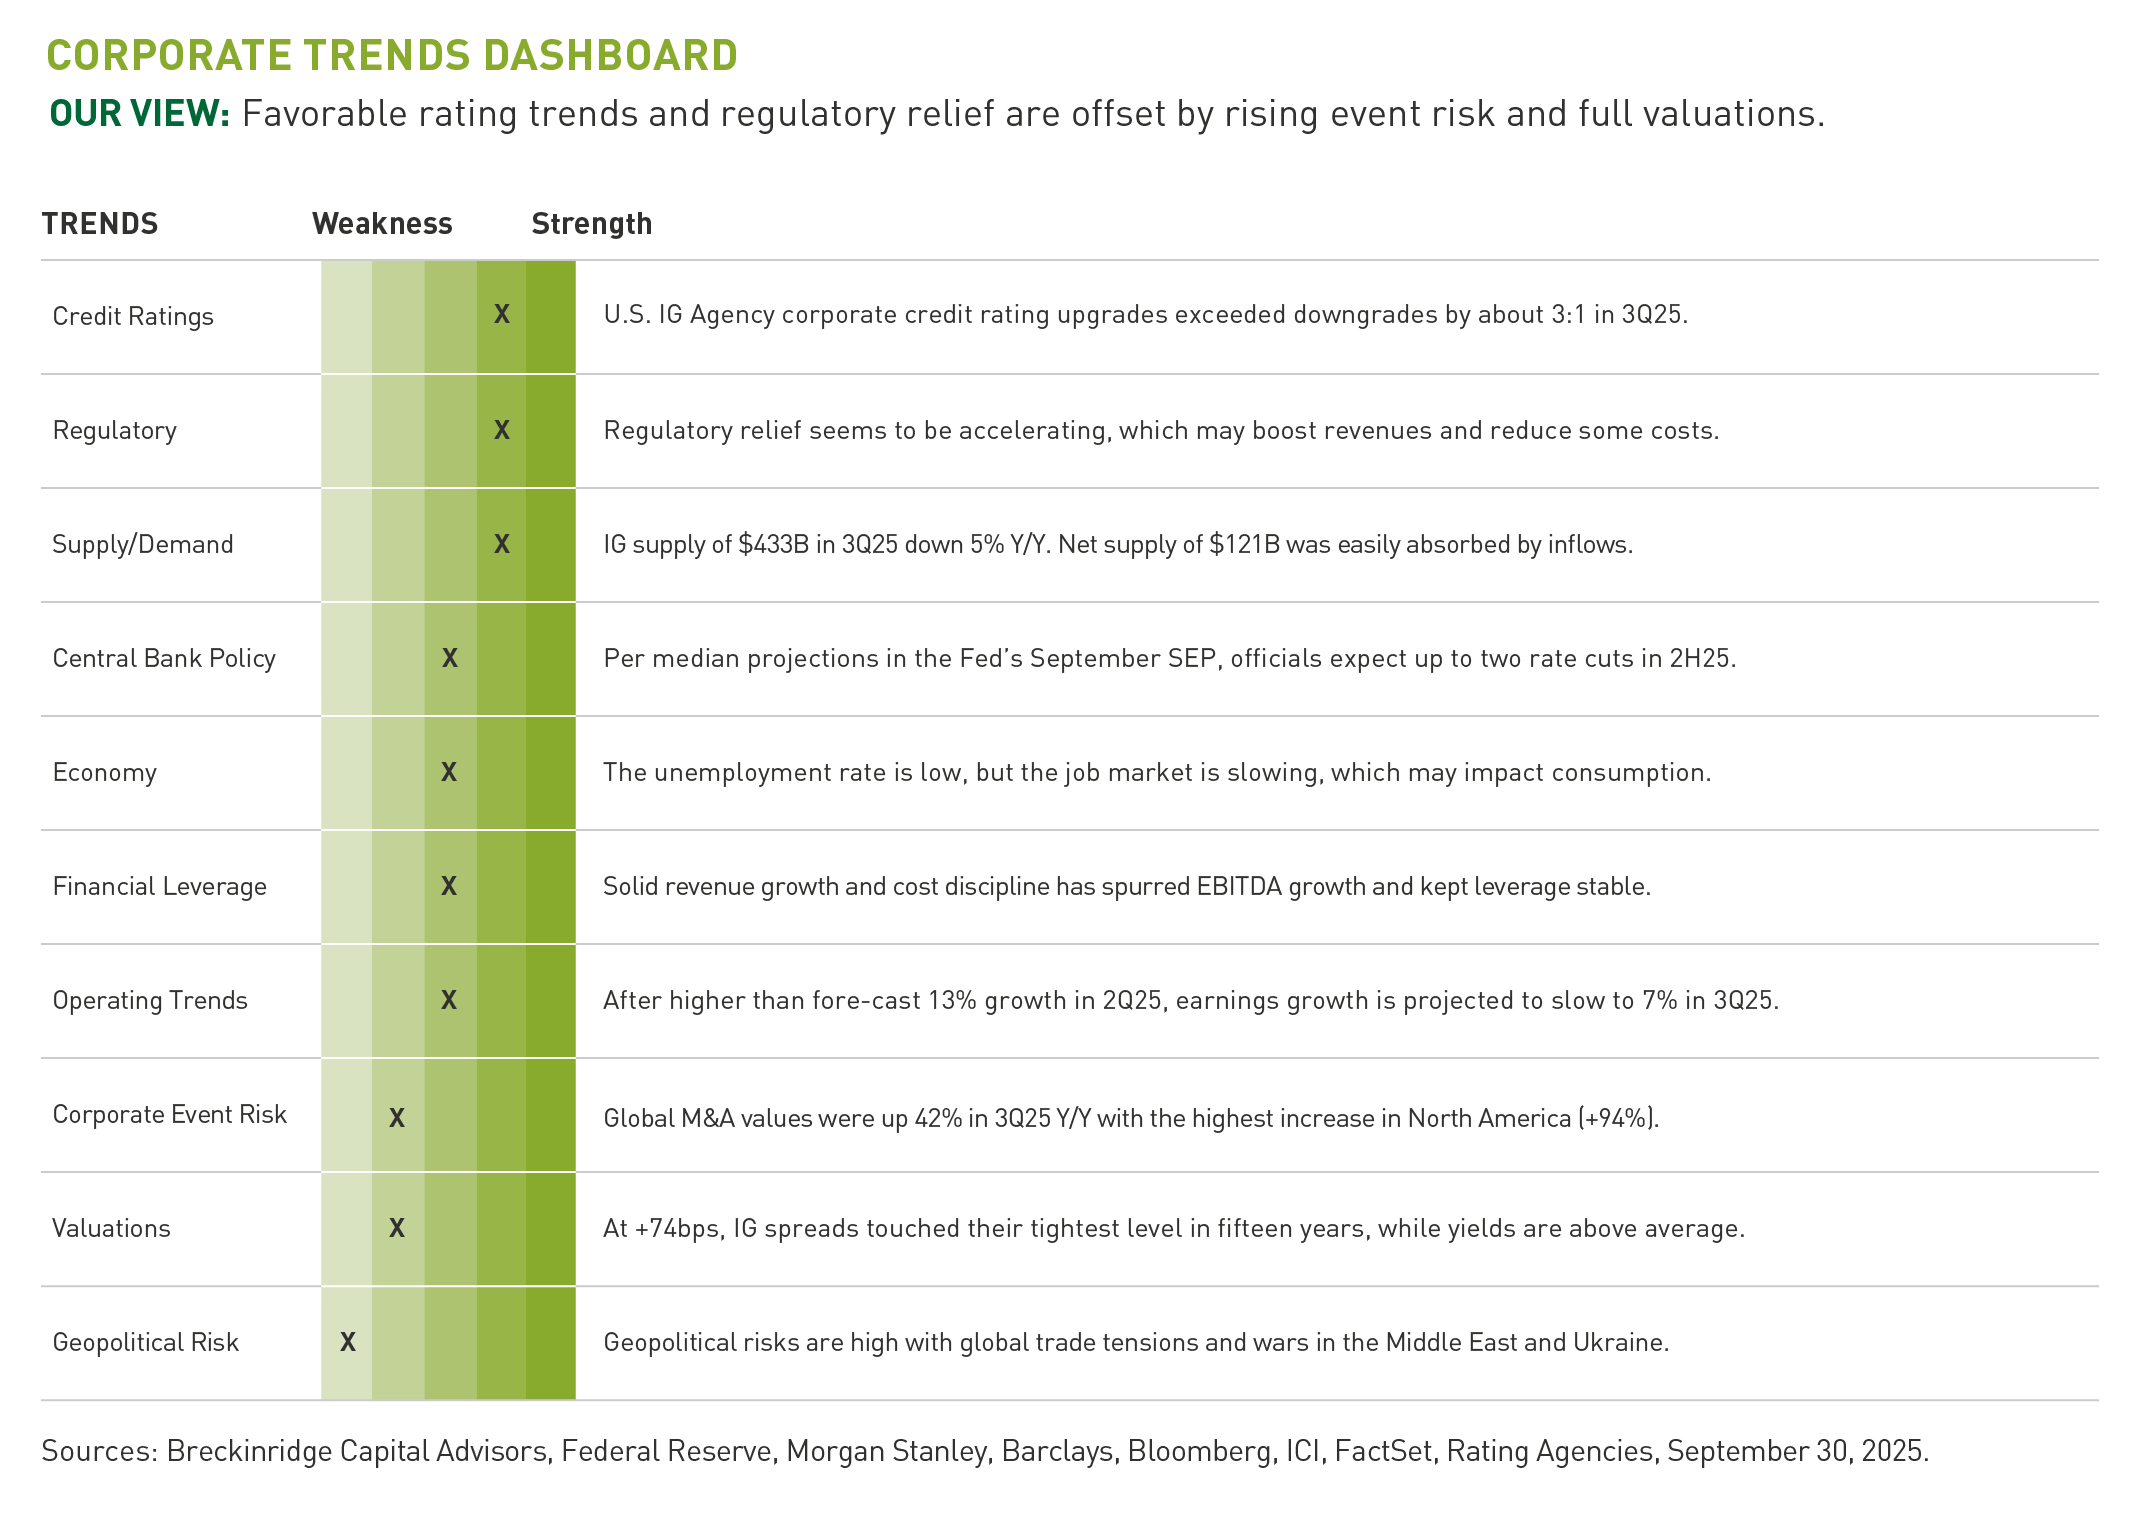
- Above-average yields, solid investor demand, and stable credit fundamentals are counterbalanced by tight spreads, rising event risk, and a slowing labor market driving a modest overweight to the corporate sector, with a defensive posture.
Investment Review and Outlook
Tight Spreads, Favorable Technicals, and Stable Fundamentals Drive a Modest Overweight
After periods of tariff-inspired volatility in the second quarter, the IG corporate bond market settled into a well-deserved summer break in the third quarter. The seasonal lull in supply was palpable with just $11 billion of net IG corporate issuance combined in July and August. During this period, spreads ground tighter, as steady fund inflows continued. Corporate spreads were 9bps tighter in the third quarter touching the narrowest level in 15 years. With well-above-average yields and a total return over 6 percent year-to-date(YTD)9, the IG market may continue to attract steady flows. Credit picking is still key, with our view that an environment of tariff-inspired slower growth with inflationary pressures may continue, driving dispersion in valuations and performance across corporate sectors and issuers.
It was a record September with $226 billion of new IG corporate bonds priced but even with that, net issuance ended the third quarter at a manageable $121 billion, solidifying the favorable technical backdrop. The Federal Reserve (Fed) rate cut in mid-September seemed to accelerate issuance and less restrictive monetary policy should encourage more borrowing. Credit markets, particularly IG, have seen spreads and yields pushed lower, as robust flows into fixed income continued to absorb new issue supply rather easily. Inflows into long-term, taxable bond funds and ETFs remained healthy at about $193 billion in 3Q25.10 Foreign investor corporate bond purchases were $92 billion for the three months through July, per Treasury International Capital (TIC) data.11 For the 12 months through July, 2025, net foreign purchases of corporate bonds were $309 billion, compared to $261 billion for the same period in 2025, indicating demand is strong and has risen.12 Foreign buying of corporates has been sticky over the last few years and has helped offset some of the variability in domestic fund flows.
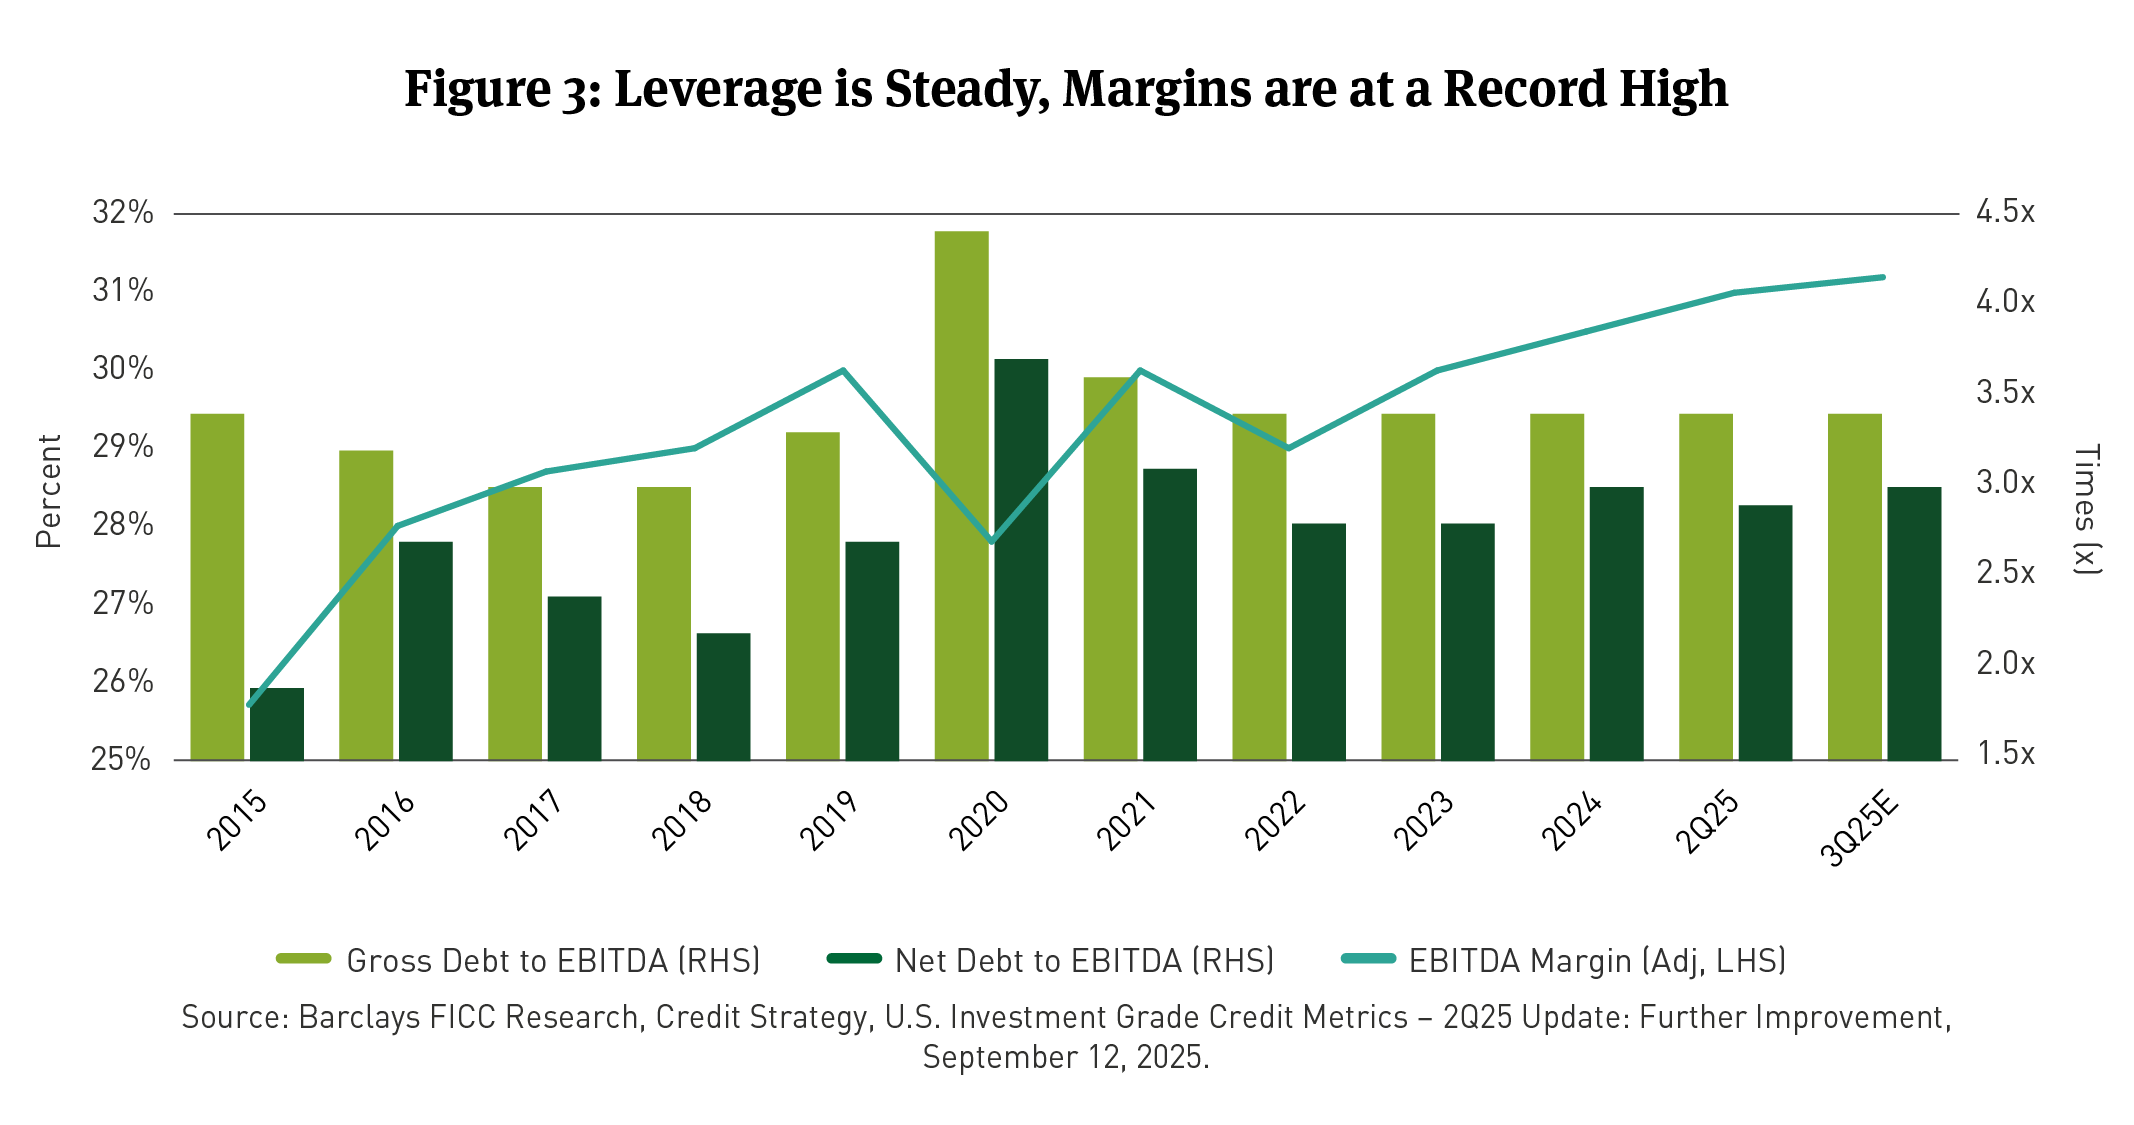
In our view, credit fundamentals are stable and have improved slightly with strong earnings in recent quarters. Solid revenue growth and cost discipline drove improvement in earnings before interest, taxes, depreciation and appreciation (EBITDA) margins and kept leverage stable. Event risk has re-emerged. Case-in-point; global M&A values were up 42 percent in 3Q25 year-over-year (Y/Y) with the highest increase in North America (94 percent).13 Animal spirits are making a comeback on deregulation, high equity valuations, and open credit markets. More highly leveraged M&A deals (e.g. leveraged buyouts (LBOs)) could be credit-negative, but this may be more of a 2026 story.
The Breckinridge Investment Committee’s (IC) base case is for sluggish job growth, tariffs driving sticky inflation measures, and moderating economic growth. Solid consumer spending, rising corporate capital expenditures, and elevated margins are partial offsets. Per median projections, in the Fed’s September Summary of Economic Projections (SEP), officials expect one or two rate cuts during the remainder of the year. Given our IC’s outlook for moderate growth, portfolio positioning is defensive with very tight valuations in most spread sectors, partially mitigated by attractive yields that continue to bring fund flows into the IG market.
Valuations
Corporate bond spreads were 9bps tighter in 3Q25 closing at an OAS of 74bps. Spreads touched the tightest level in 15 years during the quarter. Closing at 4.81 percent, the IG index yield compressed 19bps in the quarter, to 4.81 percent, but is still 139bps above the median IG yield over a 15-year lookback. This spread/yield conundrum reminds us of prior periods (1995-1997 and 2004-2006), with relatively high risk-free rates and tight spreads that lasted for a few years. This relationship can persist until a financial shock and/or a sharply weakening economy prompts a material drop in the fed funds rate and Treasury yields that correspond with a higher credit risk premium. Quality spreads have narrowed, with the gap between As and BBBs at 31bps for a Z-score14 of negative 1.8 compared to the average over the last five years.15
Technicals
IG gross supply was $433 billion in 3Q25, down 5 percent Y/Y. On a net basis after maturities, issuance was $121 billion. We think strong corporate bond issuance can continue. Lower interest rates should help drive incremental supply, with all-in yields near the lowest level in three years. At a record $226 billion, the deluge of supply in September speaks to pent-up demand for credit, with abnormally low net supply in recent months and continued strong flows from funds and foreign investors. Inflows into long-term, taxable bond funds and ETFs remained healthy at about $193 billion in 3Q25.16
Fundamentals
Credit fundamentals are stable and have improved slightly with strong earnings. In keeping with a consistent theme throughout the year, U.S. IG Agency corporate credit rating upgrades exceeded downgrades by about 3:1 in 3Q25.17 Solid revenue growth and cost discipline drove improvement in EBITDA margins and kept leverage stable. Regulators are softening their stance towards Banks. Congress recently passed a resolution to roll back the Office of the Comptroller of the Currency (OCC) merger review rule and the Federal Deposit Insurance Corporation (FDIC) rescinded a policy update meant to toughen merger scrutiny. Regulatory relief seems to be accelerating across certain sectors, which may boost revenues and reduce some costs.
[1] The Bloomberg U.S. Corporate IG Bond Index, Breckinridge, 9/30/25.
[2] Ibid.
[3] Ibid.
[4] Barclays FICC Research, U.S. Investment Grade Corporate Update, September 2, 2025.
[5] Investment Company Institute (ICI), Statistics, Combined Estimated Long-Term Flows and ETF Issuance, 9/30/25.
[6] U.S. Treasury International Capital Data for July 2025, September 18, 2025.
[7] Barclays FICC Research, Credit Strategy, U.S. Investment Grade Credit Metrics – Q2 25 Update: Further Improvement, 9/12/25.
[8] Coined by John Maynard Keynes in the 1930s to explain economic volatility, animal spirits are the instincts, emotions and psychological factors—such as confidence, fear and hope—that influence human economic decisions beyond rational calculation.
[9] Bloomberg U.S. Corporate IG Bond Index, YTD Total Return on this Index was 6.88 percent through 9/30/25.
[10] Investment Company Institute (ICI), Statistics, Combined Estimated Long-Term Flows and ETF Issuance, 9/30/25.
[11] U.S. Treasury International Capital Data for July 2025, September 18, 2025.
[12] Ibid.
[13] Bloomberg, Mergers & Acquisitions page, Captures Total Value of All Global and N.A. M&A, 3Q25, 9/30/25.
[14] A z-score is a statistical measurement that indicates how far away a data point is from the mean of a dataset, measured in terms of standard deviations. It essentially standardizes a raw score, allowing for comparisons between different datasets or populations.
[15] Bloomberg U.S. Corporate IG Bond Index, Breckinridge, September 30, 2025.
[16] Investment Company Institute (ICI), Statistics, Combined Estimated Long-Term Flows and ETF Issuance, 9/30/25.
[17] Bloomberg, Credit Ratings Trends page, U.S. Long-Term IG Rating Actions, Moody’s, S&P, Fitch, 3Q25, 9/30/25.
BCAI-10062025-tvhfy8qx (10/7/2025)
DISCLAIMERS:
The content is intended for investment professionals and institutional investors.
This material provides general information and should not be construed as a solicitation or offer of services or products or as legal, tax or investment advice. Nothing contained herein should be considered a guide to security selection, asset allocation or portfolio construction.
All information and opinions are current as of the dates indicated and are subject to change. Breckinridge believes the data provided by unaffiliated third parties to be reliable, but investors should conduct their own independent verification prior to use. Some economic and market conditions contained herein have been obtained from published sources and/or prepared by third parties, and in certain cases have not been updated through the date hereof.
There is no assurance that any estimate, target, projection, or forward-looking statement (collectively, “estimates”) included in this material will be accurate or prove to be profitable; actual results may differ substantially. Breckinridge estimates are based on Breckinridge’s research, analysis, and assumptions. Other events that were not considered in formulating such projections could occur and may significantly affect the outcome, returns or performance.
Not all securities or issuers mentioned represent holdings in client portfolios. Some securities have been provided for illustrative purposes only and should not be construed as investment recommendations. Any illustrative engagement or sustainability analysis examples are intended to demonstrate Breckinridge’s research and investment process.
Yields and other characteristics are metrics that can help investors in valuing a security, portfolio, or composite. Yields do not represent performance results, but they are one of several components that contribute to the return of a security, portfolio, or composite. Yields and other characteristics are presented gross of advisory fees.
All investments involve risk, including loss of principal. No investment or risk management strategy, including diversification, can guarantee positive results or risk elimination in any market.
Past performance is not indicative of future results. Breckinridge makes no assurances, warranties, or representations that any strategies described herein will meet their investment objectives or incur any profits. Performance results for Breckinridge’s investment strategies include the reinvestment of interest and any other earnings, but do not reflect any brokerage or trading costs a client would have paid. Results may not reflect the impact that any material market or economic factors would have had on the accounts during the time period. Due to differences in client restrictions, objectives, cash flows, and other such factors, individual client account performance may differ substantially from the performance presented.
Actual client advisory fees may differ from the advisory fee used to calculate net performance results. Client returns will be reduced by the advisory fees and any other expenses incurred in the management of their accounts. For example, an advisory fee of 1 percent compounded over a 10-year period would reduce a 10 percent return to a 9 percent annual return. Additional information on fees can be found in Breckinridge’s Form ADV Part 2A.
Index results are shown for illustrative purposes and do not represent the performance of any specific investment. Indices are unmanaged and investors cannot directly invest in them. They do not reflect any management, custody, transaction, or other expenses, and generally assume reinvestment of dividends, income, and capital gains. Performance of indices may be more or less volatile than any investment strategy.
There is no guarantee that the strategies or approaches discussed will achieve their objectives, lower volatility or be profitable. All investments involve risk, including loss of principal. Diversification cannot assure a profit or protect against loss. No investment or risk management strategy can guarantee positive results or risk elimination in any market.
Fixed income investments have varying degrees of credit risk, interest rate risk, default risk, and prepayment and extension risk. In general, bond prices rise when interest rates fall and vice versa.
Equity investments are volatile and can decline significantly in response to investor reception of the issuer, market, economic, industry, political, regulatory, or other conditions.
When integrating sustainability analysis with traditional financial analysis, Breckinridge’s investment team will consider material sustainability factors but may conclude that other attributes outweigh the sustainability considerations when making investment decisions.
There is no guarantee that integrating sustainability analyses will improve risk-adjusted returns, lower portfolio volatility over any specific time period, or outperform the broader market or other strategies that do not utilize these analyses when selecting investments. The consideration of sustainability factors may limit investment opportunities available to a portfolio. In addition, data for sustainable factors often lacks standardization, consistency, and transparency and for certain companies such data may not be available, complete, or accurate.
Breckinridge’s sustainability analysis is based on third party data and Breckinridge analysts’ internal analysis. Analysts will review a variety of sources such as corporate sustainability reports, data subscriptions, and research reports to obtain available metrics for internally developed frameworks. A high sustainability rating does not mean it will be included in a portfolio, nor does it mean that a bond will provide profits or avoid losses.
Investments in thematic customizations will subject the portfolio to proportionately higher risk exposure of any sectors or regions in which the investments target. In addition, the investments held in thematic customizations may not meet the desired positive impact or become subject to negative publicity; these types of events may cause the customizations to have poor performance due to the concentration of assets. There is no assurance that the customizations or the strategies will meet their objectives.
BLOOMBERG® is a trademark and service mark of Bloomberg Finance L.P. and its affiliates (collectively “Bloomberg”). Bloomberg does not approve or endorse this material or guarantees the accuracy or completeness of any information herein, or makes any warranty, express or implied, as to the results to be obtained therefrom and, to the maximum extent allowed by law, neither shall have any liability or responsibility for injury or damages arising in connection therewith.

