Corporate
Commentary published on January 6, 2026
Q1 2026 Corporate Bond Market Outlook
Summary
- The Bloomberg (BBG) U.S. Investment Grade (IG) Corporate Bond Index [1] (the Index) generated a total return of 7.77 percent for 2025.
- Spreads touched their tightest level in 20 years. [2] We expect modest spread widening in 2026, and full valuations argue for a defensive stance.
- We see stable credit fundamentals for Industrials in 2026, supported by solid revenue growth and cost discipline, buoying margins, and earnings. [3]
- Rising cap ex and mergers and acquisitions may strain credit metrics if debt funding is used prodigiously. Idiosyncratic events in sub-prime and private credit are risks. [4]
Investment Review and Outlook
IG Credit Looks Poised for Another Year of Attractive Total Returns
As we enter 2026, we are of the view that the next 12 months may be more about total return and less about excess return. In 2025, the corporate market delivered positive excess returns for a third year in a row.5 Favorable coupon income, price appreciation, and modest spread tightening drove the total return on IG corporate credit north of 7.5 percent.6 With potentially range-bound Treasuries and slightly wider spreads, we do not expect a comparable price return in 2026. But we view the income proposition for IG credit as attractive, with a coupon return near 5-percent.
Inflows were nearly half a trillion dollars into taxable bond funds in 2025.7 Foreign investor net corporate bond purchases were one-third of a trillion dollars for the 12 months through October.8 The domestic Insurance sector continues to be a steady source of demand.9 Favorable risk-adjusted performance over the last 12 months may continue to attract steady fund flows into IG corporates. Investor demand will need to remain robust if peak estimates for new issuance come to fruition in 2026. Should markets remain amendable, 2026 gross supply may reach a record at north of $2 trillion.10
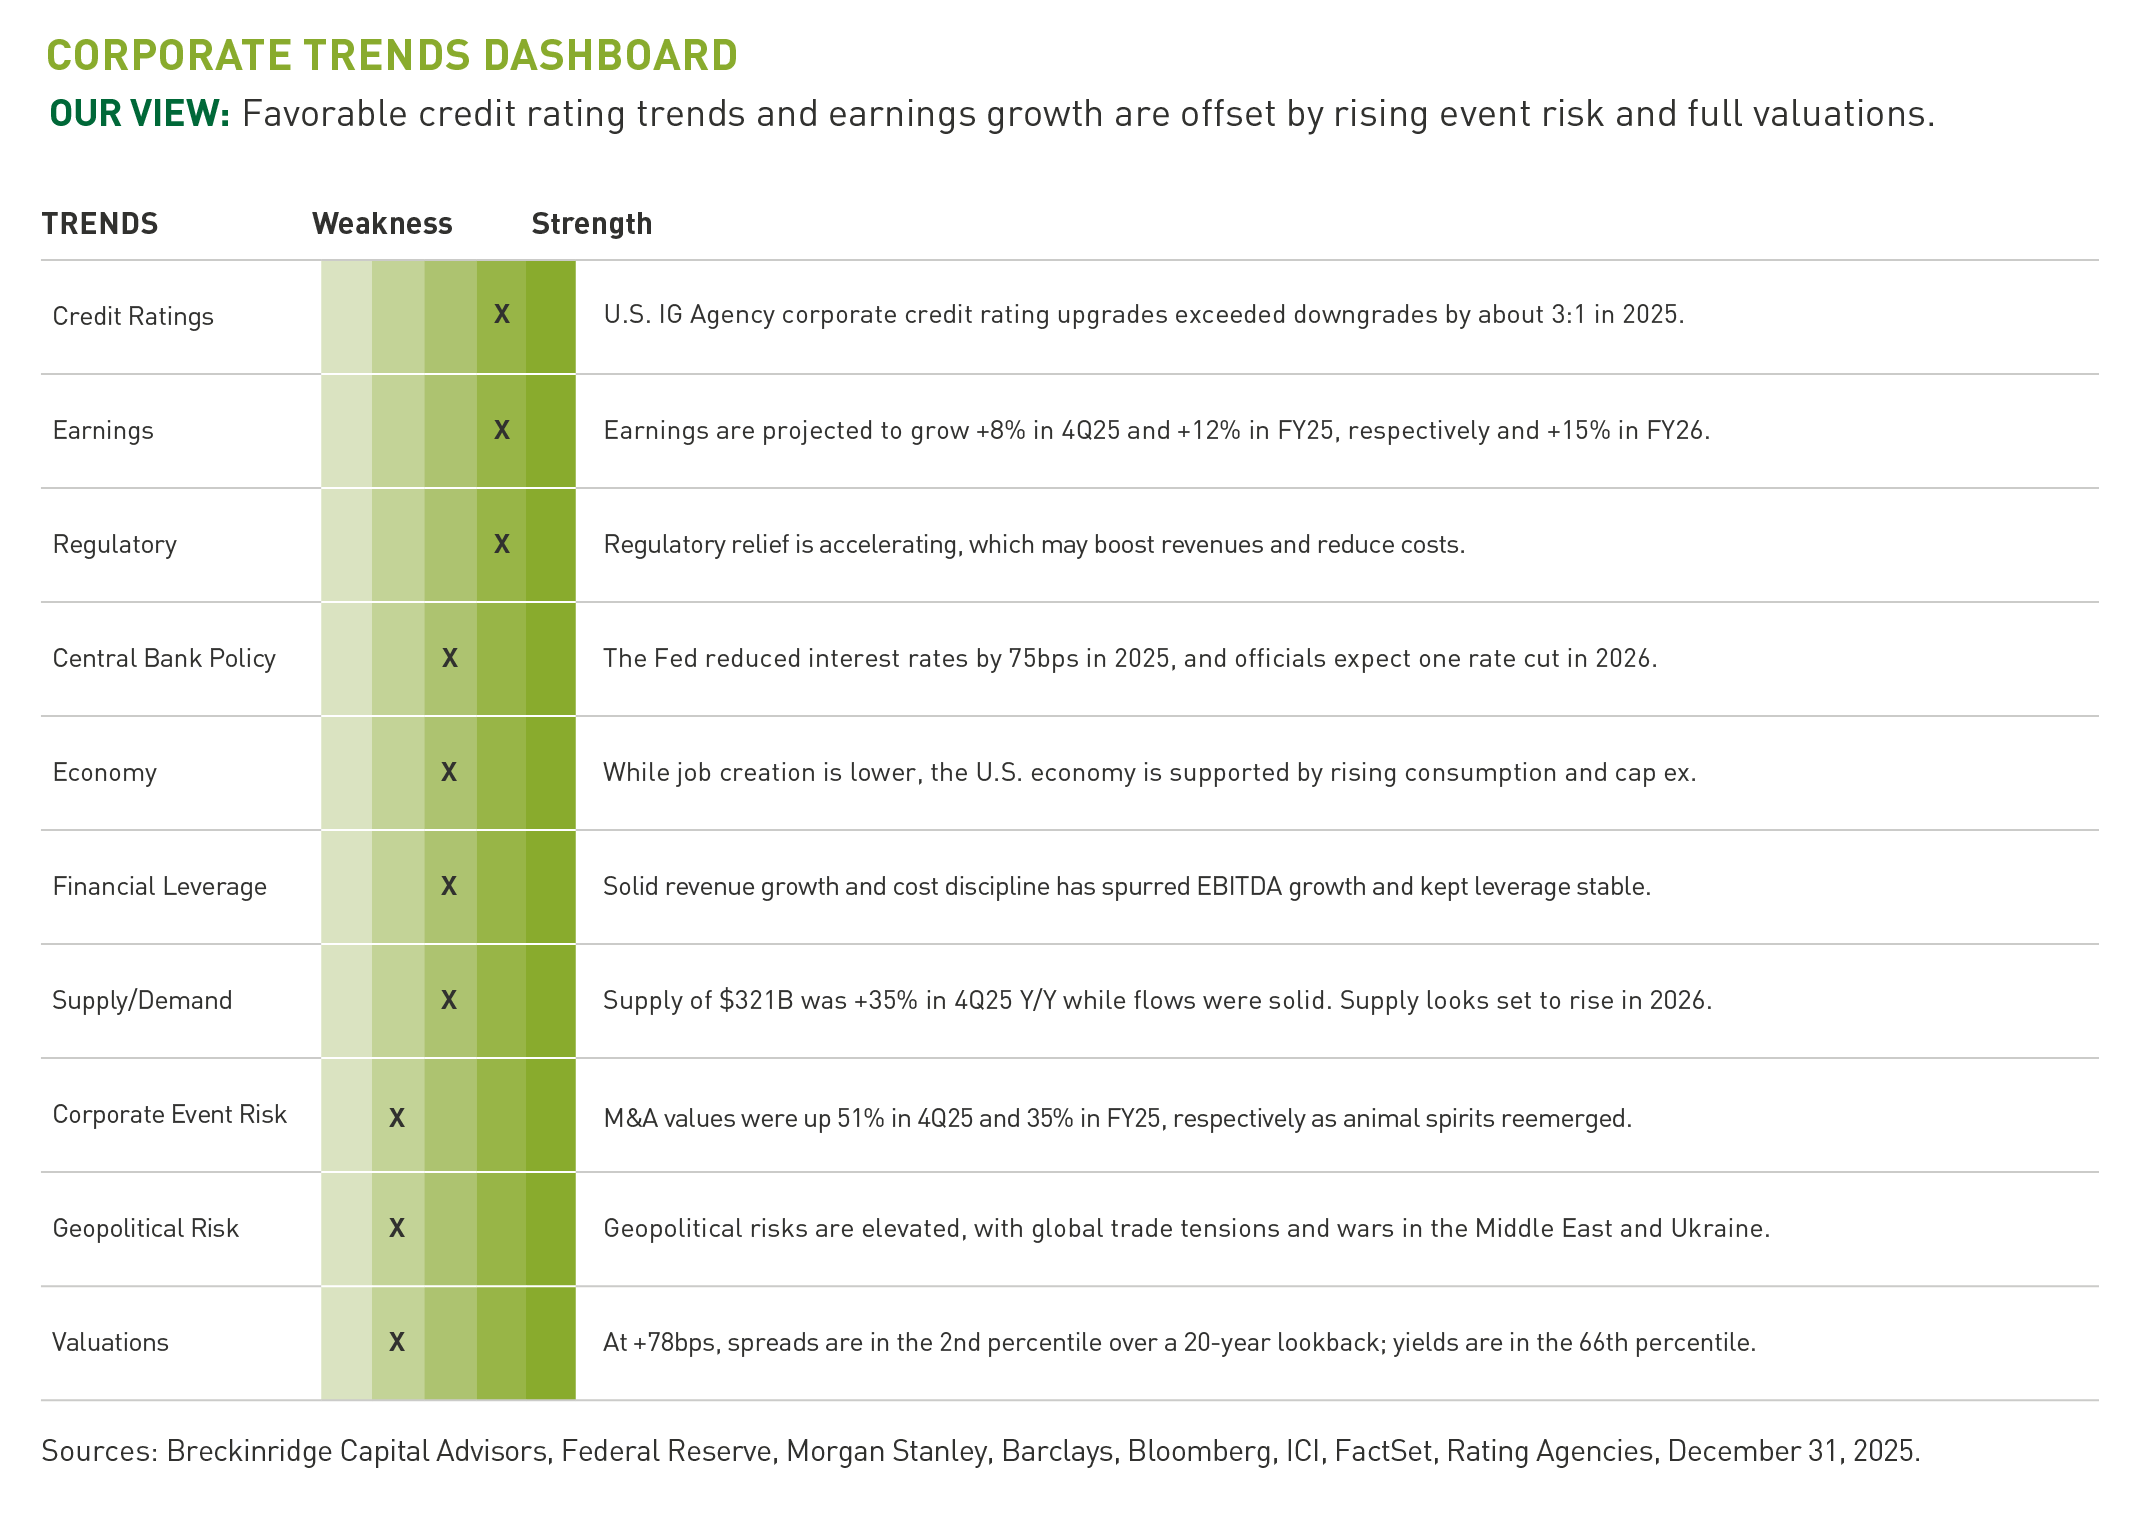
We expect stable credit fundamentals in 2026. Agency rating actions have continued with positive bias.11 Credit is supported by solid revenue growth and cost discipline, driving margin improvement and steady debt metrics. However, mergers and acquisitions (M&A) and capital expenditures (cap ex) are each rising notably and may strain credit metrics if debt funding is used prodigiously. Idiosyncratic events in sub-prime and private credit are risks.
Our macro-outlook for 2026 is for moderate real economic growth. Growth has been driven by spending from high income households and a boost in productivity from AI related cap ex. The Breckinridge Investment Committee anticipates one additional rate cut in 2026, with the 10-year Treasury yield expected to trade between 4.0 percent and 4.5 percent. Payroll growth slowed down in the fourth quarter of 2025, and the Federal Reserve’s (Fed’s) view is clear that the labor market has softened sufficiently to warrant additional monetary accommodation to stimulate demand.
We see tactical opportunities in short--to-intermediate-term corporates on reasonable credit curves and breakeven spreads.12 We expect more 30-year issuance, which may present opportunities. Relative value should emerge across capital structures in Banks, Insurers, and Utilities as these sectors may see an increase in hybrid capital supply. Above-average yields, steady investor demand, and stable credit fundamentals are counterbalanced by tight spreads, rising new issue supply, cap ex, and M&A, driving a modest overweight to the corporate sector with a defensive posture.
Valuations: Sector Dispersion and Opportunities
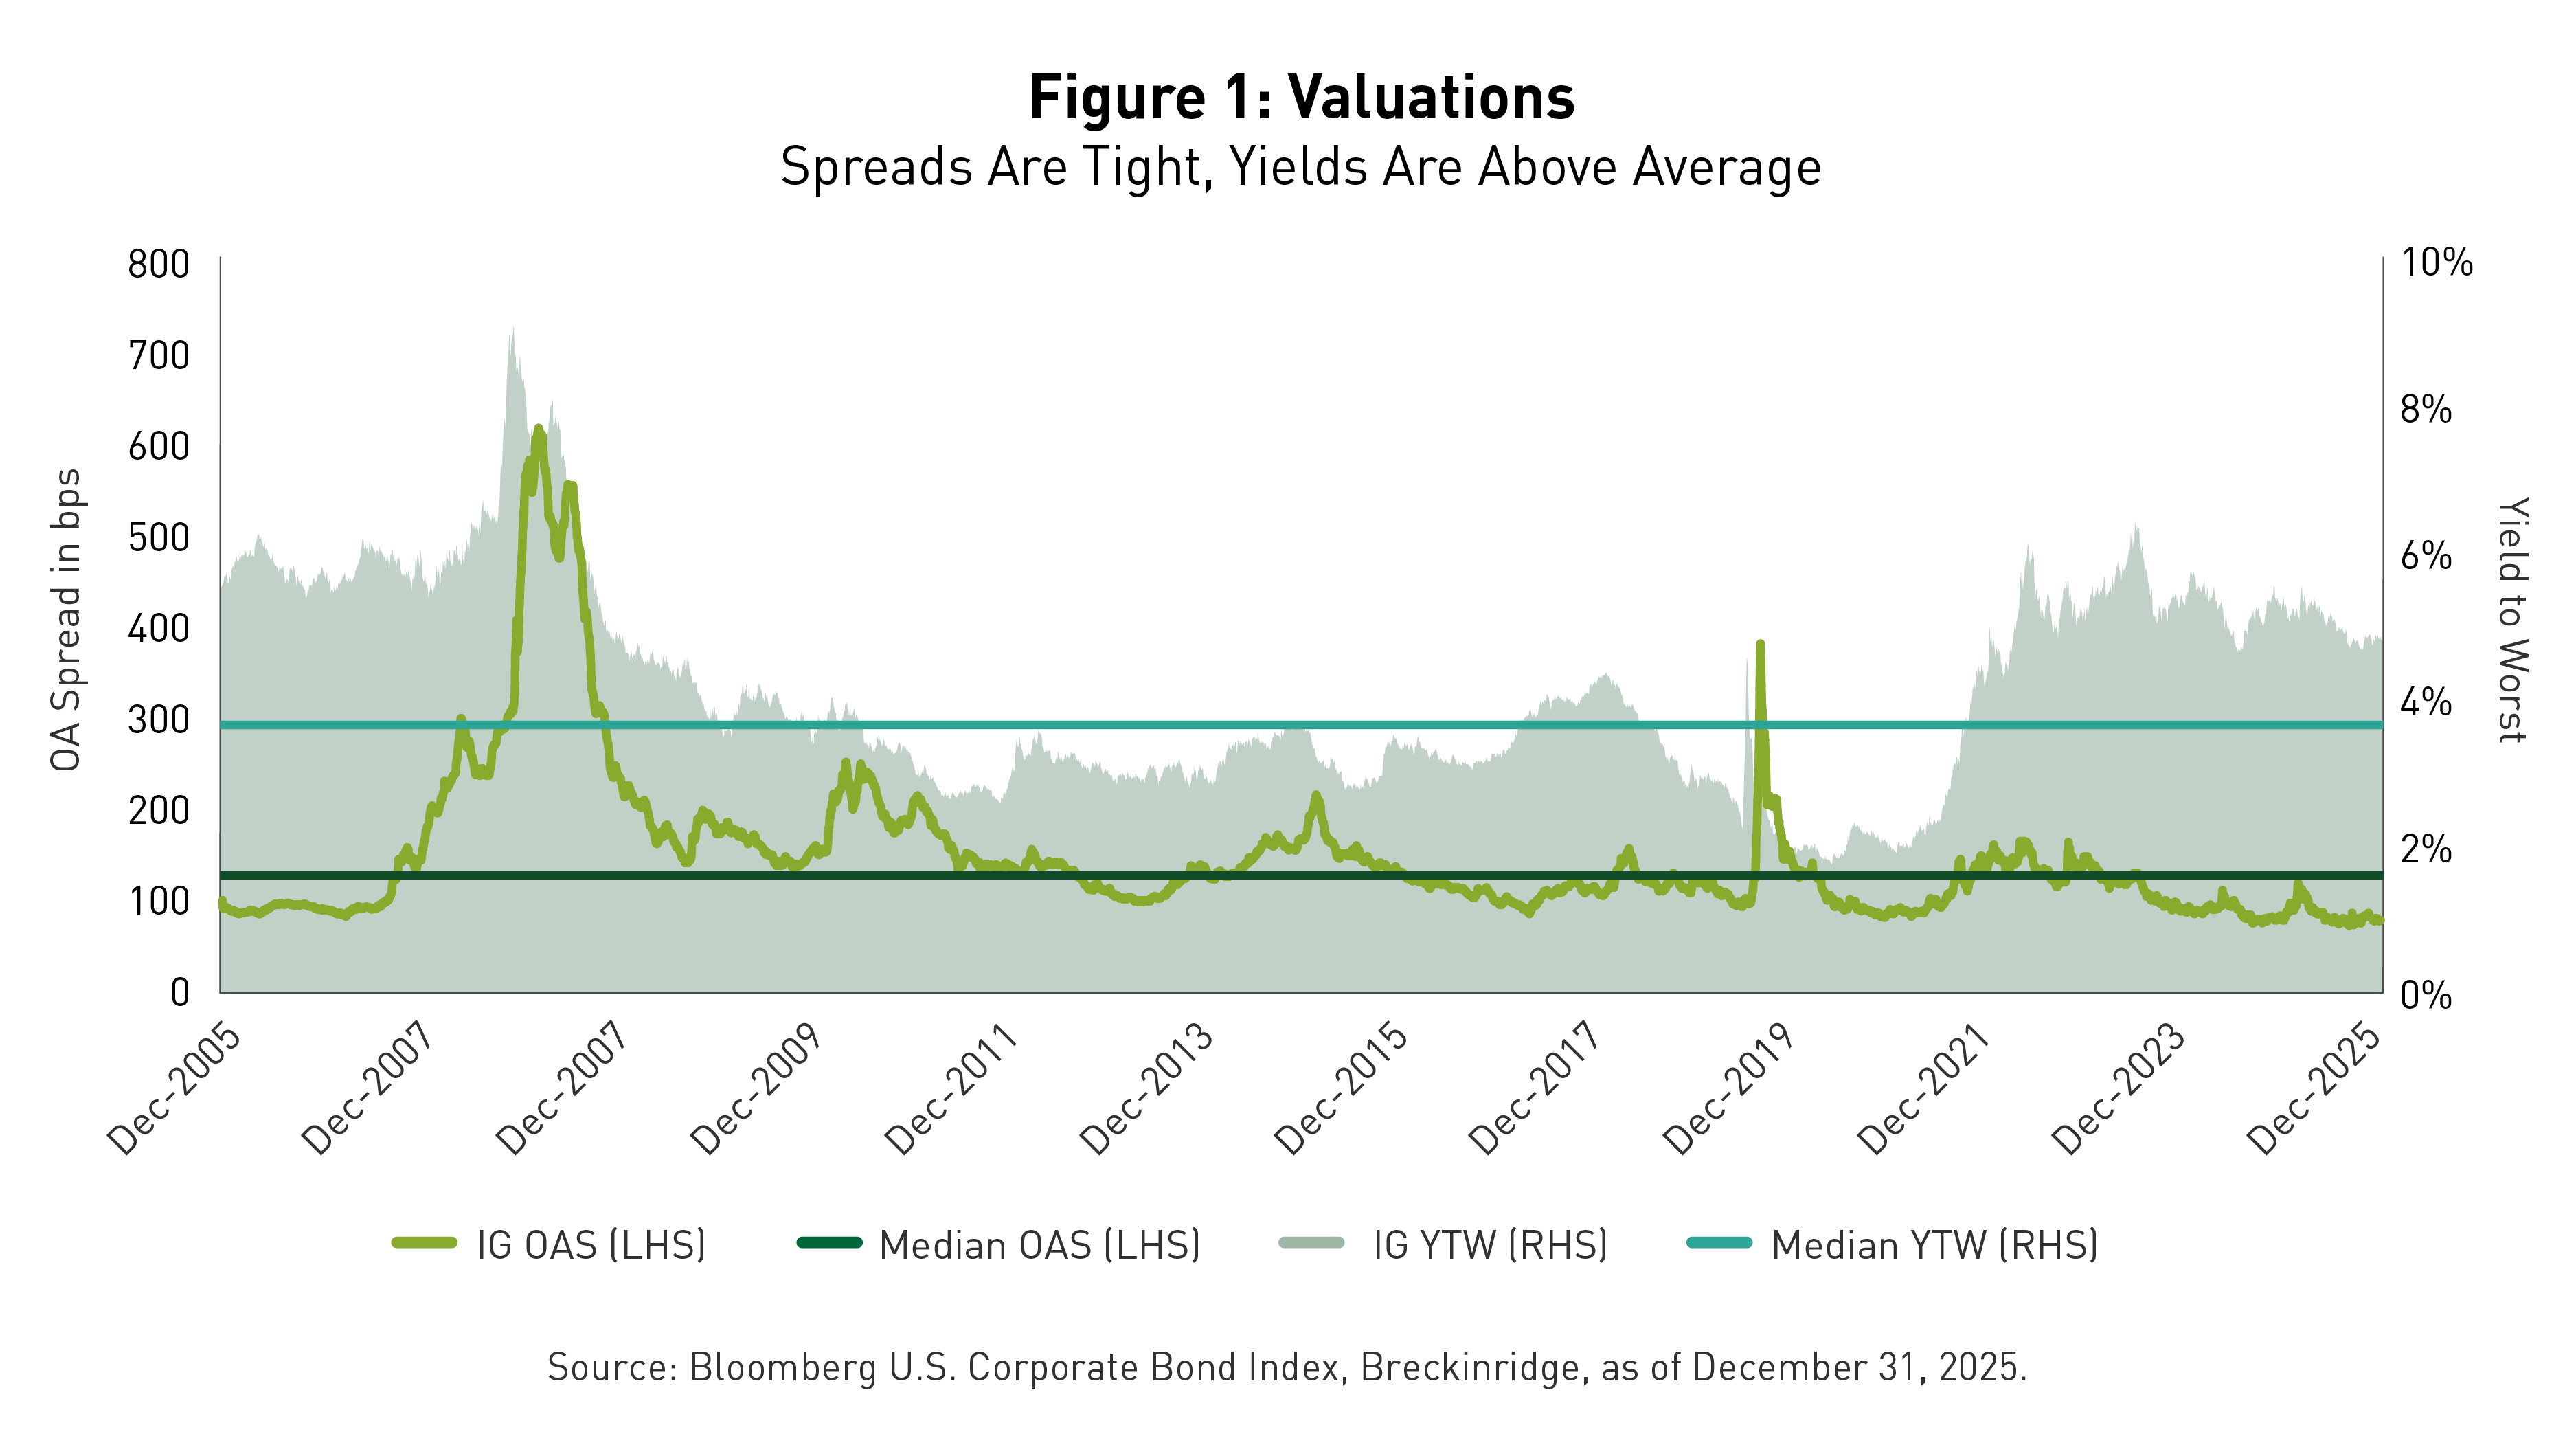
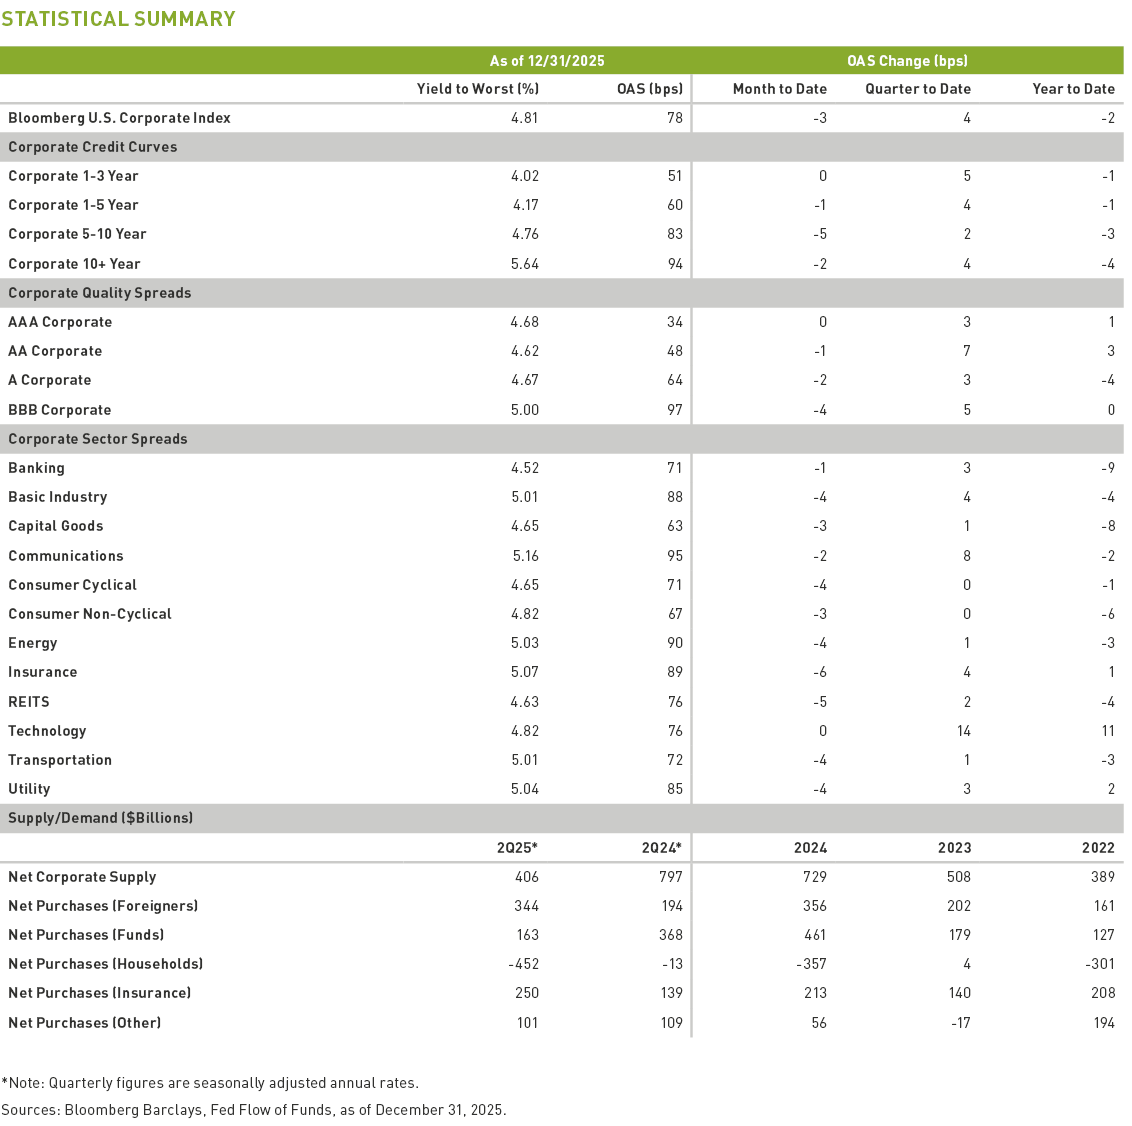
IG corporate bond spreads, as measured by the Index, tightened by two basis points (bps) during the year, ending the fourth quarter at an option-adjusted spread (OAS) of 78bps.13 Spreads are rich, in the 2nd percentile over a 20-year lookback. Compressed valuations argue for a defensive stance entering 2026. The yield-to-worst (YTW) for the Index was 4.81 percent on December 31st. An IG YTW in the 66th percentile, since 2005, may support investor demand via domestic and foreign funds flows.14
Long corporates (-4bps) modestly outperformed intermediate corporates (-2bps) on a spread basis, as credit curves flattened slightly. There was dispersion across industries, with tighter spreads in sectors such as Healthcare (-13bps), Banking (-9bps) and Capital Goods (-8bps), partially offset by wider spreads in Finance (+30bps), Technology (+11bps), and Utilities (+2bps) for the full year.
Quality spreads widened slightly during the year, with the A Index (+64bps) 4bps tighter and the BBB Index (+97bps) unchanged on the year. The spread differential of 33bps is tight relative to recent history with a Z-Score15 of negative 1.5 compared to the average over the last five years.16 The spread/yield conundrum reminds us of prior periods (1995-1997 and 2004-2006), with relatively high risk-free rates and tight spreads that lasted for a few years. This relationship can persist until a financial shock and/or a sharply weakening economy prompts a material drop in the fed funds rate and Treasury yields that correspond with a higher credit risk premium.
Technicals: Supply Rising, Demand Still Deep
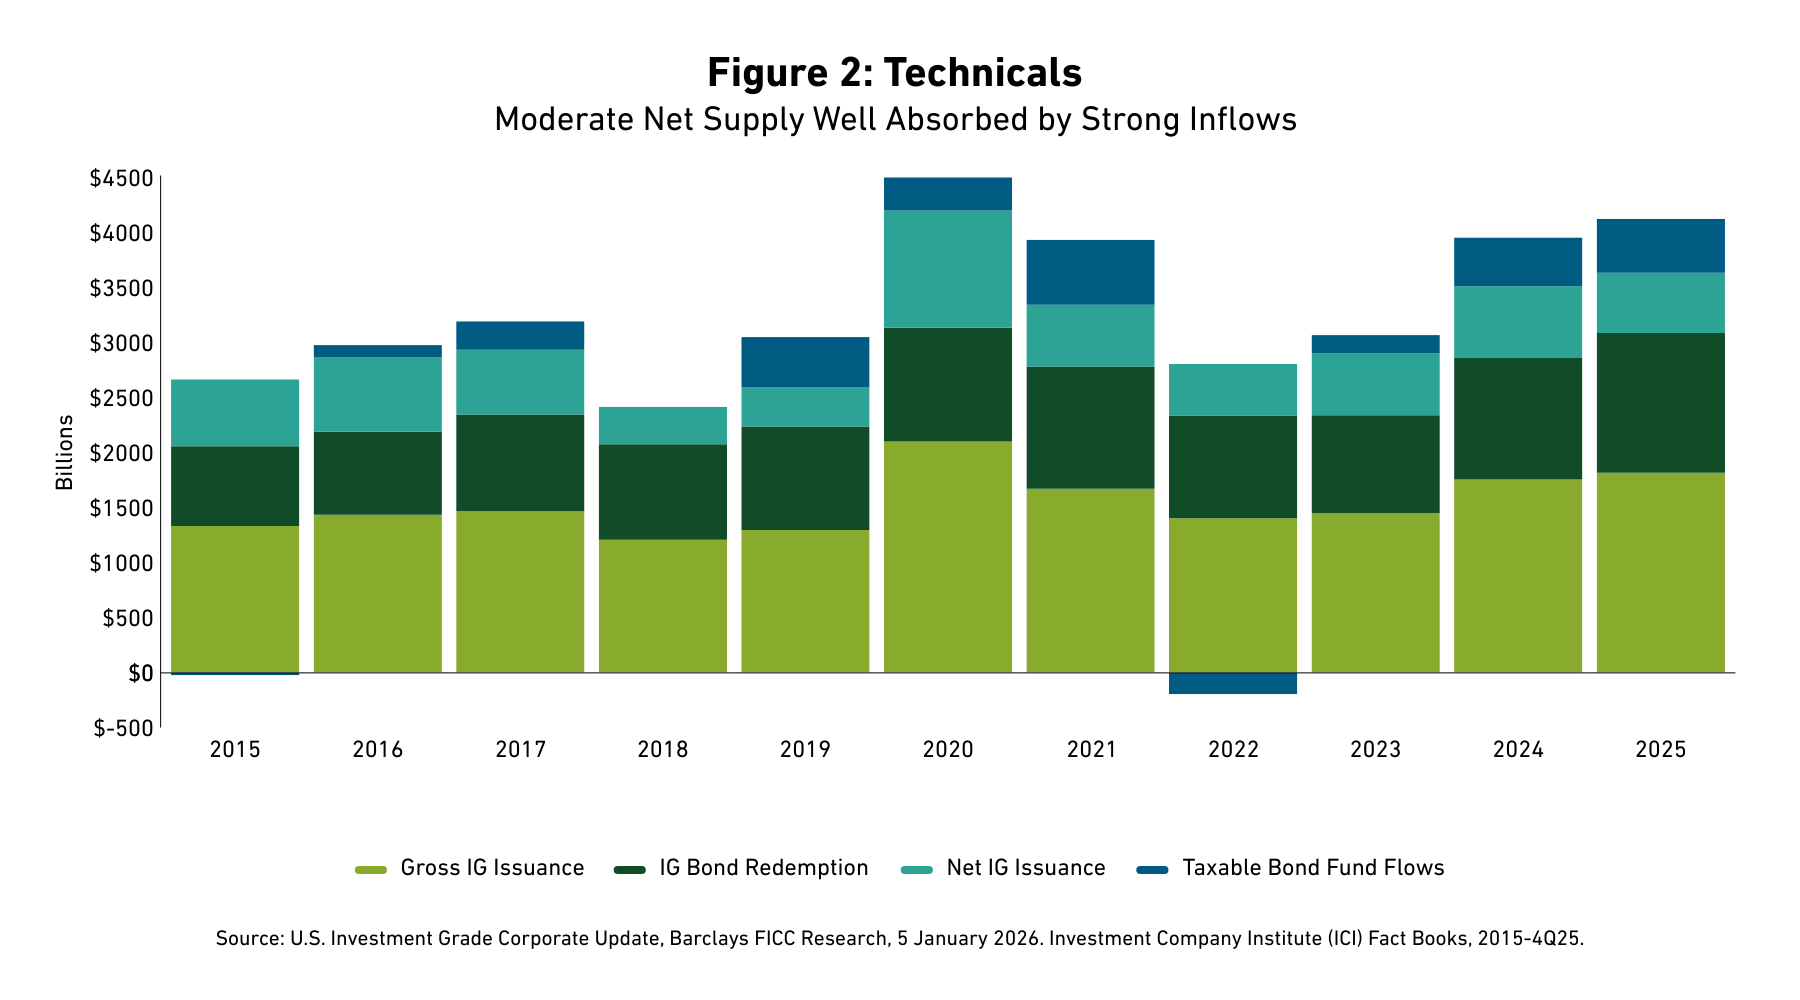
Entering 2026, we think bond supply may accelerate on rising cap ex and M&A activity. IG gross bond supply was $321 billion in the fourth quarter, and $1.82 trillion in 2025. On a net basis, after redemptions, issuance was $86 billion and $548 billion, respectively.17
We expect to see more supply in longer-maturity corporate bonds this year, which may present opportunities, particularly for yield-oriented buyers. One investment bank is estimating gross and net issuance of $2.25 trillion and $1.0 trillion in 2026, respectively, which would eclipse the previous gross record of $2.1 trillion in 2020.18
We think fund flows can remain healthy while IG supply may accelerate on rising cap ex and M&A activity. Inflows into taxable bond funds and exchange-traded funds (ETFs) were $156 billion in the fourth quarter and $490 billion in 2025.19 Foreign investor net corporate purchases were $83 billion for the three months and $304 billion for the 12 months through October.20
On the supply side, we expect large issuance from the Technology and Utility sectors to be somewhat counterbalanced by less supply from the Banking sector.
Utilities may also materially increase their borrowing in the corporate bond market in 2026. Utility cap ex grew from $104 billion in 2015 to $208 billion in 2025 and may reach $248 billion in 2029.21 Cap ex will bring a wave of new debt issuance.22
In the fourth quarter, U.S. Bank regulators issued a final rule to modify certain regulatory capital standards including changes to the Supplementary Leverage Ratio (SLR) that will likely reduce holding company long-term debt (LTD) issuance needs.23 These regulatory changes could reduce external LTD requirement by over $150 billion and Total Loss Absorbing Capital (TLAC) needs by nearly $100 billion.24 Higher surplus LTD suggests reduced refinancing and U.S. Bank net supply may be sharply lower, potentially down 40 percent in 2026.25 We view lower supply as a supportive technical for Bank bond spreads.
Fundamentals: Stable, With Pockets to Watch
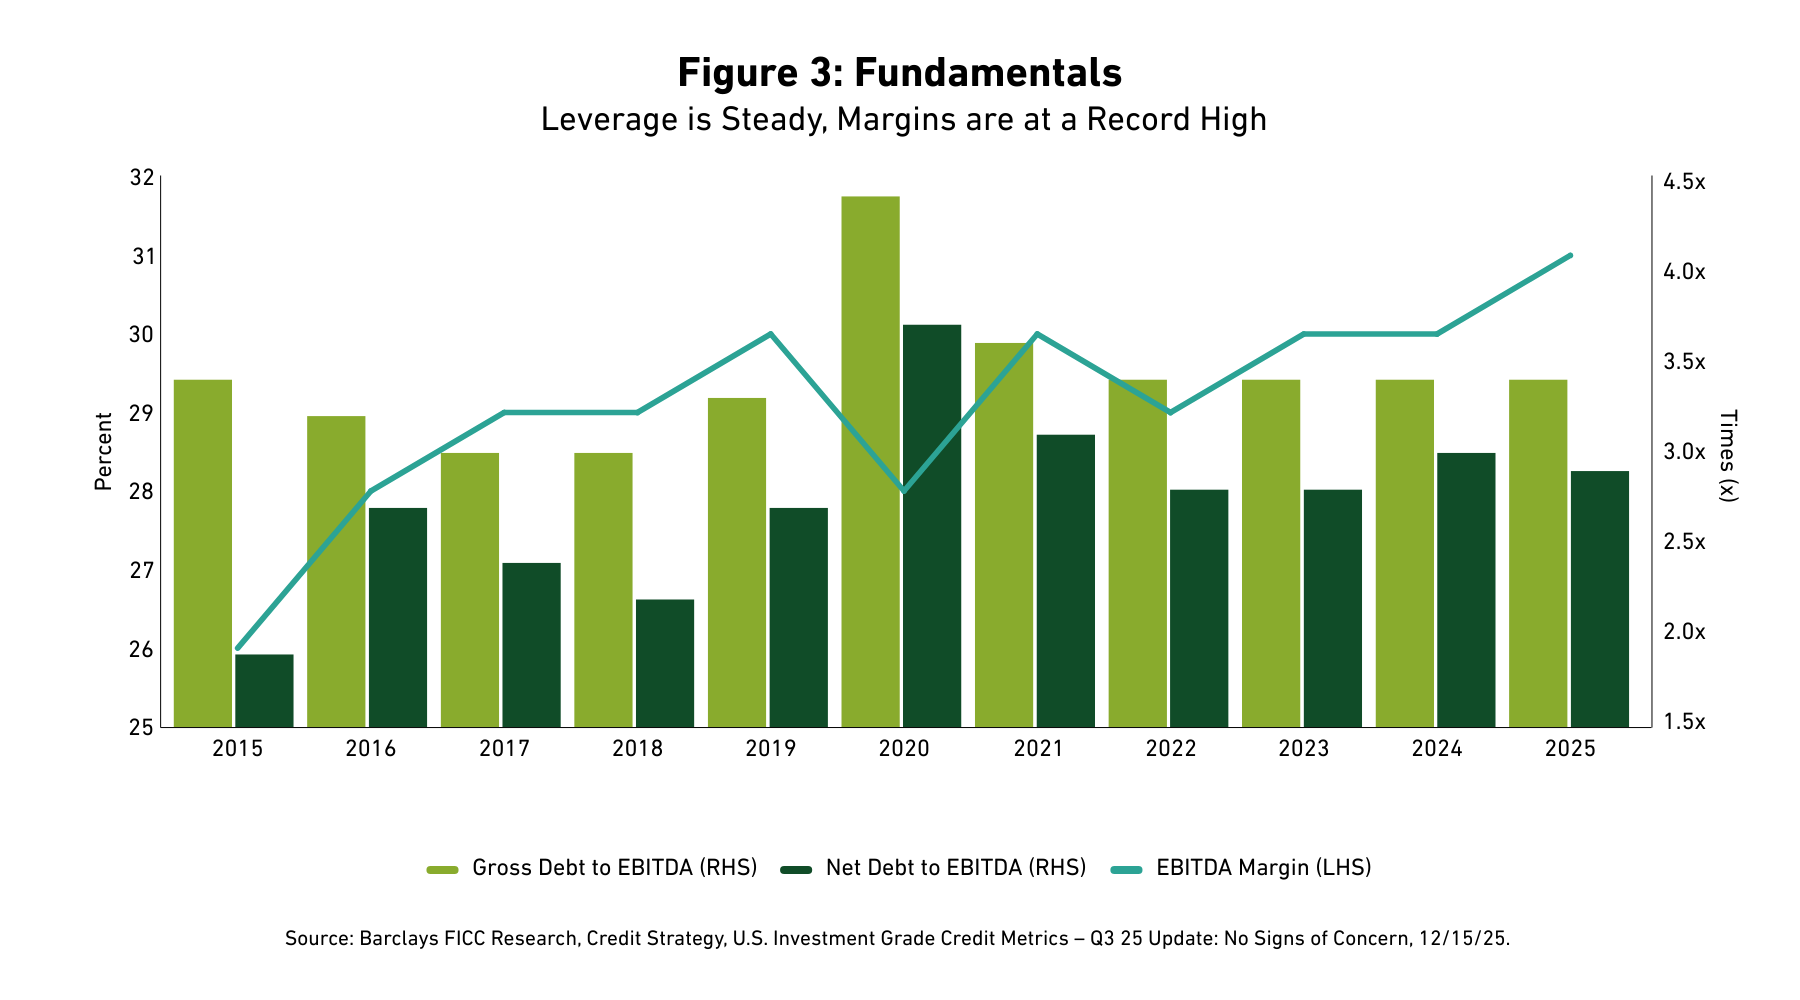
We see stable credit fundamentals for Industrials in 2026. Non-financial credit metrics were stable in the last quarter and indeed over the past few years.26 Credit is supported by solid revenue growth and cost discipline, which are driving margin improvement and steady debt metrics.
Net leverage was flat for the Index, at about 2.9 times. Sectors with the biggest increase in net leverage on a year-over-year (Y/Y) basis included Basic Industries (+0.5x), and the biggest reduction in net leverage on a Y/Y basis included Communications (-0.3x) and Consumer Non-Cyclical (-0.2x).27
Industrials margins continued their steady march higher and corporate investments in artificial intelligence (AI) may drive additional costs savings and productivity. Forecasts for solid growth in operating earnings suggest a constructive backdrop in credit.28 Agency credit rating actions continued to have a positive bias in 2025 and that may continue.29 Cap ex and M&A are rising and may strain metrics if heavily debt funded.30 Not surprisingly, there is divergence across sectors.
Bank fundamental credit looks stable. Merger activity may be supportive of credit, given equity funding, and M&A among regional banks. Regulatory capital relief may allow for greater loan growth and more profitable lending activities. Idiosyncratic events in sub-prime, private credit, and bank exposure to non-depository financial institutions (NDFI’s) are risks.31 We expect large issuance in the Tech sector to fund data center buildouts. Some deals may present opportunities given how highly rated these credits are. We expect Utilities to maintain current credit ratings driven by rate increases, increased equity funding in the form of common and hybrid issuance, and asset sales.32
[1] The BBG U.S. IG Corporate Bond Index is an unmanaged market-value-weighted index of IG corporate fixed-rate debt issues with maturities of one year or more. You cannot invest directly in an index.
[2] The BBG U.S. IG Corporate Bond Index, Option-Adjusted Spread (OAS) vs Treasury Curve, Breckinridge, 12/31/25.
[3] Barclays FICC Research, Credit Strategy, U.S. Investment Grade Credit Metrics – Q3 25 Update: No Signs of Concern, 12/15/25.
[4] Merger and acquisitions were up 51 percent in 4Q25 and 35 percent in FY25, respectively, Bloomberg, 12/31/25.
[5] This has only occurred twice before from 2019-2021 and 1991-1996. Over the past 35 years, the U.S. IG corporate bond market has generated positive excess returns in 23 years (66 percent) and negative excess returns in 12 years (34 percent), ICE Bond Indices, Annual Returns, Bloomberg, December 31, 2025. For FY25, the excess return relative to duration-matched Treasuries[1] was 1.19 percent.
[6] BBG U.S. IG Corporate Bond Index, Total Return on this Index was 7.77 percent through 12/31/25.
[7] Investment Company Institute (ICI), Estimated Taxable Bond Long-Term Flows and ETF Issuance, 12/31/25.
[8] U.S. Department of the Treasury International Capital Data for October 2025, December 18, 2025.
[9] Financial Accounts of the United States, Fed Flows of Funds, Second Quarter 2025, pp. 60, September 11, 2025.
[10] Morgan Stanley forecast for IG bond supply – $2.25 trillion in gross issuance (+25%Y) and $1 trillion in net issuance (+60%Y). Warm with a Chance of Overheating, 2026 U.S. Credit Strategy Outlook, November 21, 2025.
[11] Bloomberg, Credit Ratings Trends page, U.S. Long-Term IG Rating Actions, Moody’s, S&P, Fitch, 4Q25, 12/31/25.
[12] Will I Lose Money? Credit Buyers Turn to Breakevens for Clues, Ronan Martin, Bloomberg, October 1, 2025. Breakeven credit spread widening refers to calculating the amount a bond’s spread can increase before the bond’s total return becomes negative. For example, a bond earnings 100 bps (1%) but with a 2-year spread duration can withstand a 50 bps (0.5%) widening before breaking even on its spread return.
[13] The BBG U.S. IG Corporate Bond Index, Option-Adjusted Spread (OAS) vs Treasury Curve, Breckinridge, 12/31/25.
[14] Ibid.
[15] A z-score is a statistical measurement that indicates how far away a data point is from the mean of a dataset, measured in terms of standard deviations. It standardizes a raw score, allowing for comparisons between different datasets or populations.
[16] Bloomberg U.S. IG Corporate Bond Index, Breckinridge, December 31, 2025.
[17] Barclays FICC Research, U.S. Investment Grade Corporate Update, January 5, 2026.
[18] Morgan Stanley forecast for IG bond supply – $2.25 trillion in gross issuance (+25%Y) and $1 trillion in net issuance (+60%Y). Morgan Stanley estimates Hyperscaler bond issuance of $400 billion and debt-funding for M&A of $240 billion as driving the record tally, not to mention high maturities, calls, and tenders of $1.25 trillion in 2026. Warm with a Chance of Overheating, 2026 U.S. Credit Strategy Outlook, November 21, 2025.
[19] Investment Company Institute (ICI), Estimated Taxable Bond Long-Term Flows and ETF Issuance, 12/31/25.
[20] U.S. Treasury International Capital Data for October 2025, December 18, 2025.
[21] Edison Electric Institute, September 2025.
[22] Breckinridge expects Utilities to maintain current credit ratings, driven by rate increases, increased equity funding in the form of common stock and hybrid issuance, and asset sales.
Quantifying Power Demand from Artificial Intelligence, Breckinridge Capital Advisors, January 13, 2026.
[23] The final rule also includes conforming changes to other regulations that are tied to the leverage capital standards, such as the total loss-absorbing capacity and long-term debt requirements.
FDIC, FRB, OCC Joint Release, Agencies Issue Final Rule to Modify Certain Regulatory Capital Standards, 11/25/25.
[24] Barclays FICC Research, Credit Research, U.S. Banks 2026 Supply Outlook, December 4, 2025.
[25] Ibid.
[26] Barclays FICC Research, Credit Research, U.S. Investment Grade Credit Metrics Q3 Update: No Signs of Concern, December 15, 2025.
[27] Ibid.
[28] Earnings are projected to grow 8 percent in 4Q25 and 12 percent in FY25, respectively and 15 percent in FY26, Earnings Insight, FactSet, December 19, 2025.
[29] U.S. IG Agency credit rating upgrades exceeded downgrades by about 3:1 in 2025, Bloomberg, 12/31/25.
[30] Merger and acquisitions were up 51 percent in 4Q25 and 35 percent in FY25, respectively, Bloomberg, 12/31/25.
[31] Barclays U.S. Credit Research, Regulators Withdraw Leveraged Lending Guidance, December 9, 2025.
[32] Quantifying Power Demand from Artificial Intelligence, Breckinridge Capital Advisors, January 5, 2026.
BCAI-12292025-jych42va (1/5/2026)
DISCLAIMERS:
The content is intended for investment professionals and institutional investors.
This material provides general information and should not be construed as a solicitation or offer of services or products or as legal, tax or investment advice. Nothing contained herein should be considered a guide to security selection, asset allocation, or portfolio construction.
All information and opinions are current as of the dates indicated and are subject to change. Breckinridge believes the data provided by unaffiliated third parties to be dependable, but investors should conduct their own independent verification prior to use. Some economic and market conditions contained herein have been obtained from published sources and/or prepared by third parties, and in certain cases have not been updated through the date hereof.
There is no assurance that any estimate, target, projection, or forward-looking statement (collectively, “estimates”) included in this material will be accurate or prove to be profitable; actual results may differ substantially. Breckinridge estimates are based on Breckinridge’s research, analysis, and assumptions. Other events that were not considered in formulating such projections could occur and may significantly affect the outcome, returns or performance.
Not all securities or issuers mentioned represent holdings in client portfolios. Some securities have been provided for illustrative purposes only and should not be construed as investment recommendations. Any illustrative engagement or sustainability analysis examples are intended to demonstrate Breckinridge’s research and investment process.
Yields and other characteristics are metrics that can help investors in valuing a security, portfolio, or composite. Yields do not represent performance results, but they are one of several components that contribute to the return of a security, portfolio, or composite. Yields and other characteristics are presented gross of advisory fees.
All investments involve risk, including loss of principal. No investment or risk management strategy, including diversification, can guarantee positive results or risk elimination in any market.
Past performance is not indicative of future results. Breckinridge makes no assurances, warranties, or representations that any strategies described herein will meet their investment objectives or incur any profits. Performance results for Breckinridge’s investment strategies include the reinvestment of interest and any other earnings, but do not reflect any brokerage or trading costs a client would have paid. Results may not reflect the impact that any material market or economic factors would have had on the accounts during the time period. Due to differences in client restrictions, objectives, cash flows, and other such factors, individual client account performance may differ substantially from the performance presented.
Actual client advisory fees may differ from the advisory fee used to calculate net performance results. Client returns will be reduced by the advisory fees and any other expenses incurred in the management of their accounts. For example, an advisory fee of 1 percent compounded over a 10-year period would reduce a 10 percent return to a 9 percent annual return. Additional information on fees can be found in Breckinridge’s Form ADV Part 2A.
Index results are shown for illustrative purposes and do not represent the performance of any specific investment. Indices are unmanaged and investors cannot directly invest in them. They do not reflect any management, custody, transaction, or other expenses, and generally assume reinvestment of dividends, income, and capital gains. Performance of indices may be more or less volatile than any investment strategy.
There is no guarantee that the strategies or approaches discussed will achieve their objectives, lower volatility or be profitable. All investments involve risk, including loss of principal. Diversification cannot assure a profit or protect against loss. No investment or risk management strategy can guarantee positive results or risk elimination in any market.
Fixed income investments have varying degrees of credit risk, interest rate risk, default risk, and prepayment and extension risk. In general, bond prices rise when interest rates fall and vice versa.
Equity investments are volatile and can decline significantly in response to investor reception of the issuer, market, economic, industry, political, regulatory, or other conditions.
When integrating sustainability analysis with traditional financial analysis, Breckinridge’s investment team will consider material sustainability factors but may conclude that other attributes outweigh the sustainability considerations when making investment decisions.
There is no guarantee that integrating sustainability analyses will improve risk-adjusted returns, lower portfolio volatility over any specific time period, or outperform the broader market or other strategies that do not utilize these analyses when selecting investments. The consideration of sustainability factors may limit investment opportunities available to a portfolio. In addition, data for sustainable factors often lacks standardization, consistency, and transparency and for certain companies such data may not be available, complete, or accurate.
Breckinridge’s sustainability analysis is based on third party data and Breckinridge analysts’ internal analysis. Analysts will review a variety of sources such as corporate sustainability reports, data subscriptions, and research reports to obtain available metrics for internally developed frameworks. A high sustainability rating does not mean it will be included in a portfolio, nor does it mean that a bond will provide profits or avoid losses.
Investments in thematic customizations will subject the portfolio to proportionately higher risk exposure of any sectors or regions in which the investments target. In addition, the investments held in thematic customizations may not meet the desired positive impact or become subject to negative publicity; these types of events may cause the customizations to have poor performance due to the concentration of assets. There is no assurance that the customizations or the strategies will meet their objectives.
BLOOMBERG® is a trademark and service mark of Bloomberg Finance L.P. and its affiliates (collectively “Bloomberg”). Bloomberg does not approve or endorse this material or guarantees the accuracy or completeness of any information herein, or makes any warranty, express or implied, as to the results to be obtained therefrom and, to the maximum extent allowed by law, neither shall have any liability or responsibility for injury or damages arising in connection therewith.
The S&P500 Index (“Index”) and associated data is a product of S&P Dow Jones Indices LLC, its affiliates and/or their licensors and has been licensed for use by Breckinridge. © 2025 S&P Dow Jones Indices LLC, its affiliates and/or their licensors. All rights reserved. Redistribution or reproduction in whole or in part are prohibited without written permission of S&P Dow Jones Indices LLC. For more information on any of S&P Dow Jones Indices LLC’s indices please visit www.spdji.com. S&P® is a registered trademark of Standard & Poor’s Financial Services LLC (“SPFS”) and Dow Jones® is a registered trademark of Dow Jones Trademark Holdings LLC (“Dow Jones”). Neither S&P Dow Jones Indices LLC, SPFS, Dow Jones, their affiliates nor their licensors (“S&P DJI”) make any representation or warranty, express or implied, as to the ability of any index to accurately represent the asset class or market sector that it purports to represent and S&P DJI shall have no liability for any errors, omissions, or interruptions of any index or the data included therein.