Investing
Commentary published on November 14, 2025
October 2025 Market Commentary
Summary
- U.S. Treasury Curve: Treasury yields fell by 3, 5, 7, and 8 basis points (bps) across the 2-year, 5-year, 10-year, and 30-year maturities.
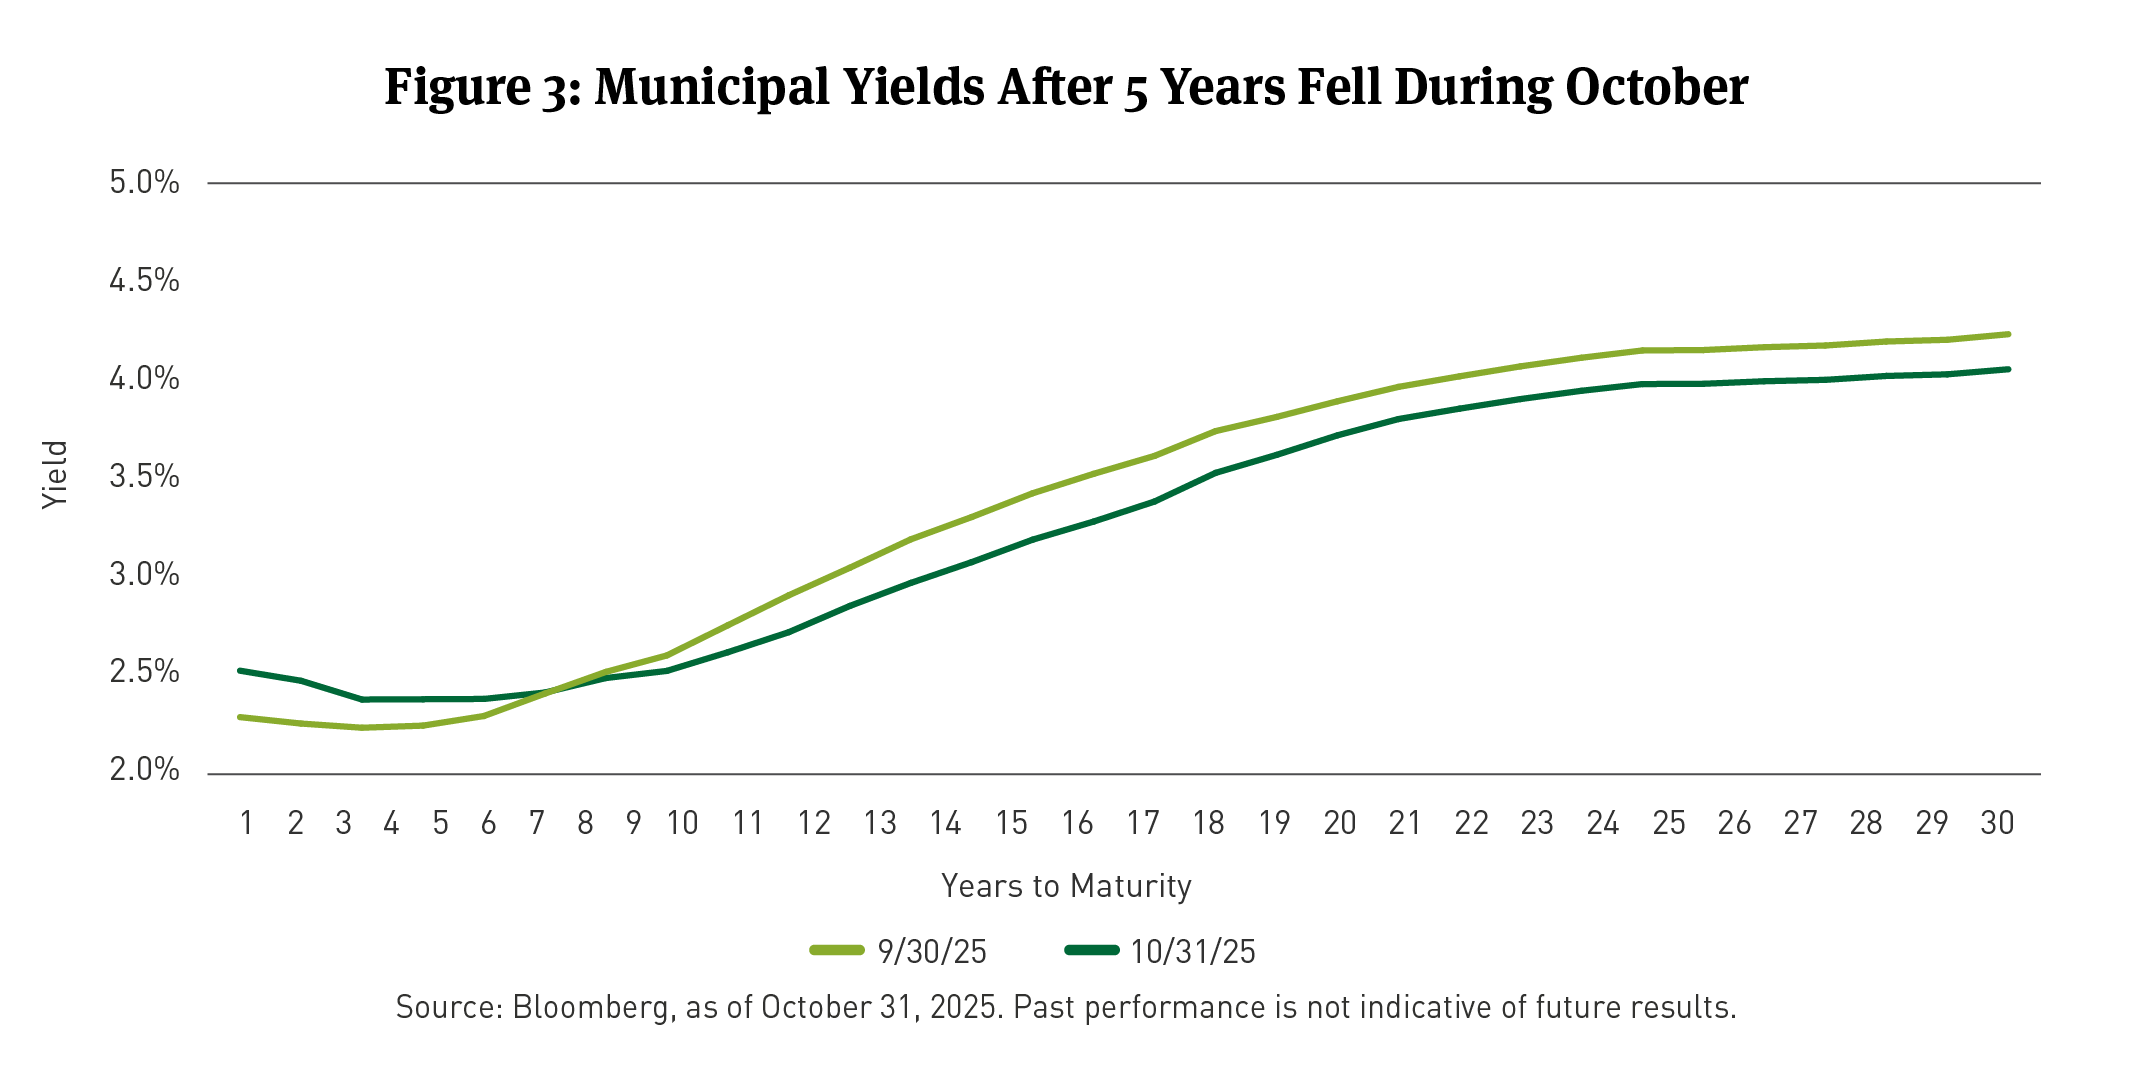
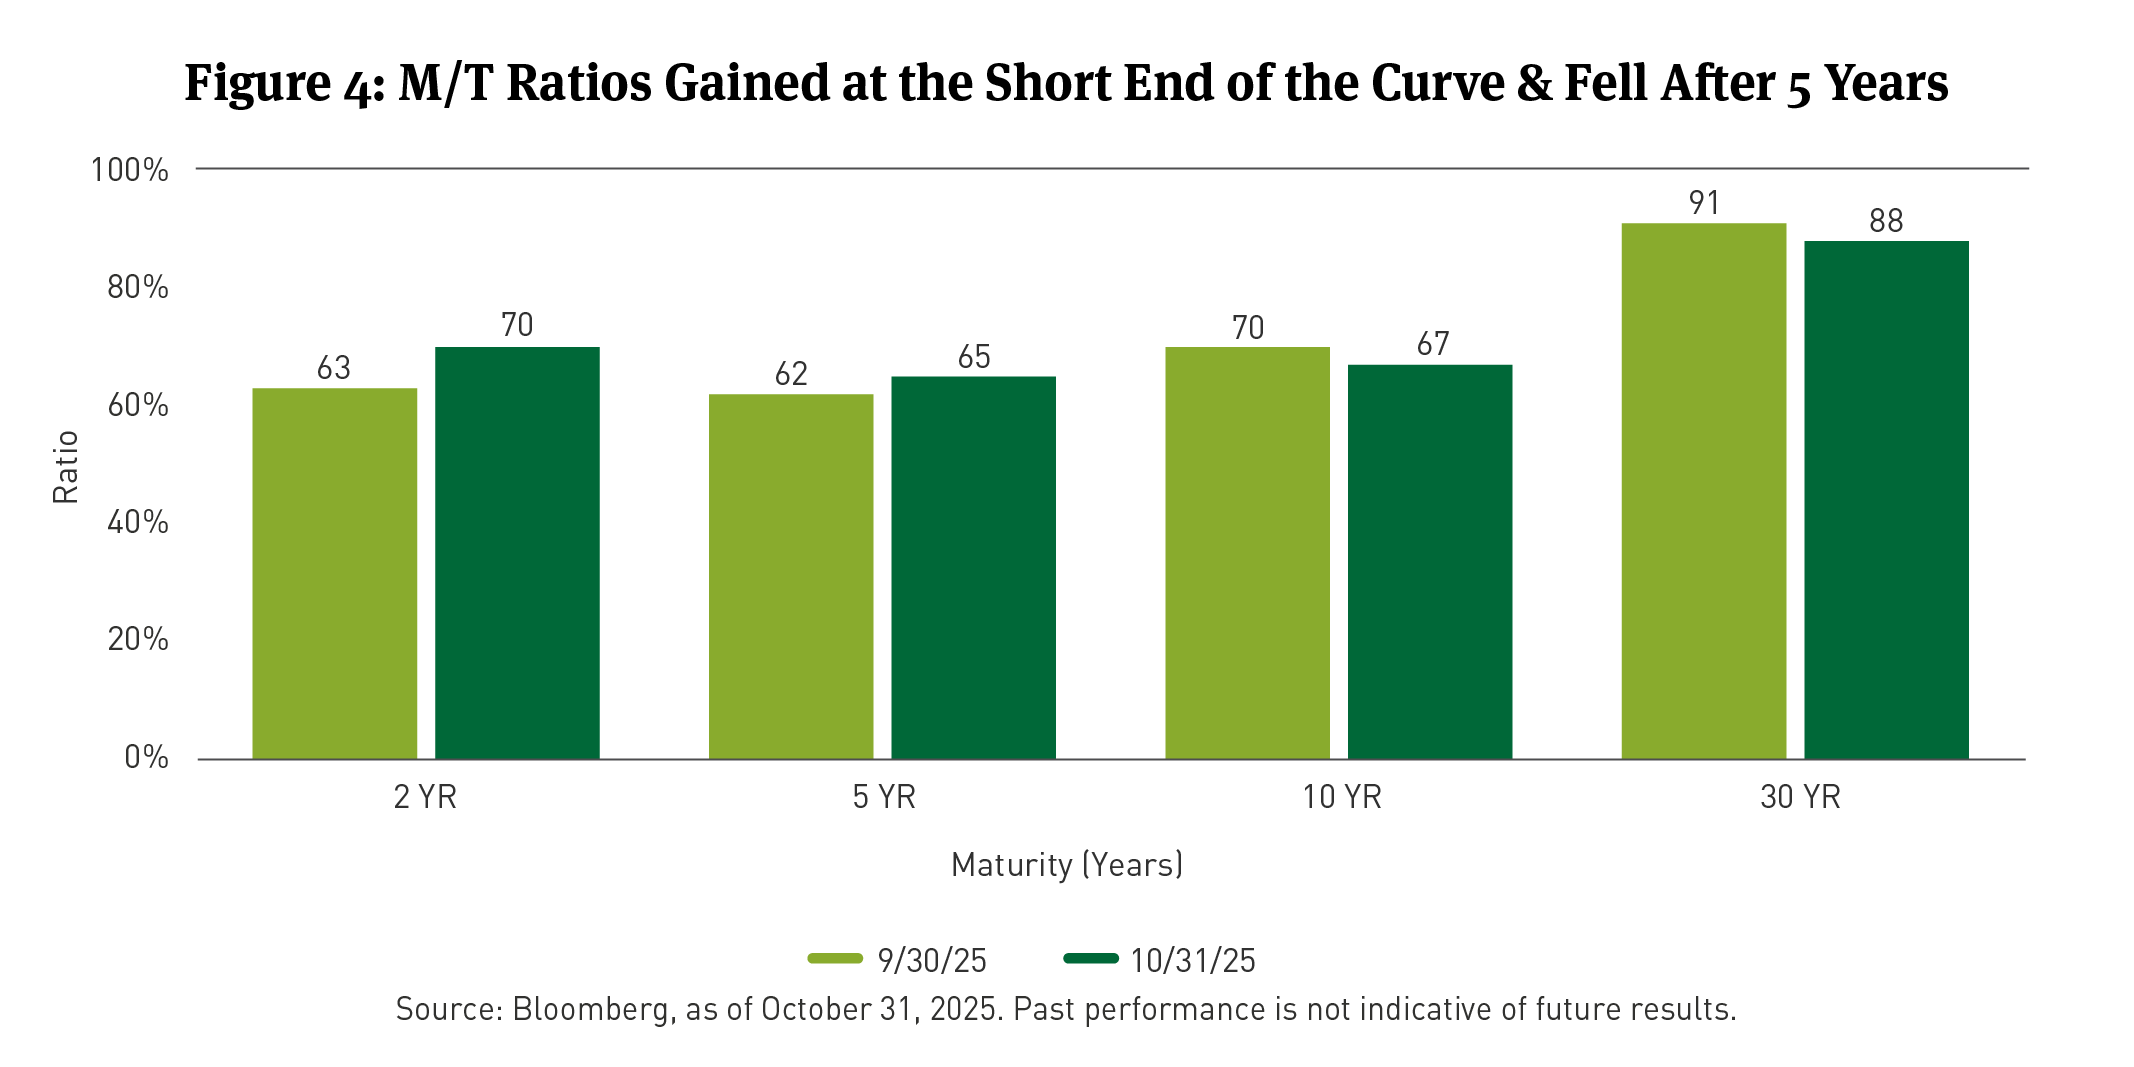
- Municipal Market Rates and Technicals: Municipal bond yields increased by as much as 22bps at the short end and declined by as much as 18bps at the long end, while Municipal/Treasury (M/T) ratios [1] ranged from 65 to 88 percent.
- Corporate Market Technicals: The option-adjusted spread (OAS) for the Bloomberg (BBG) Corporate Investment Grade (IG) Index [2] (Corporate Bond Index) widened by 5bps, and corporate bond issuance before redemptions was $149 billion.
- Securitized Trends: Mortgage-backed securities (MBS) returned 0.86 percent, and asset-backed securities (ABS) returned 0.38 percent, according to BBG benchmark indexes.
- Equity Market Trends: The S&P 500 Index returned 2.34 percent, with Information Technology, Health Care, and Consumer Discretionary sectors leading gains.
MARKET REVIEW
In October 2025, the Federal Open Market Committee (FOMC) cut interest rates by 25bps to a range of 3.75 to 4.00 percent and announced an end to quantitative tightening in December. The decision was met with dissents, and a December cut remains uncertain. The Fed faces a challenging environment with elevated inflation and a weakening labor market.
Since October 1, the federal government has been “shutdown” due to Congress’ failure to enact a timely fiscal year 2026 (FY26) budget. Now exceeding 35 days, this represents the longest full government shutdown in U.S. history. Breckinridge anticipates the shutdown to end sooner rather than later. Senate Republicans and Democrats agreed to a compromise spending bill on November 9. The House of Representatives still must approve it. The Breckinridge Investment Committee’s (IC’s)view is that the main impact on the market has been weaker growth in specific local economies, much of which it expects will reverse once the government reopens.
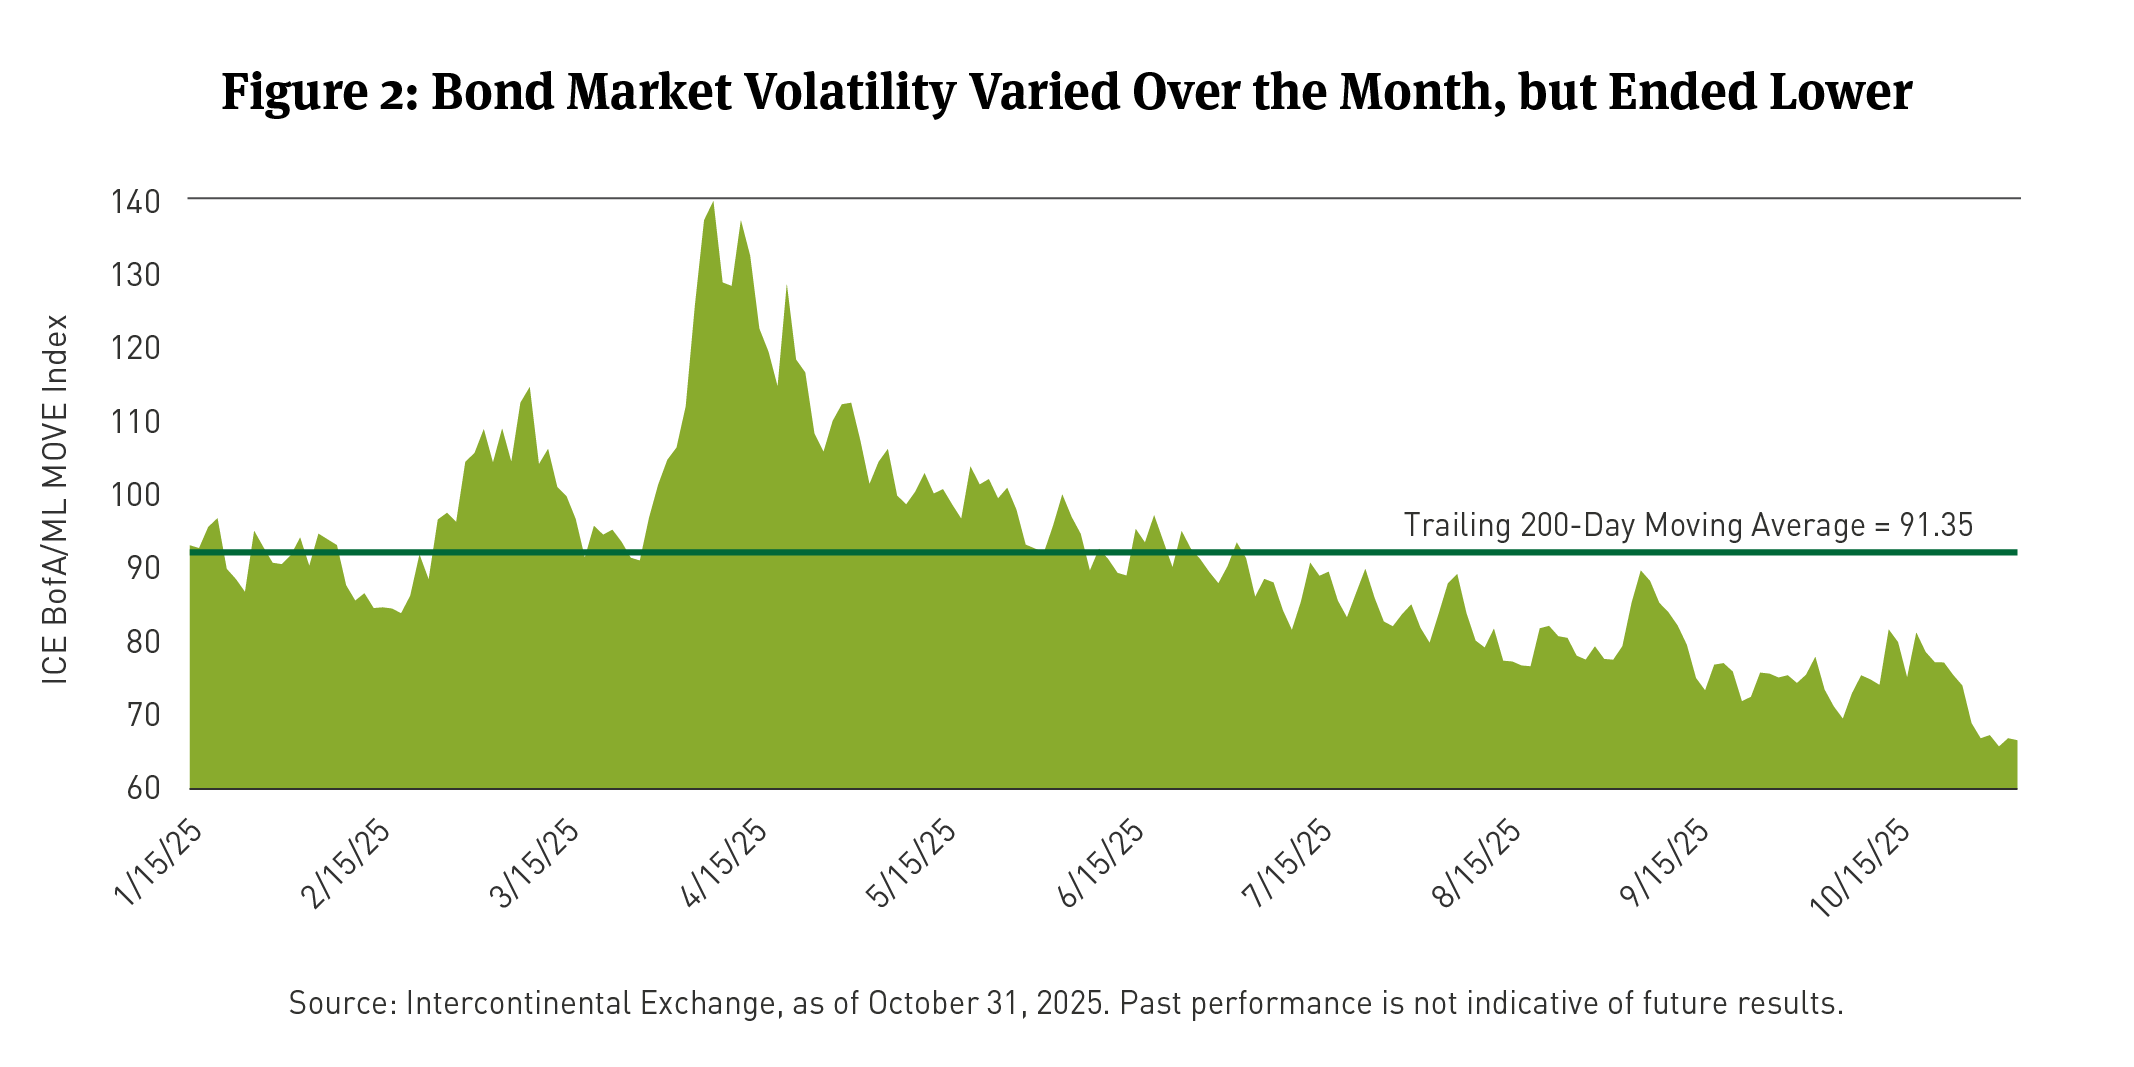
Treasury yields declined modestly in October, with the 10-year yield falling by 7bps (See Figure 1). The Intercontinental Exchange (ICE) Bank of America/Merrill Lynch Option Volatility Estimate (MOVE) Index,3 a measure of bond market volatility, remained relatively stable but ended the month lower than September (See Figure 2).
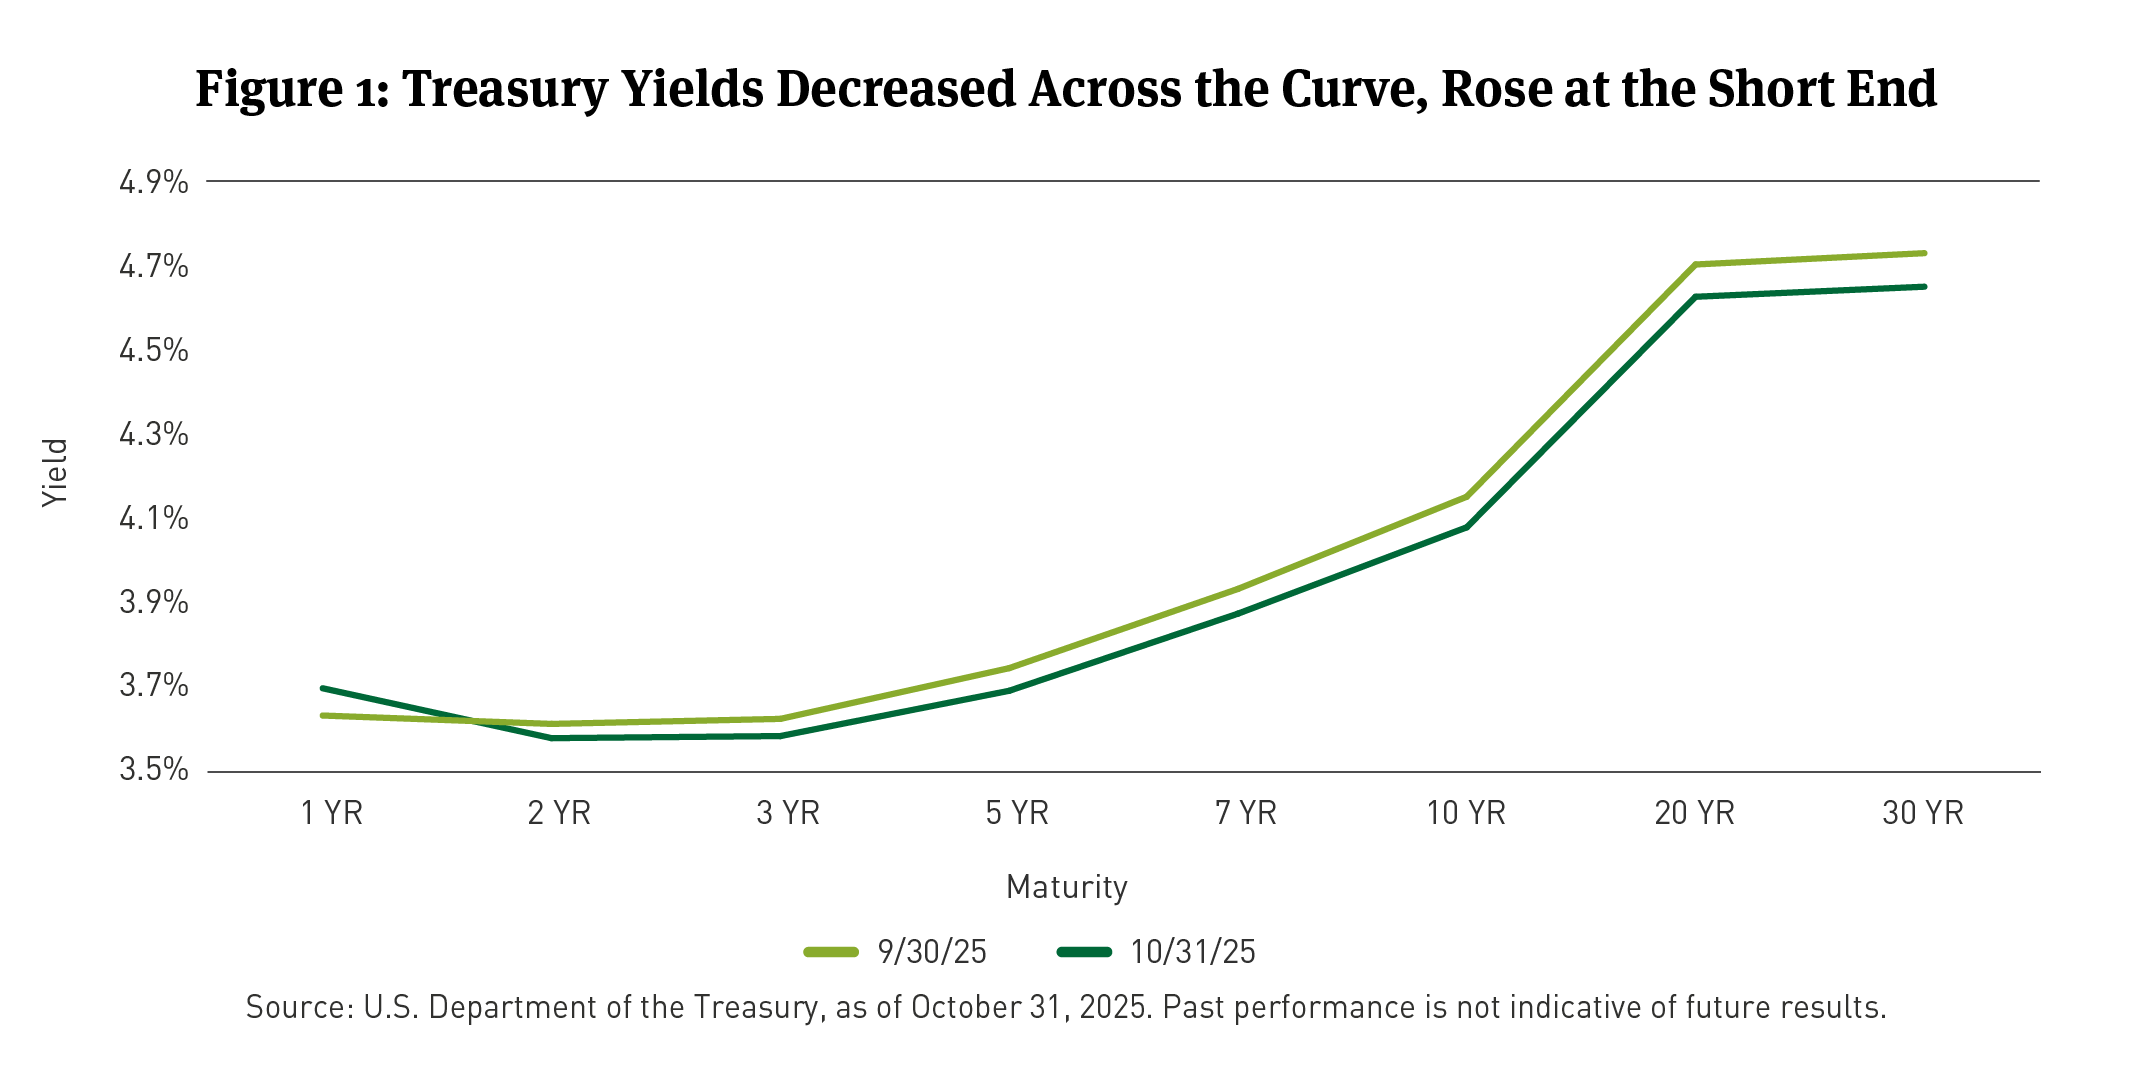
The IC expects the 10-year Treasury yield to range between 4.0 and 4.5 percent, with two more rate cuts anticipated by mid-2026. Given the outlook for moderate real growth, portfolio positioning remains defensive, with a focus on tight valuations in spread sectors and continued flows into IG bond funds.
MUNICIPAL MARKET REVIEW
New issue supply declined year-over-year (Y/Y) for the third month in a row, as supply moderated compared to the surge in issuance in October 2024. Year-to-date (YTD) issuance stands at $490 billion, up 9 percent from last year. According to Bloomberg data, new issuance amounted to just over $58 billion, an increase from the $49 billion issued in September and the $52 billion issued in August.
Moderating supply is expected to support the market into year-end, particularly given continued inflows following Fed rate cuts in September and October. Municipal bonds posted another month of positive returns, with the BBG Managed Money Short/Intermediate Index4 adding 0.36 percent in October. Longer duration munis outperformed Treasuries of similar maturities, and ratios fell below 70 percent across much of the curve. The 10-year range is now the best performing maturity range for municipals year-to-date.
Municipal bond yields at 2- and 5-years increased, while 10- and 30-year maturities declined for the month. The yield curve flattened, with the 2-year to 10-year slope declining to below 30bps, supportive, in our view, of a more defensive market stance. (See Figure 3).
Municipal/Treasury (M/T) ratios remained at 70 percent for 2-year maturities and below 70 percent for 3- to 10-year maturities. (See Figure 4).
CORPORATE MARKET REVIEW
The Corporate Bond Index OAS widened by 5bps in October. On a total return basis for the month, the Corporate Bond Index returned 0.38 percent, with an excess return of negative 0.28 percent.
Per BBG, the best-performing sectors in October were Sovereigns, Foreign Local Government, and Airlines. Conversely, the worst-performing sectors were Cable Satellite, Media Entertainment, and Wirelines. Total fixed-rate gross IG corporate supply was $149 billion in October. After $83 billion in redemptions, net issuance as $66 billion.
According to the Investment Company Institute, corporate bond fund flows were about $11 billion in October.
SECURITIZED MARKET REVIEW
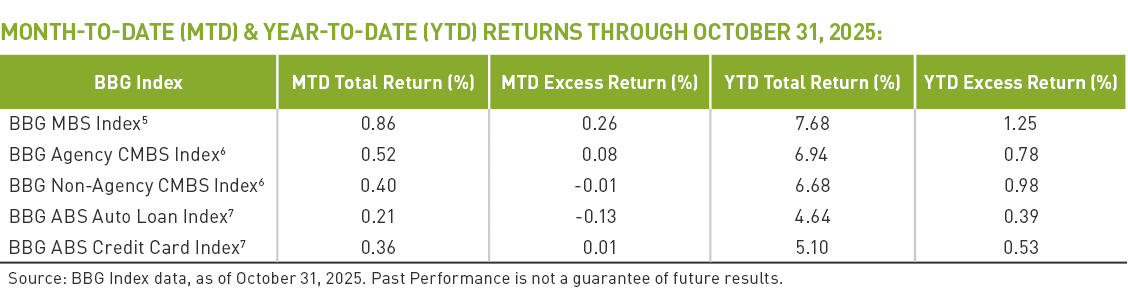
During October, MBS posted a total return of 0.86 percent, with an excess return of 0.26 percent. Commercial MBS (CMBS) returned 0.46 percent, with agency CMBS (ACMBS) outperforming at 0.52 percent.
ABS also saw mostly positive returns, with a total return of 0.38 percent and an excess return of negative 0.02 percent, at the broad sector level, according to BBG. Within ABS, credit card loans outperformed, returning 0.36 percent, while auto loans underperformed with a still-positive total return of 0.21 percent.
EQUITY MARKET REVIEW
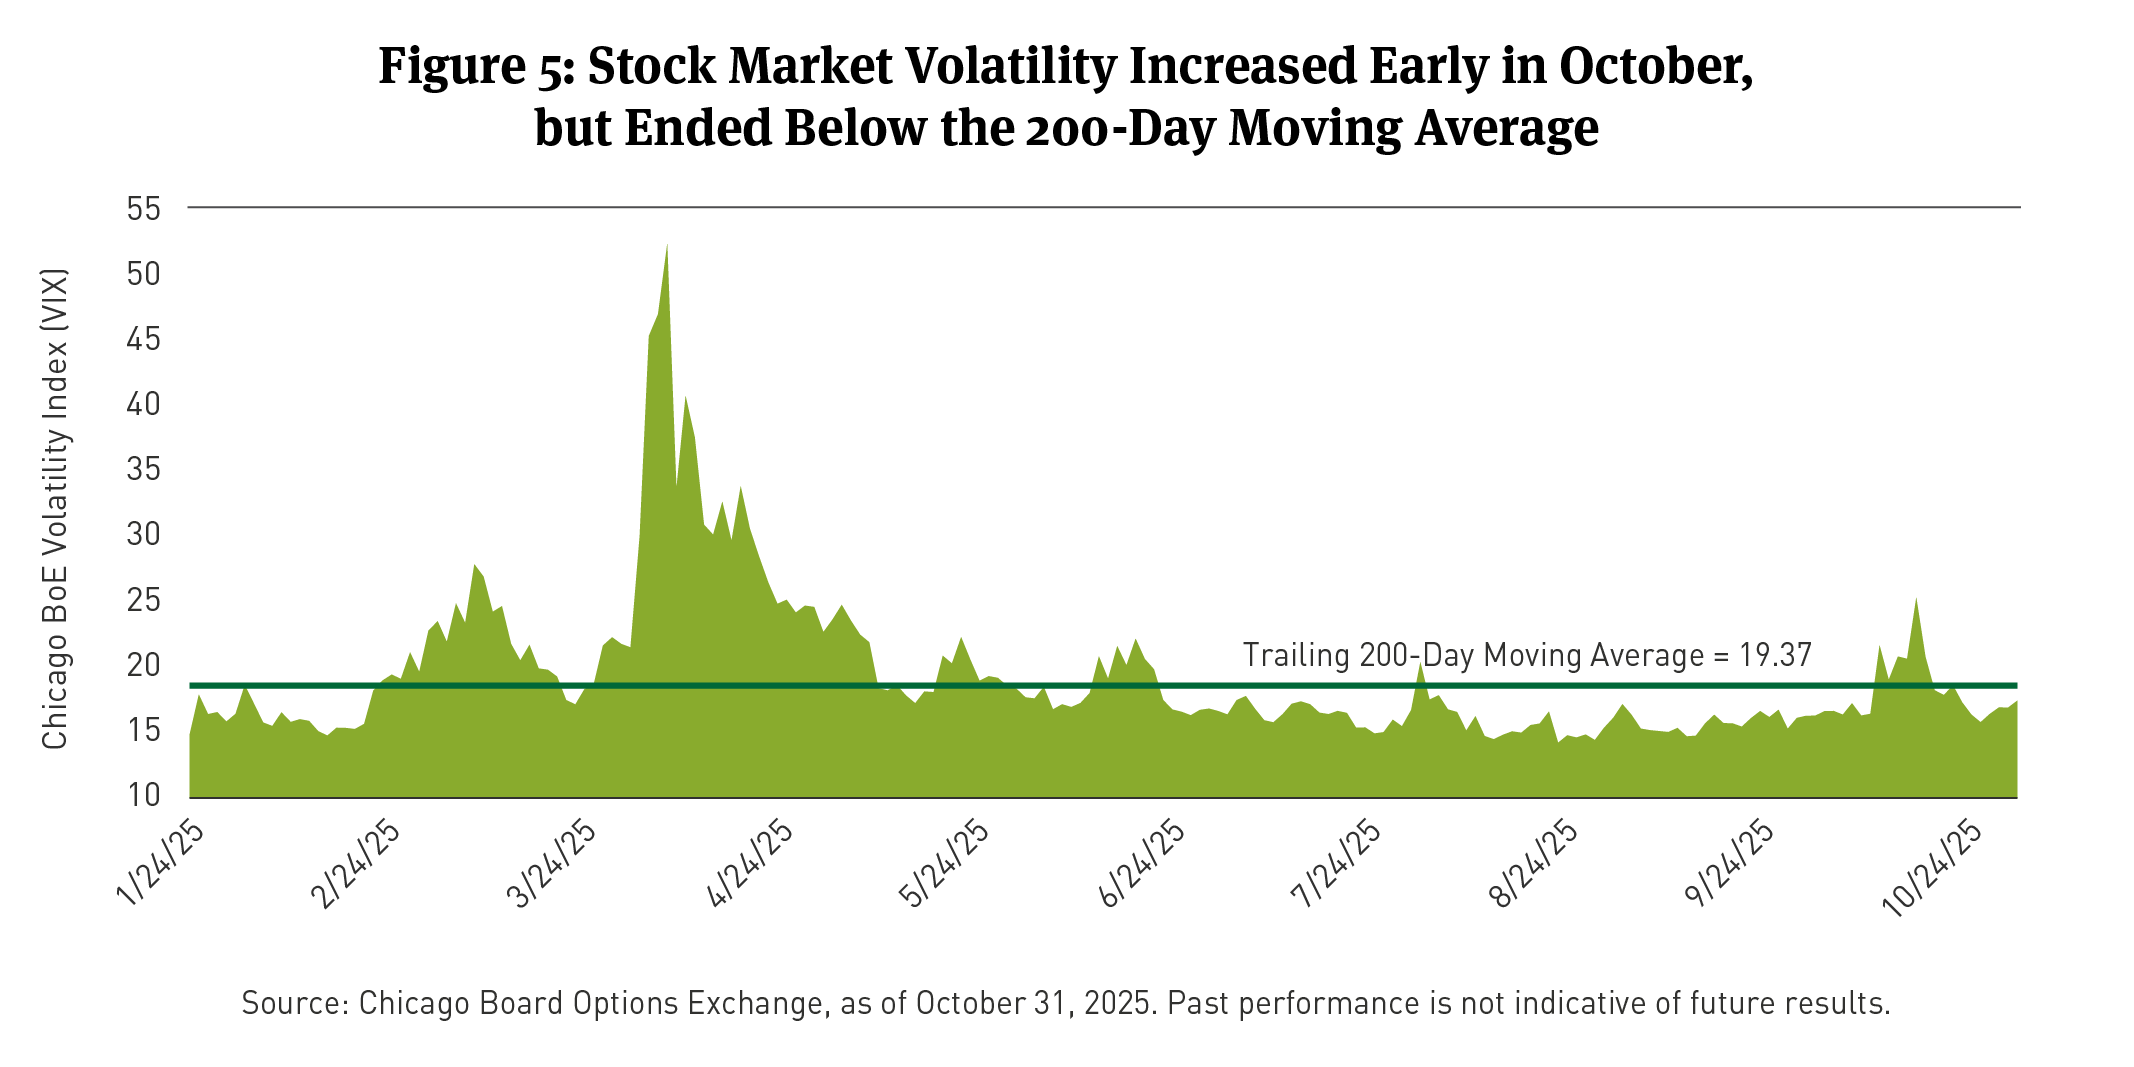
The S&P 500 Index returned 2.34 percent in October. The Chicago Board Options Exchange (BoE) Volatility Index8 (VIX), a measure of equity market volatility, increased over the month but remained below the 200-day moving average (See Figure 5). At a sector level, Information Technology (6.23 percent), Health Care (3.58 percent), and Consumer Discretionary (2.37 percent) were the top performers.
Conversely, Materials (down 5.04 percent), Financials (down 2.84 percent), and Real Estate (down 2.63 percent) lagged. The Russell 1000 Growth Index9 gained 3.6 percent, outperforming the Russell 1000 Value Index,10 which returned 0.4 percent.
Based on BBG data, top performing factors in October were High Beta, Large Market Capitalization and Growth, while the worst performing factors were Dividend Yield, Quality and High Profitability.
[1] The Municipal/Treasury (M/T) ratio compares yields of municipals bonds with those of U.S. Treasury bonds of the same maturity. M/T ratios can show the relative value of municipal bonds compared with taxable bonds, by indicating when yields for municipal bonds exceed the after-tax yields on taxable bonds.
[2] As of October 31, 2025, as measured by the BBG U.S. Corporate Investment Grade Bond Index, an unmanaged market-value-weighted index of investment grade corporate fixed-rate debt issues with maturities of one year or more. You cannot invest directly in an index.
[3] As of October 31, 2025, based on the Intercontinental (ICE) Bank of America/Merrill Lynch Option Volatility Estimate (MOVE) Index, which tracks the movement in U.S. Treasury yield volatility implied by current prices of one-month over-the-counter options on 2-year, 5-year, 10-year and 30-year Treasuries. Historically, the index rises as concerns grow that interest rates may be higher. You cannot invest directly in an index.
[4] Municipal bond performance is as measured by the BBG Managed Money Short/Intermediate (1-10) Index, which measures the performance of the publicly traded municipal bonds that cover the USD-denominated short/intermediate term tax-exempt bond market, including state and local general obligation bonds, revenue bonds, insured bonds, and pre-refunded bonds. It is rules-based, and market-value weighted. You cannot invest directly in an index.
[5] The Bloomberg MBS Index tracks agency mortgage-backed pass-through securities (both fixed-rate and hybrid ARM) guaranteed by government-sponsored enterprises (GSEs) Government National Mortgage Association (Ginnie Mae) (GNMA), Federal National Mortgage Association (Fannie Mae) (FNMA), and Federal Home Loan Mortgage Corporation (Freddie Mac) (FHLMC). The index is constructed by grouping individual pools into aggregates or generics based on program, coupon, and vintage. You cannot invest directly in an index.
[6] The Bloomberg U.S. CMBS Investment Grade Index measures the market of U.S. Agency (GNMA, FNMA, and (FHLMC) and U.S. Non-Agency conduit and fusion CMBS deals with a minimum current deal size of $300mn. You cannot invest directly in an index.
[7] Bloomberg U.S. Asset-Backed Securities (ABS) Index is the ABS component of the Bloomberg U.S. Aggregate Bond Index, a flagship measure of the U.S. investment grade, fixed-rate bond market. The ABS index has three subsectors: credit and credit cards, autos, and utility. You cannot invest directly in an index.
[8] The Chicago Board Options Exchange (OEX) Volatility (VIX) Index is the ticker symbol and name for the Chicago Board Options Exchange's (CBOE) Volatility Index, a measure of the stock market's expectation of volatility based on S&P 500 index options. You cannot invest directly in an index.
[9] The Russell 1000® Growth Index is an unmanaged market capitalization-weighted index of growth-oriented stocks of U.S. domiciled companies that are included in the Russell 1000 Index. Growth-oriented stocks tend to have higher price-to-book ratios and higher forecasted growth values. You cannot invest directly in an index.
[10] The Russell 1000® Value Index is an unmanaged market capitalization-weighted index of value-oriented stocks of U.S. domiciled companies that are included in the Russell 1000 Index. Value-oriented stocks tend to have lower price-to-book ratios and lower forecasted growth values. You cannot invest directly in an index.
BCAI-11122025-ti2n94k3 (11/14/2025)
DISCLAIMERS:
This material provides general information and should not be construed as a solicitation or offer of services or products or as legal, tax or investment advice. Nothing contained herein should be considered a guide to security selection, asset allocation or portfolio construction.
All information and opinions are current as of the dates indicated and are subject to change. Breckinridge believes the data provided by unaffiliated third parties to be reliable but investors should conduct their own independent verification prior to use. Some economic and market conditions contained herein have been obtained from published sources and/or prepared by third parties, and in certain cases have not been updated through the date hereof.
There is no assurance that any estimate, target, projection or forward-looking statement (collectively, “estimates”) included in this material will be accurate or prove to be profitable; actual results may differ substantially. Breckinridge estimates are based on Breckinridge’s research, analysis and assumptions. Other events that were not considered in formulating such projections could occur and may significantly affect the outcome, returns or performance.
Not all securities or issuers mentioned represent holdings in client portfolios. Some securities have been provided for illustrative purposes only and should not be construed as investment recommendations. Any illustrative engagement or sustainability analysis examples are intended to demonstrate Breckinridge’s research and investment process.
Yields and other characteristics are metrics that can help investors in valuing a security, portfolio or composite. Yields do not represent performance results but they are one of several components that contribute to the return of a security, portfolio or composite. Yields and other characteristics are presented gross of advisory fees.
All investments involve risk, including loss of principal. No investment or risk management strategy, including diversification, can guarantee positive results or risk elimination in any market. Periods of elevated market volatility can significantly impact the value of securities. Investors should consult with their advisors to understand how these risks may affect their portfolios and to develop a strategy that aligns with their financial goals and risk tolerances.
Past performance is not indicative of future results. Breckinridge makes no assurances, warranties or representations that any strategies described herein will meet their investment objectives or incur any profits. Performance results for Breckinridge’s investment strategies include the reinvestment of interest and any other earnings, but do not reflect any brokerage or trading costs a client would have paid. Results may not reflect the impact that any material market or economic factors would have had on the accounts during the time period. Due to differences in client restrictions, objectives, cash flows, and other such factors, individual client account performance may differ substantially from the performance presented.
Actual client advisory fees may differ from the advisory fee used to calculate net performance results. Client returns will be reduced by the advisory fees and any other expenses incurred in the management of their accounts. For example, an advisory fee of 1 percent compounded over a 10-year period would reduce a 10 percent return to a 9 percent annual return. Additional information on fees can be found in Breckinridge’s Form ADV Part 2A.
Index results are shown for illustrative purposes and do not represent the performance of any specific investment. Indices are unmanaged and investors cannot directly invest in them. They do not reflect any management, custody, transaction or other expenses, and generally assume reinvestment of dividends, income and capital gains. Performance of indices may be more or less volatile than any investment strategy.
Fixed income investments have varying degrees of credit risk, interest rate risk, default risk, and prepayment and extension risk. In general, bond prices rise when interest rates fall and vice versa.
Equity investments are volatile and can decline significantly in response to investor reception of the issuer, market, economic, industry, political, regulatory or other conditions.
BLOOMBERG® is a trademark and service mark of Bloomberg Finance L.P. and its affiliates (collectively “Bloomberg”). Bloomberg does not approve or endorse this material or guarantees the accuracy or completeness of any information herein, or makes any warranty, express or implied, as to the results to be obtained therefrom and, to the maximum extent allowed by law, neither shall have any liability or responsibility for injury or damages arising in connection therewith.
The S&P500 Index (“Index”) and associated data is a product of S&P Dow Jones Indices LLC, its affiliates and/or their licensors and has been licensed for use by Breckinridge. © 2025 S&P Dow Jones Indices LLC, its affiliates and/or their licensors. All rights reserved. Redistribution or reproduction in whole or in part are prohibited without written permission of S&P Dow Jones Indices LLC. For more information on any of S&P Dow Jones Indices LLC’s indices please visit www.spdji.com. S&P® is a registered trademark of Standard & Poor’s Financial Services LLC (“SPFS”) and Dow Jones® is a registered trademark of Dow Jones Trademark Holdings LLC (“Dow Jones”). Neither S&P Dow Jones Indices LLC, SPFS, Dow Jones, their affiliates nor their licensors (“S&P DJI”) make any representation or warranty, express or implied, as to the ability of any index to accurately represent the asset class or market sector that it purports to represent and S&P DJI shall have no liability for any errors, omissions, or interruptions of any index or the data included therein.