Investing
Commentary published on December 9, 2025
November 2025 Market Commentary
Summary
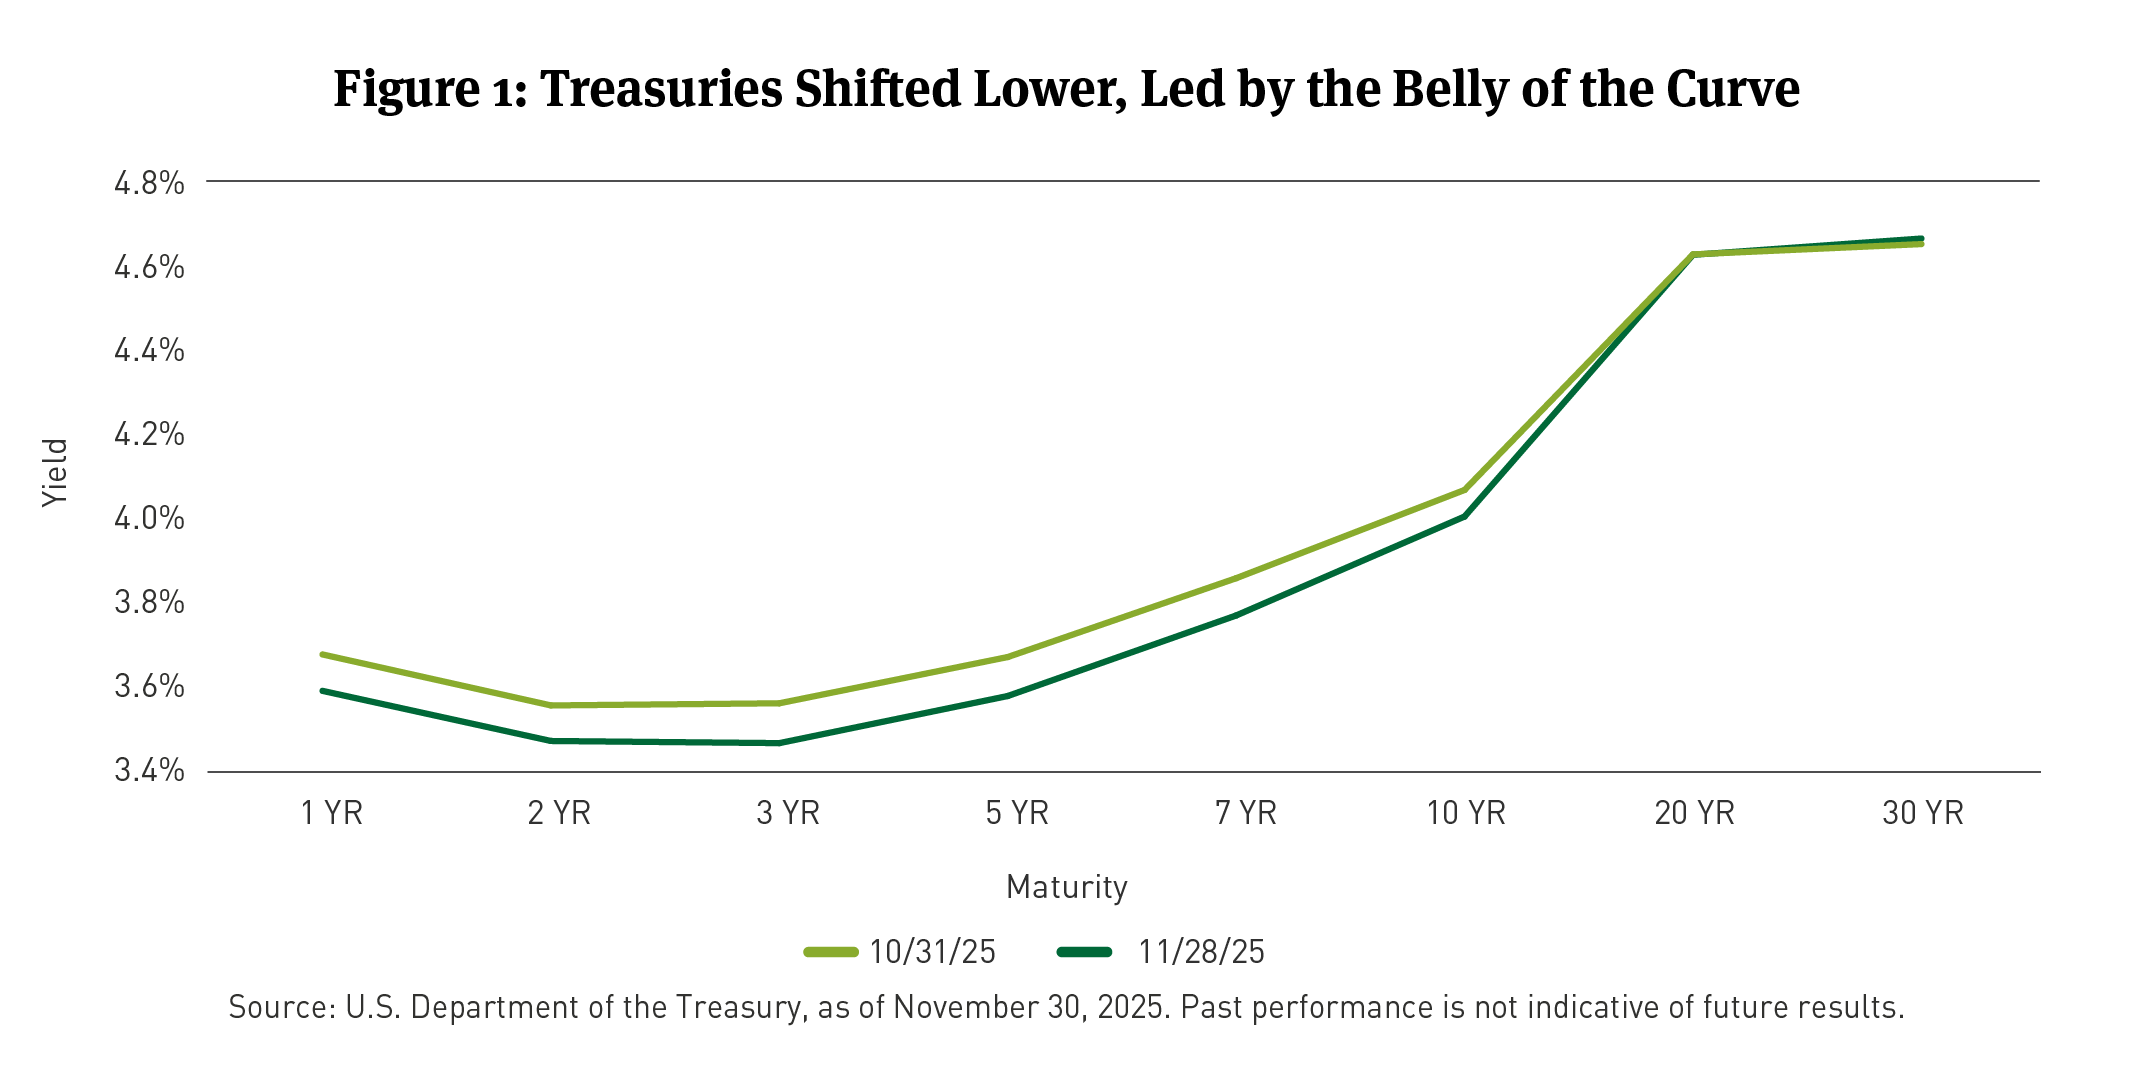
- U.S. Treasury Curve: U.S. Treasury yields declined across the 2-year, 5-year, and 10-year maturities, while the 30-year yield remained unchanged.
- Municipal Markets: Municipal bond yields held steady, leading to positive returns for Bloomberg (BBG) muni indexes, with Municipal/Treasury (M/T) ratios [1] ranging from 67 to 88 percent amidst elevated issuance.
- Corporate Markets: The option-adjusted spread (OAS) for the BBG Corporate Investment Grade (IG) Index [2] (Corporate Bond Index) widened by 2 basis points (bps). Monthly IG corporate bond issuance reached $128.7 billion.
- Securitized Markets: Both mortgage-backed (MBS) and asset-backed securities (ABS) posted positive total returns in November.
- Equity Markets: The S&P 500 Index rose by 0.25 percent, primarily driven by strength in Health Care as well as late-month strength in the Information Technology and Communication Services sectors.
The following commentary summarizes discussions among members of the Breckinridge Capital Advisors Investment Committee as they reviewed monthly market activity and investment returns. The Investment Committee, led by Co-Chief Investment Officers Matthew Buscone and Jeffrey Glenn, CFA, includes Co-Heads of Research, Nicholas Elfner and Adam Stern, J.D., M.P.A.; and Portfolio Manager and Director, Corporate Research, Josh Perez, CFA.
MARKET REVIEW
Market volatility persisted through November, fueled by concerns over a potential artificial intelligence (AI) investment bubble and the risk of private credit defaults. The federal government reopened mid-month following its longest shutdown in history, which allowed for the release of previously delayed economic data. Notably, September’s nonfarm payrolls increased by 119,000, and U.S. real gross domestic product (GDP) expanded at a 3.8 percent pace in the second quarter. Third- and fourth-quarter estimates project growth at 2.9 percent and 1.0 percent, respectively. Inflation remained elevated, with the core Consumer Price Index (CPI) up 3.0 percent year-over-year in September, driven by persistent services price pressures despite continued moderation in shelter costs.
Treasury yields declined across most of the curve, reflecting shifting market expectations. The 2-year yield dropped by 8bps, the 5-year by 9bps, and the 10-year by 6bps, while the 30-year yield edged up 1bp (See Figure 1). This movement contributed to a 0.62 percent total return for the BBG U.S. Treasury Index for the month.
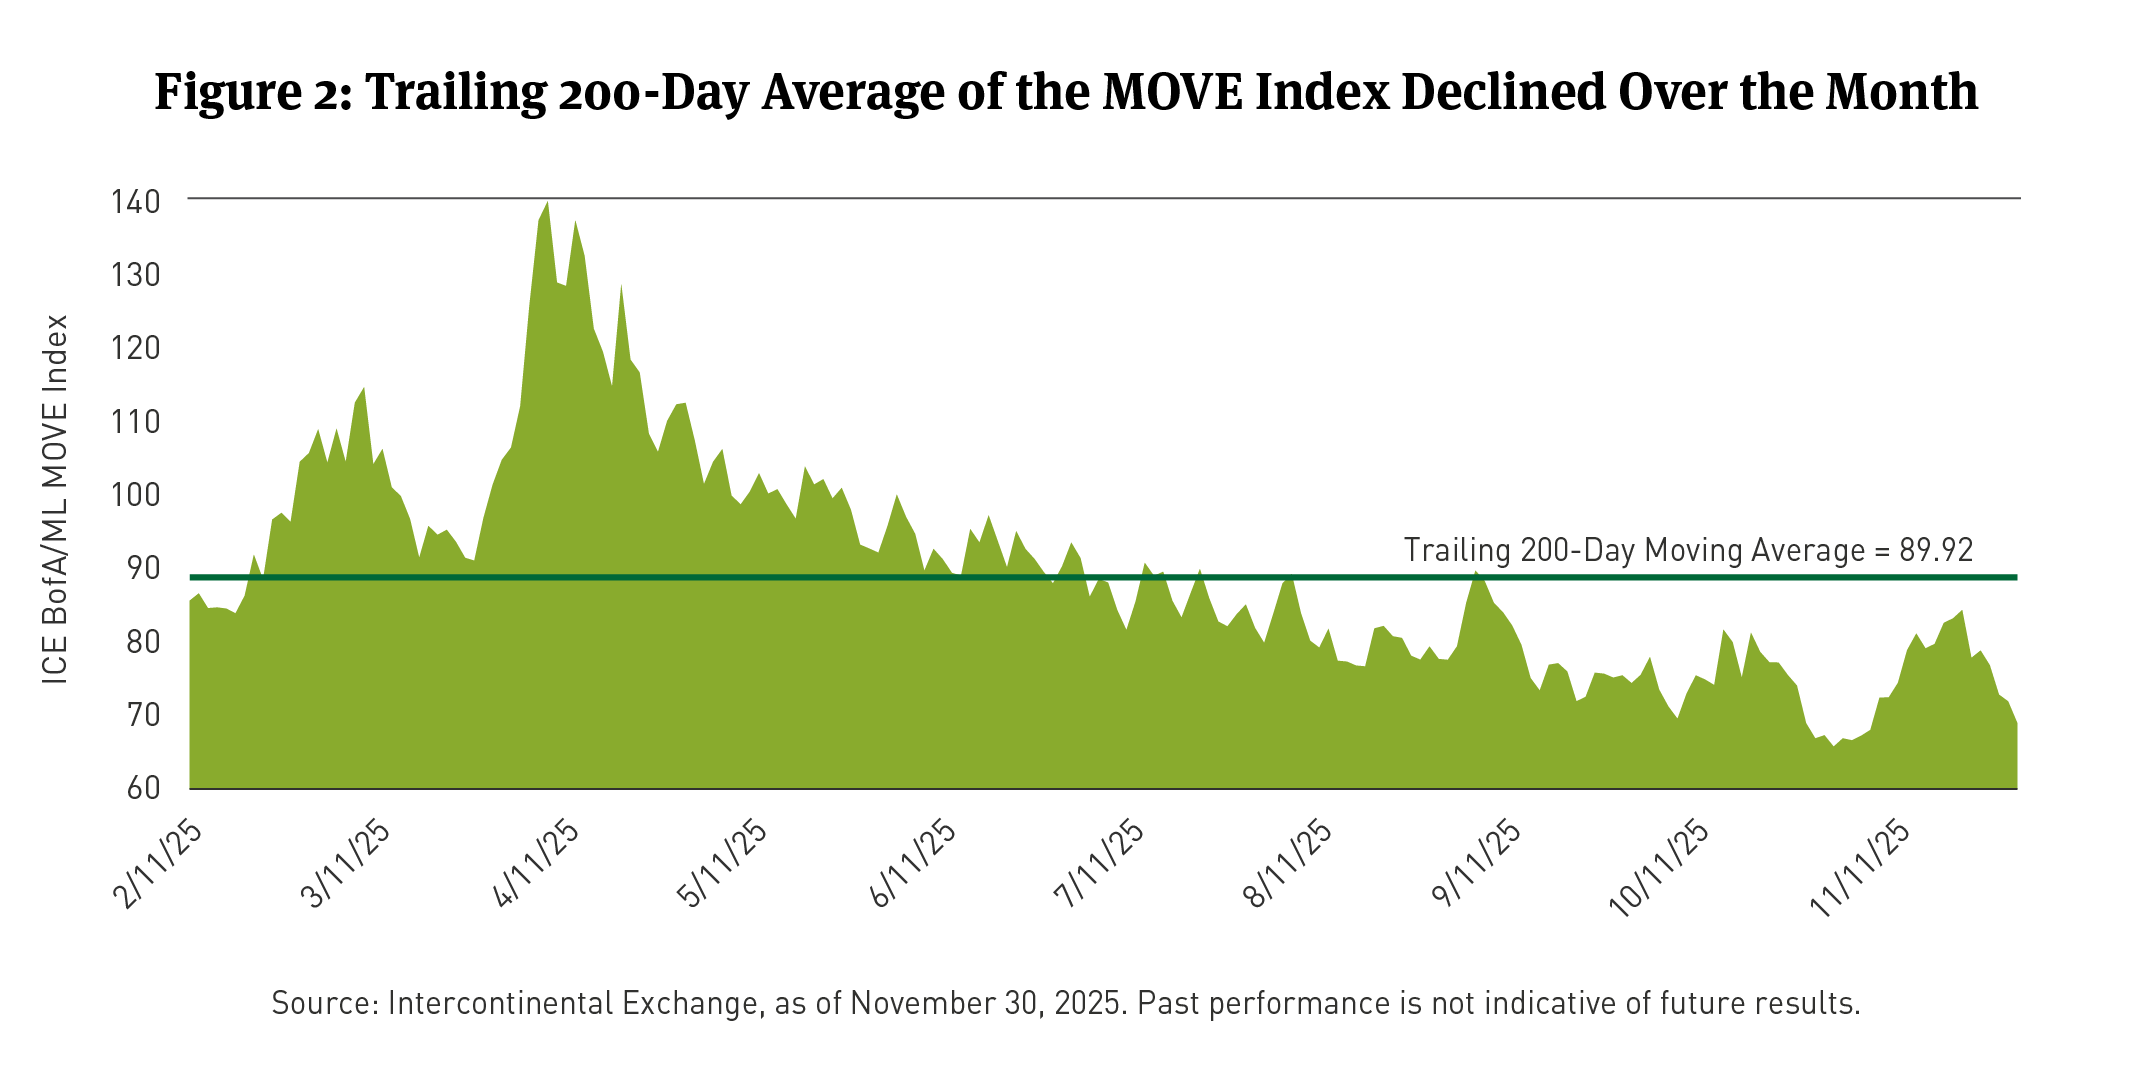
Bond market volatility, as measured by the ICE Bank of America/Merrill Lynch Option Volatility Estimate (MOVE) Index,3 indicated heightened uncertainty (See Figure 2). Futures markets are now fully pricing in a 25bps fed funds rate cut at the December Federal Reserve meeting, alongside a steepening in the 2s/10s yield curve, suggesting a market belief in future monetary easing.
The Breckinridge Investment Committee (IC) anticipates two additional rate cuts by mid-2026, with the 10-year Treasury yield expected to trade between 4.0 percent and 4.5 percent in the near term. Given an outlook for moderate real growth and tight valuations in spread sectors, portfolio positioning remains defensive, though elevated yields continue to attract investor interest. The IC notes that if October’s payroll data reveals further labor market weakness, it would strengthen the case for a December rate reduction.
MUNICIPAL MARKET REVIEW
Municipal bond issuance totaled $44.6 billion in November, a decrease from the prior month’s $58.3 billion but consistent with seasonal trends. New supply remained elevated compared to recent years, contributing to increased dealer inventories, with at least two additional heavy issuance weeks anticipated in early December. Municipal fund flows recorded $854 million in inflows for the month, according to LSEG data, bringing the YTD total inflows to $44 billion into ETFs and open-end mutual funds.
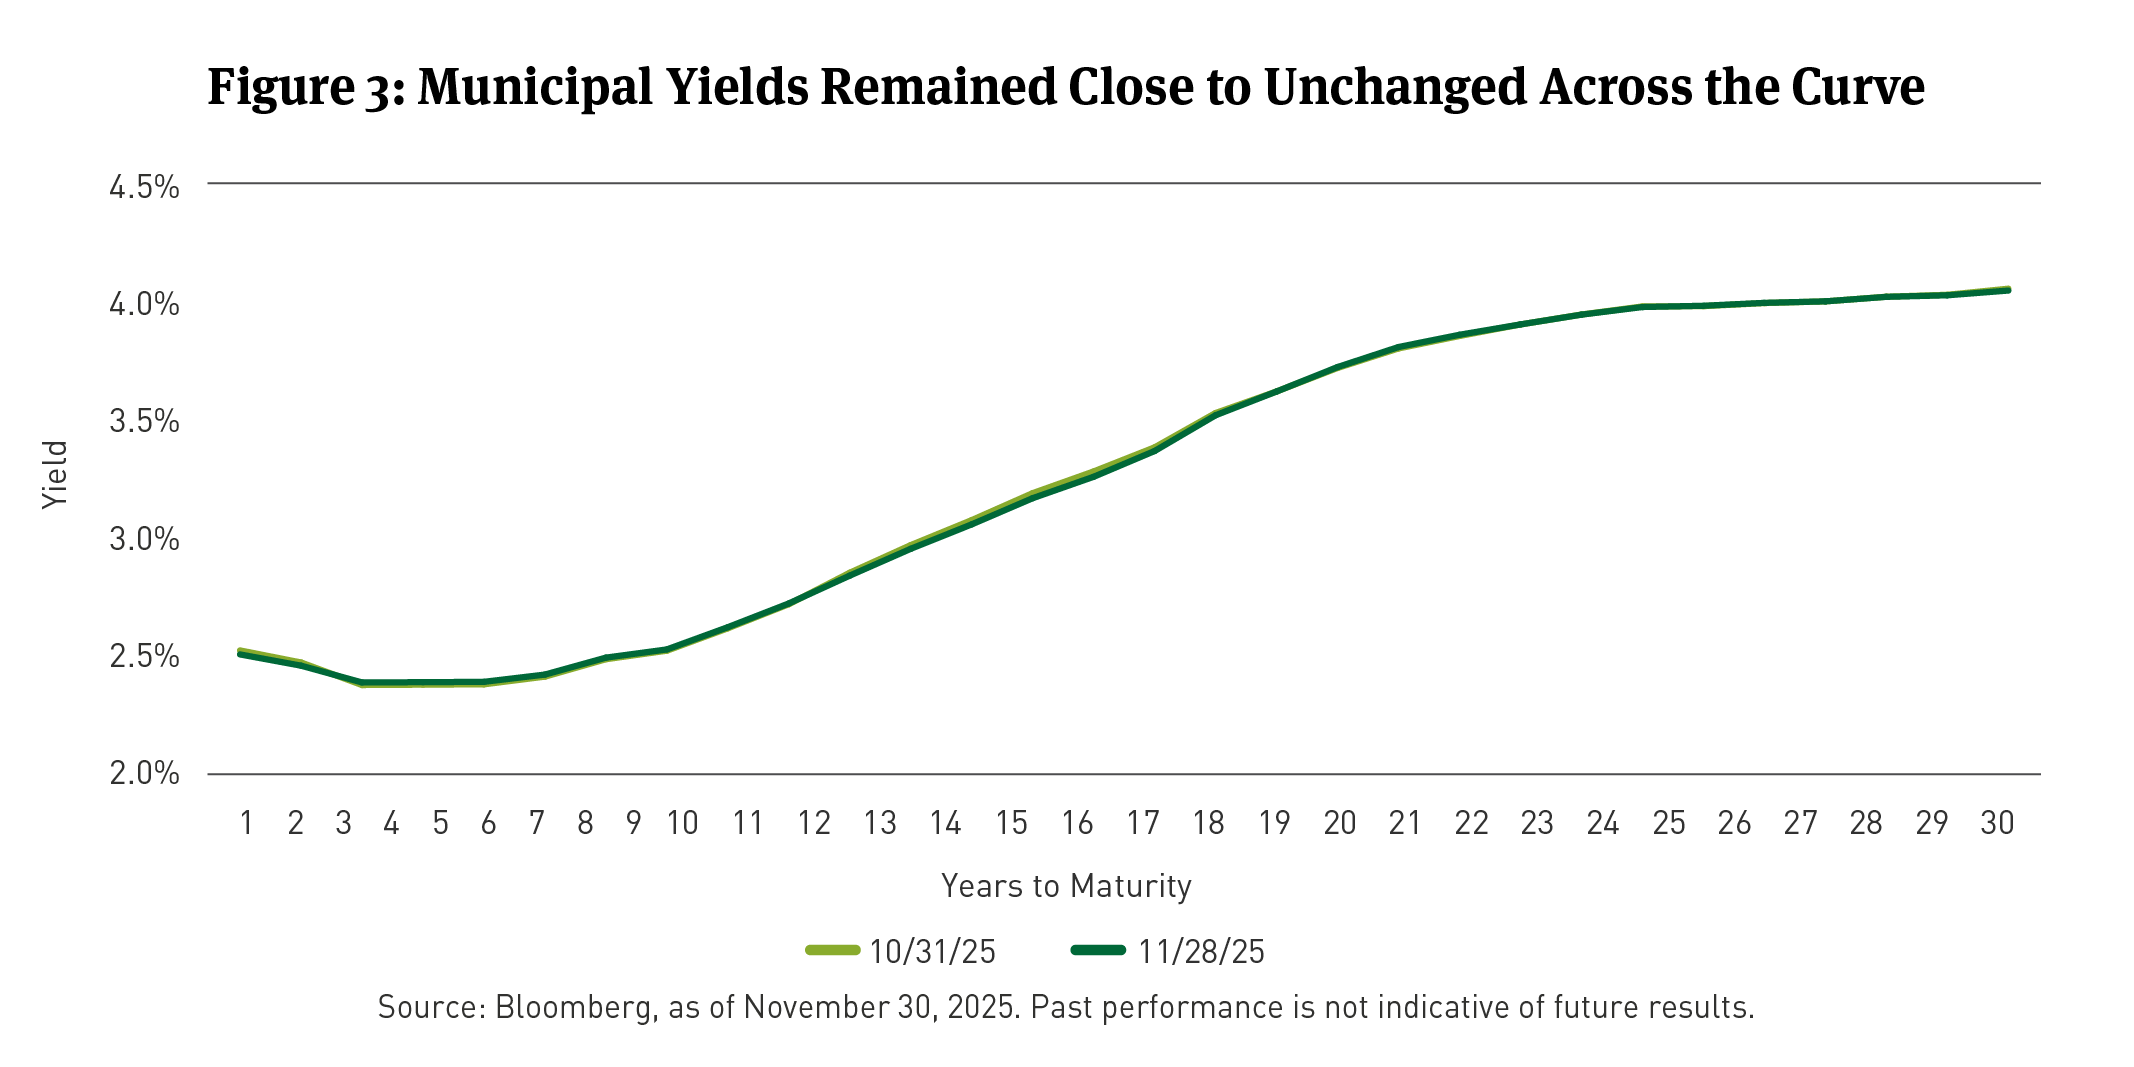
The Bloomberg Short/Intermediate Municipal Bond Index4 posted a modest total return of 0.23 percent in November, reflecting slight price appreciation despite limited movement in yields. Municipal yields were largely unchanged across the curve, falling by 1bp at the 2-year and 30-year tenors, rising by 1bp at the 5-year, and remaining flat at the 10-year (See Figure 3). Muni yield stability contrasted with broader Treasury yield declines across most maturities.
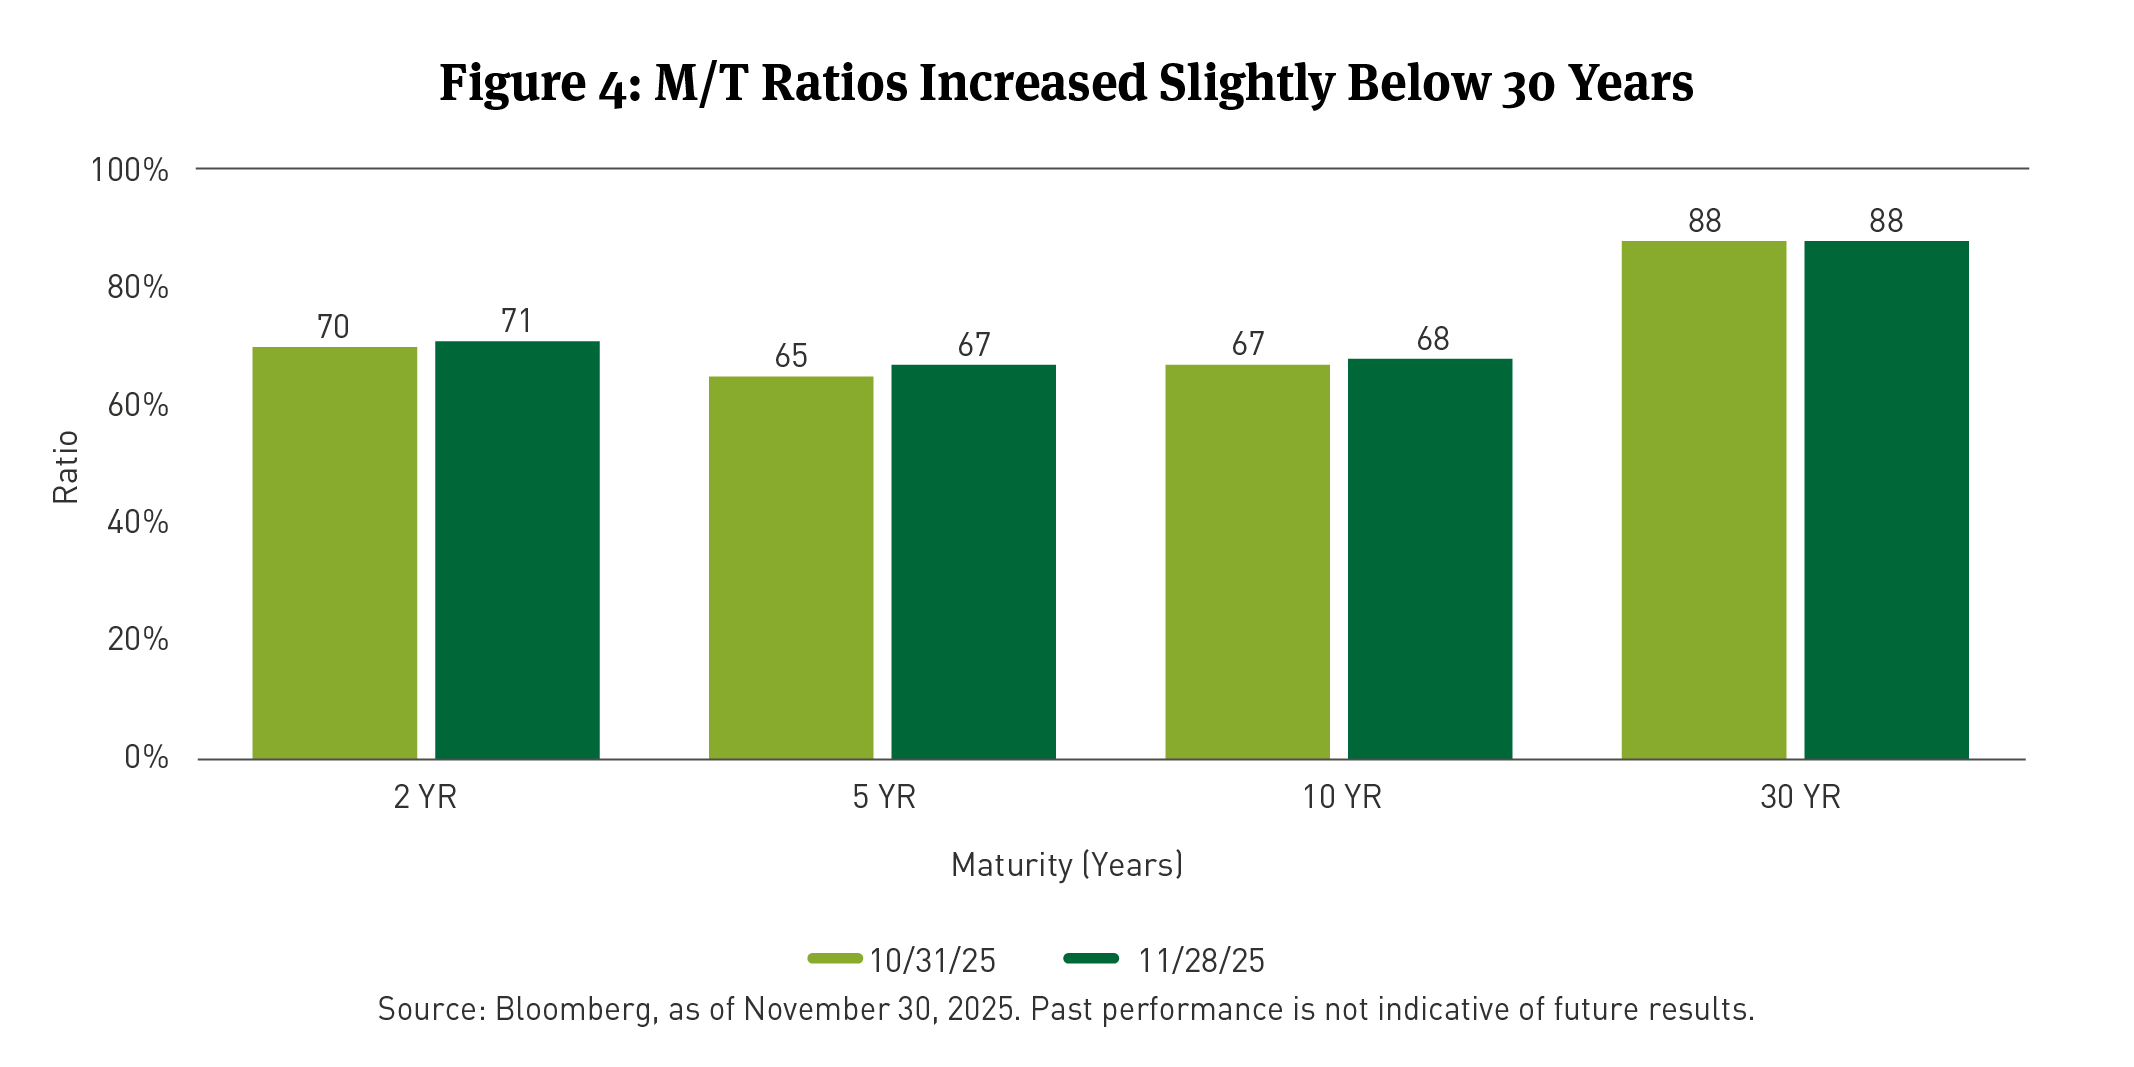
M/T ratios ended the month at 71 percent for 2-year, 67 percent for 5-year, 68 percent for 10-year, and 88 percent for 30-year maturities (See Figure 4). Ratios at the intermediate part of the curve remained below historical averages, while the 30-year ratio held at a relative premium. The market appeared range-bound, with valuations reading as somewhat rich despite the heavy year-to-date supply.
Despite the richer valuations and tighter spreads, municipal bonds may be supported by strong reinvestment demand expected to accelerate at the start of the new year. The IC observed that while ratios and spreads appear elevated, seasonally lighter supply in mid-December and robust demand dynamics could provide support.
CORPORATE MARKET REVIEW
The IG Corporate Bond Index OAS widened by 2bps in November, indicating a slight increase in perceived credit risk. The corporate bond index posted a total return of 0.65 percent, with an excess return of negative 0.02 percent.
The best-performing corporate sectors were Tobacco, Pharmaceuticals, and Wirelines, demonstrating resilience in a widening spread environment. Conversely, Sovereigns, Chemicals, and Metals and Mining were the worst-performing sectors, reflecting industry-specific headwinds or greater sensitivity to market sentiment.
Corporate bond gross issuance totaled $129 billion in November, with redemptions at $66 billion, resulting in net supply of $63 billion. Year-over-year, gross monthly issuance in November was up 51 percent, driven in part by elevated borrowing from the Technology sector to fund data center capital expenditures. This surge in issuance suggests a strong demand for debt capital, particularly from growth-oriented sectors.
Mutual fund and ETF flows into taxable bond funds totaled $47.1 billion for the month, per the Investment Company Institute.
SECURITIZED MARKET REVIEW
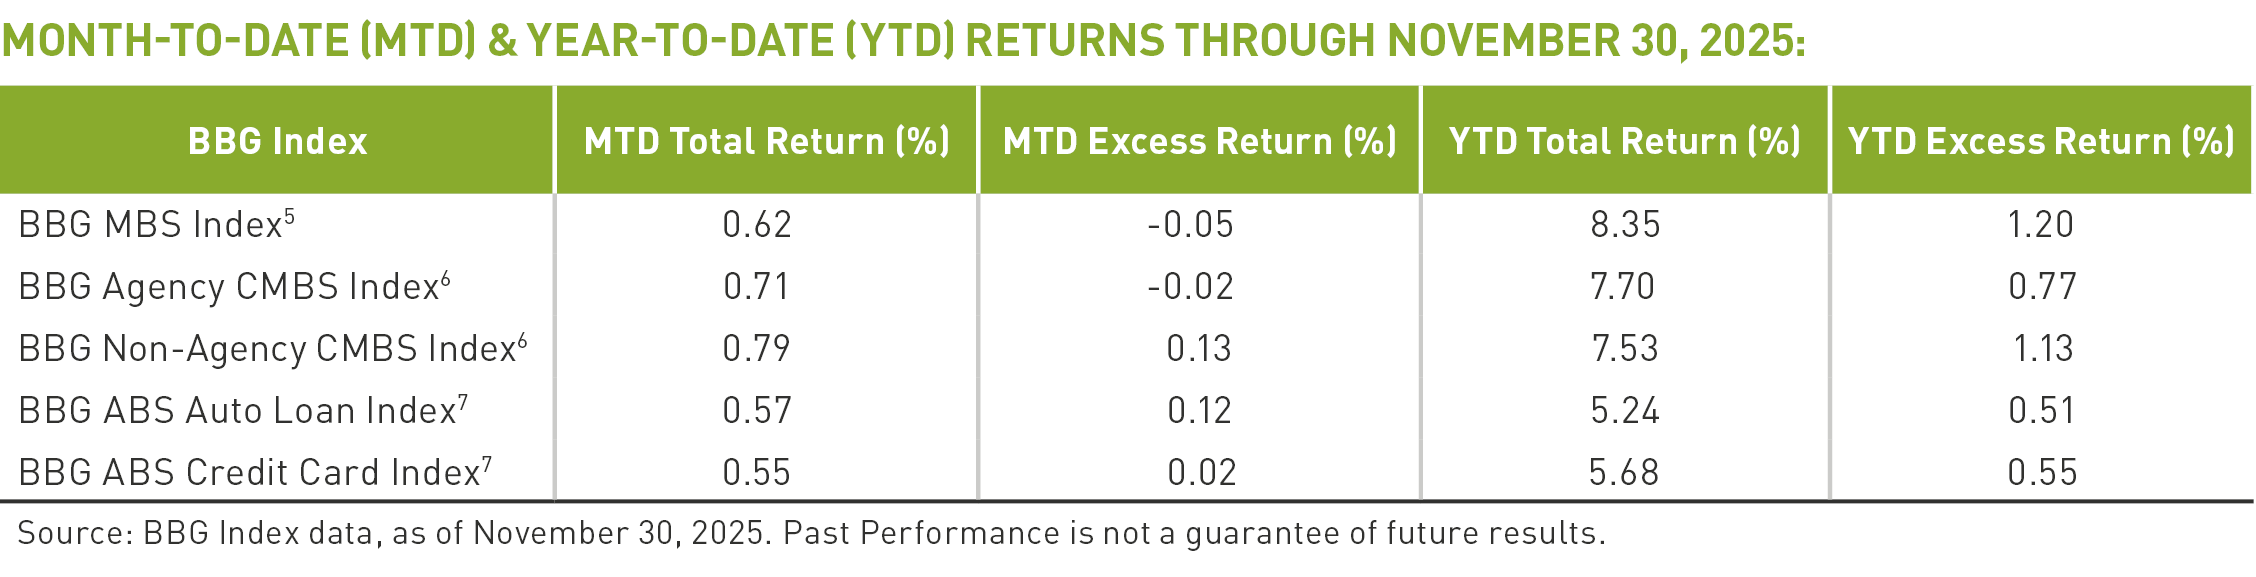
MBS generated a total return of 0.62 percent in November, though excess returns declined by 0.05 percent. Commercial MBS (CMBS) returned 0.75 percent, while Agency CMBS (ACMBS) returned 0.71 percent.
ABS posted a total return of 0.56 percent and excess returns of 0.05 percent. Auto loan ABS returned 0.57 percent, outperforming credit card ABS, which returned 0.55 percent. ABS spreads remained unchanged on the month, despite healthy issuance of $40 billion.
EQUITY MARKET REVIEW
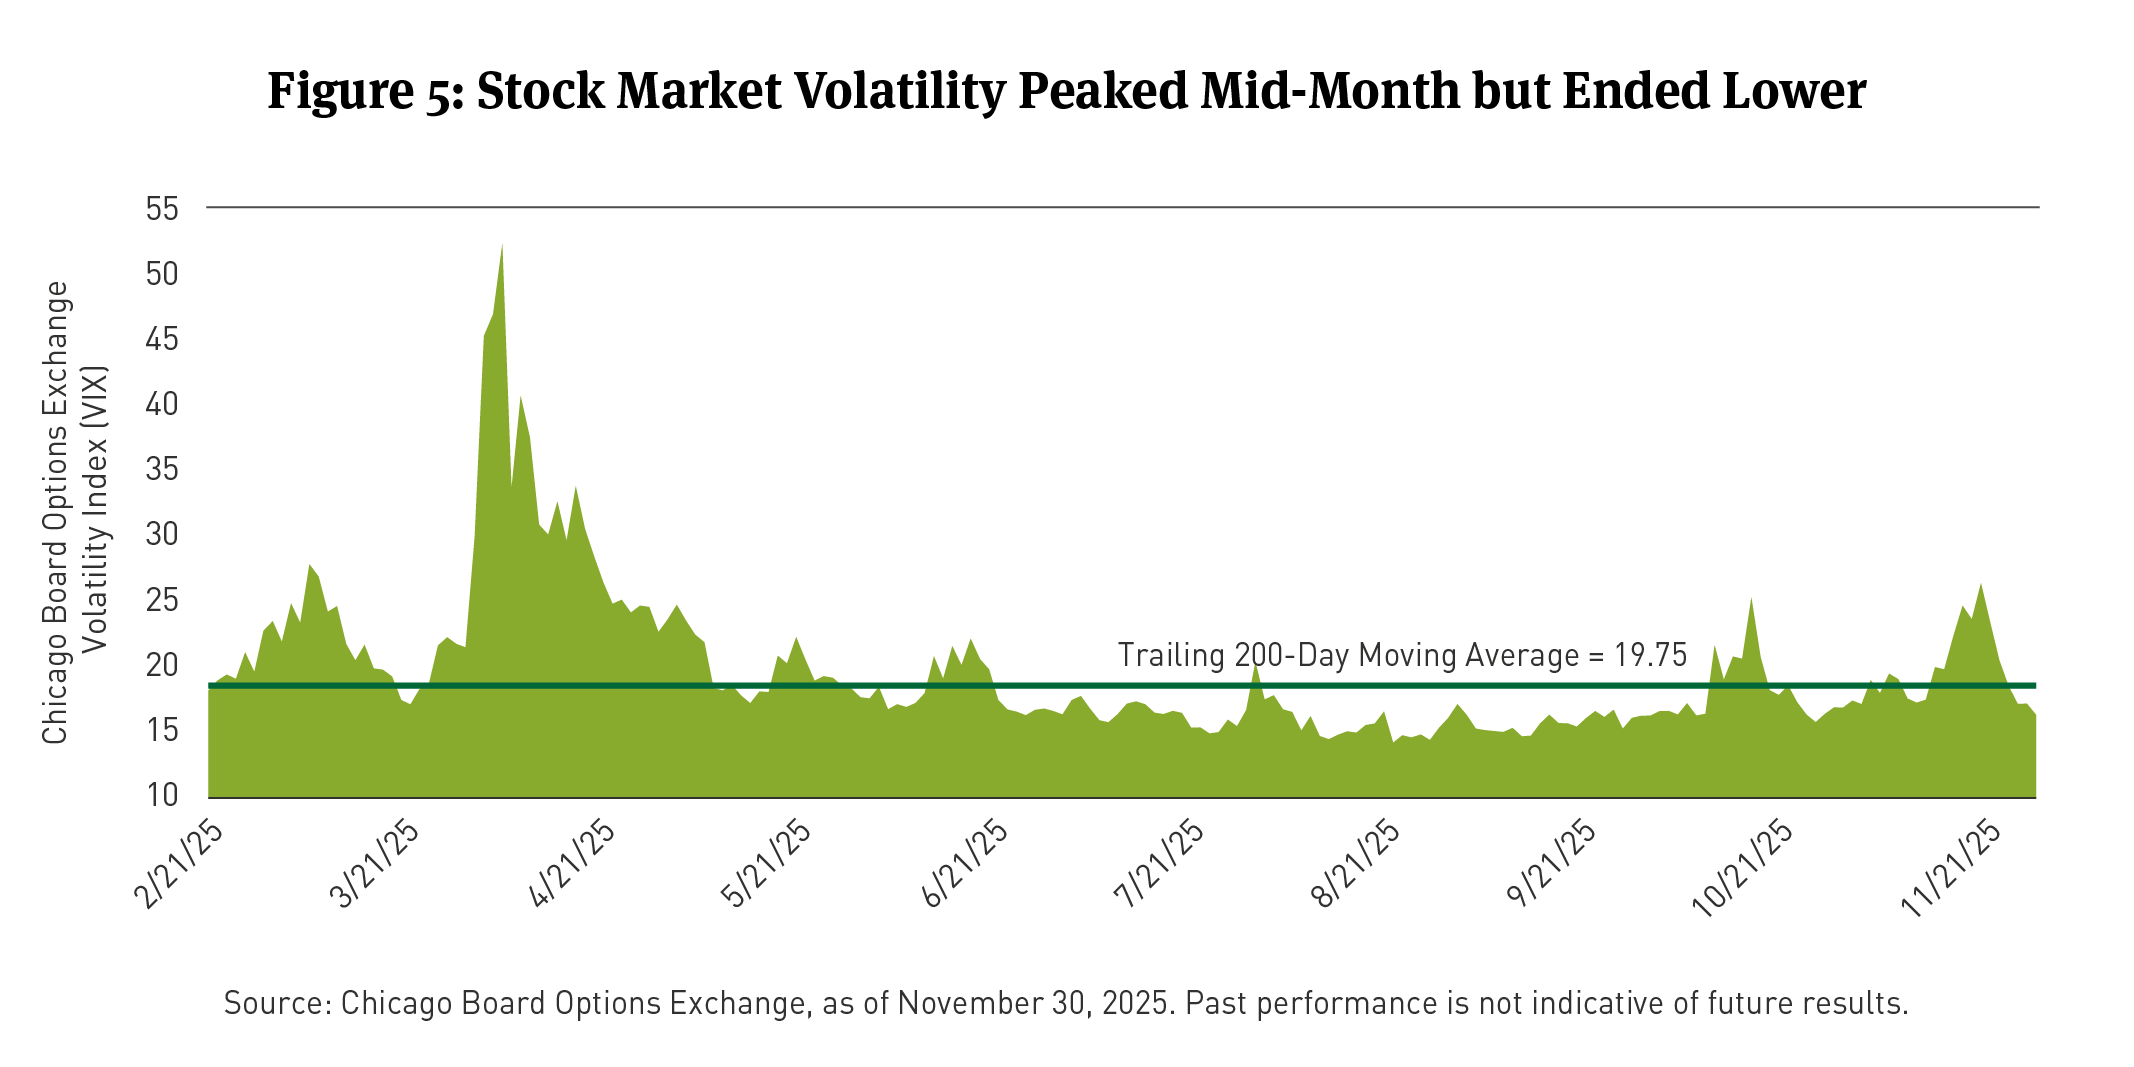
The S&P 500 Index recorded a modest total return of 0.25 percent for November. The Chicago Board Options Exchange (CBOE) Volatility Index8 (VIX), a measure of equity market volatility, reached an intramonth high not seen since April’s drawdown, temporarily exceeding the 200-day moving average of 19.75 at month-end (See Figure 5) before moderating to below that level by the end of the month.
Health Care (9.3 percent), Communication Services (6.4 percent) and Materials (4.2 percent) were the best-performing sectors. Late-month strength in growth-oriented sectors was a key driver of the overall index performance. Underperforming sectors for the month included Information Technology (-4.3 percent), Consumer Discretionary (-2.4 percent) and Industrials (-0.85 percent). The Russell 1000 Value Index9 returned 2.7 percent, while the Russell 1000 Growth Index10 declined 1.8 percent, highlighting the rotation away from growth and into defensive and value-oriented equities.
Per BBG data, Low Volatility, Value and Dividend Factors outperformed during the month, while Beta, Growth, and High Market Capitalization factors underperformed. S&P 500 returns were supported by a late-month rally, with the index gaining 3.74 percent in the final week.
[1] The Municipal/Treasury (M/T) ratio compares yields of municipals bonds with those of U.S. Treasury bonds of the same maturity. M/T ratios can show the relative value of municipal bonds compared with taxable bonds, by indicating when yields for municipal bonds exceed the after-tax yields on taxable bonds.
[2] As of November 30, 2025, as measured by the BBG U.S. Corporate Investment Grade Bond Index, an unmanaged market-value-weighted index of investment grade corporate fixed-rate debt issues with maturities of one year or more. You cannot invest directly in an index.
[3] As of November 30, 2025, based on the Intercontinental (ICE) Bank of America/Merrill Lynch Option Volatility Estimate (MOVE) Index, which tracks the movement in U.S. Treasury yield volatility implied by current prices of one-month over-the-counter options on 2-year, 5-year, 10-year and 30-year Treasuries. Historically, the index rises as concerns grow that interest rates may be higher. You cannot invest directly in an index.
[4] Municipal bond performance is as measured by the BBG Managed Money Short/Intermediate (1-10) Index, which measures the performance of the publicly traded municipal bonds that cover the USD-denominated short/intermediate term tax-exempt bond market, including state and local general obligation bonds, revenue bonds, insured bonds, and pre-refunded bonds. It is rules-based, and market-value weighted. You cannot invest directly in an index.
[5] The Bloomberg MBS Index tracks agency mortgage-backed pass-through securities (both fixed-rate and hybrid ARM) guaranteed by government-sponsored enterprises (GSEs) Government National Mortgage Association (Ginnie Mae) (GNMA), Federal National Mortgage Association (Fannie Mae) (FNMA), and Federal Home Loan Mortgage Corporation (Freddie Mac) (FHLMC). The index is constructed by grouping individual pools into aggregates or generics based on program, coupon, and vintage. You cannot invest directly in an index.
[6] The Bloomberg U.S. CMBS Investment Grade Index measures the market of U.S. Agency (GNMA, FNMA, and (FHLMC) and U.S. Non-Agency conduit and fusion CMBS deals with a minimum current deal size of $300mn. You cannot invest directly in an index.
[7] Bloomberg U.S. Asset-Backed Securities (ABS) Index is the ABS component of the Bloomberg U.S. Aggregate Bond Index, a flagship measure of the U.S. investment grade, fixed-rate bond market. The ABS index has three subsectors: credit and credit cards, autos, and utility. You cannot invest directly in an index.
[8] The Chicago Board Options Exchange (OEX) Volatility (VIX) Index is the ticker symbol and name for the Chicago Board Options Exchange's (CBOE) Volatility Index, a measure of the stock market's expectation of volatility based on S&P 500 index options. You cannot invest directly in an index.
[9] The Russell 1000® Value Index is an unmanaged market capitalization-weighted index of value-oriented stocks of U.S. domiciled companies that are included in the Russell 1000 Index. Value-oriented stocks tend to have lower price-to-book ratios and lower forecasted growth values. You cannot invest directly in an index.
[10] The Russell 1000® Growth Index is an unmanaged market capitalization-weighted index of growth-oriented stocks of U.S. domiciled companies that are included in the Russell 1000 Index. Growth-oriented stocks tend to have higher price-to-book ratios and higher forecasted growth values. You cannot invest directly in an index.
BCAI-12042025-ji5imd9m (12/8/2025)
DISCLAIMERS:
This material provides general information and should not be construed as a solicitation or offer of services or products or as legal, tax or investment advice. Nothing contained herein should be considered a guide to security selection, asset allocation or portfolio construction.
All information and opinions are current as of the dates indicated and are subject to change. Breckinridge believes the data provided by unaffiliated third parties to be reliable but investors should conduct their own independent verification prior to use. Some economic and market conditions contained herein have been obtained from published sources and/or prepared by third parties, and in certain cases have not been updated through the date hereof.
There is no assurance that any estimate, target, projection or forward-looking statement (collectively, “estimates”) included in this material will be accurate or prove to be profitable; actual results may differ substantially. Breckinridge estimates are based on Breckinridge’s research, analysis and assumptions. Other events that were not considered in formulating such projections could occur and may significantly affect the outcome, returns or performance.
Not all securities or issuers mentioned represent holdings in client portfolios. Some securities have been provided for illustrative purposes only and should not be construed as investment recommendations. Any illustrative engagement or sustainability analysis examples are intended to demonstrate Breckinridge’s research and investment process.
Yields and other characteristics are metrics that can help investors in valuing a security, portfolio or composite. Yields do not represent performance results but they are one of several components that contribute to the return of a security, portfolio or composite. Yields and other characteristics are presented gross of advisory fees.
All investments involve risk, including loss of principal. No investment or risk management strategy, including diversification, can guarantee positive results or risk elimination in any market. Periods of elevated market volatility can significantly impact the value of securities. Investors should consult with their advisors to understand how these risks may affect their portfolios and to develop a strategy that aligns with their financial goals and risk tolerances.
Past performance is not indicative of future results. Breckinridge makes no assurances, warranties or representations that any strategies described herein will meet their investment objectives or incur any profits. Performance results for Breckinridge’s investment strategies include the reinvestment of interest and any other earnings, but do not reflect any brokerage or trading costs a client would have paid. Results may not reflect the impact that any material market or economic factors would have had on the accounts during the time period. Due to differences in client restrictions, objectives, cash flows, and other such factors, individual client account performance may differ substantially from the performance presented.
Actual client advisory fees may differ from the advisory fee used to calculate net performance results. Client returns will be reduced by the advisory fees and any other expenses incurred in the management of their accounts. For example, an advisory fee of 1 percent compounded over a 10-year period would reduce a 10 percent return to a 9 percent annual return. Additional information on fees can be found in Breckinridge’s Form ADV Part 2A.
Index results are shown for illustrative purposes and do not represent the performance of any specific investment. Indices are unmanaged and investors cannot directly invest in them. They do not reflect any management, custody, transaction or other expenses, and generally assume reinvestment of dividends, income and capital gains. Performance of indices may be more or less volatile than any investment strategy.
Fixed income investments have varying degrees of credit risk, interest rate risk, default risk, and prepayment and extension risk. In general, bond prices rise when interest rates fall and vice versa.
Equity investments are volatile and can decline significantly in response to investor reception of the issuer, market, economic, industry, political, regulatory or other conditions.
BLOOMBERG® is a trademark and service mark of Bloomberg Finance L.P. and its affiliates (collectively “Bloomberg”). Bloomberg does not approve or endorse this material or guarantees the accuracy or completeness of any information herein, or makes any warranty, express or implied, as to the results to be obtained therefrom and, to the maximum extent allowed by law, neither shall have any liability or responsibility for injury or damages arising in connection therewith.
The S&P500 Index (“Index”) and associated data is a product of S&P Dow Jones Indices LLC, its affiliates and/or their licensors and has been licensed for use by Breckinridge. © 2025 S&P Dow Jones Indices LLC, its affiliates and/or their licensors. All rights reserved. Redistribution or reproduction in whole or in part are prohibited without written permission of S&P Dow Jones Indices LLC. For more information on any of S&P Dow Jones Indices LLC’s indices please visit www.spdji.com. S&P® is a registered trademark of Standard & Poor’s Financial Services LLC (“SPFS”) and Dow Jones® is a registered trademark of Dow Jones Trademark Holdings LLC (“Dow Jones”). Neither S&P Dow Jones Indices LLC, SPFS, Dow Jones, their affiliates nor their licensors (“S&P DJI”) make any representation or warranty, express or implied, as to the ability of any index to accurately represent the asset class or market sector that it purports to represent and S&P DJI shall have no liability for any errors, omissions, or interruptions of any index or the data included therein.