Equities
Perspective published on June 26, 2025
Navigating the Risks: High Payout Ratios and Stable Dividend Income
Summary
- We believe payout ratio is a critical metric in evaluating dividend-paying securities and avoiding the potential pitfalls associated with targeting solely high dividend yield.
- Payout ratio may provide a more forward-looking assessment of a company’s ability to sustain and grow dividend payments over time.
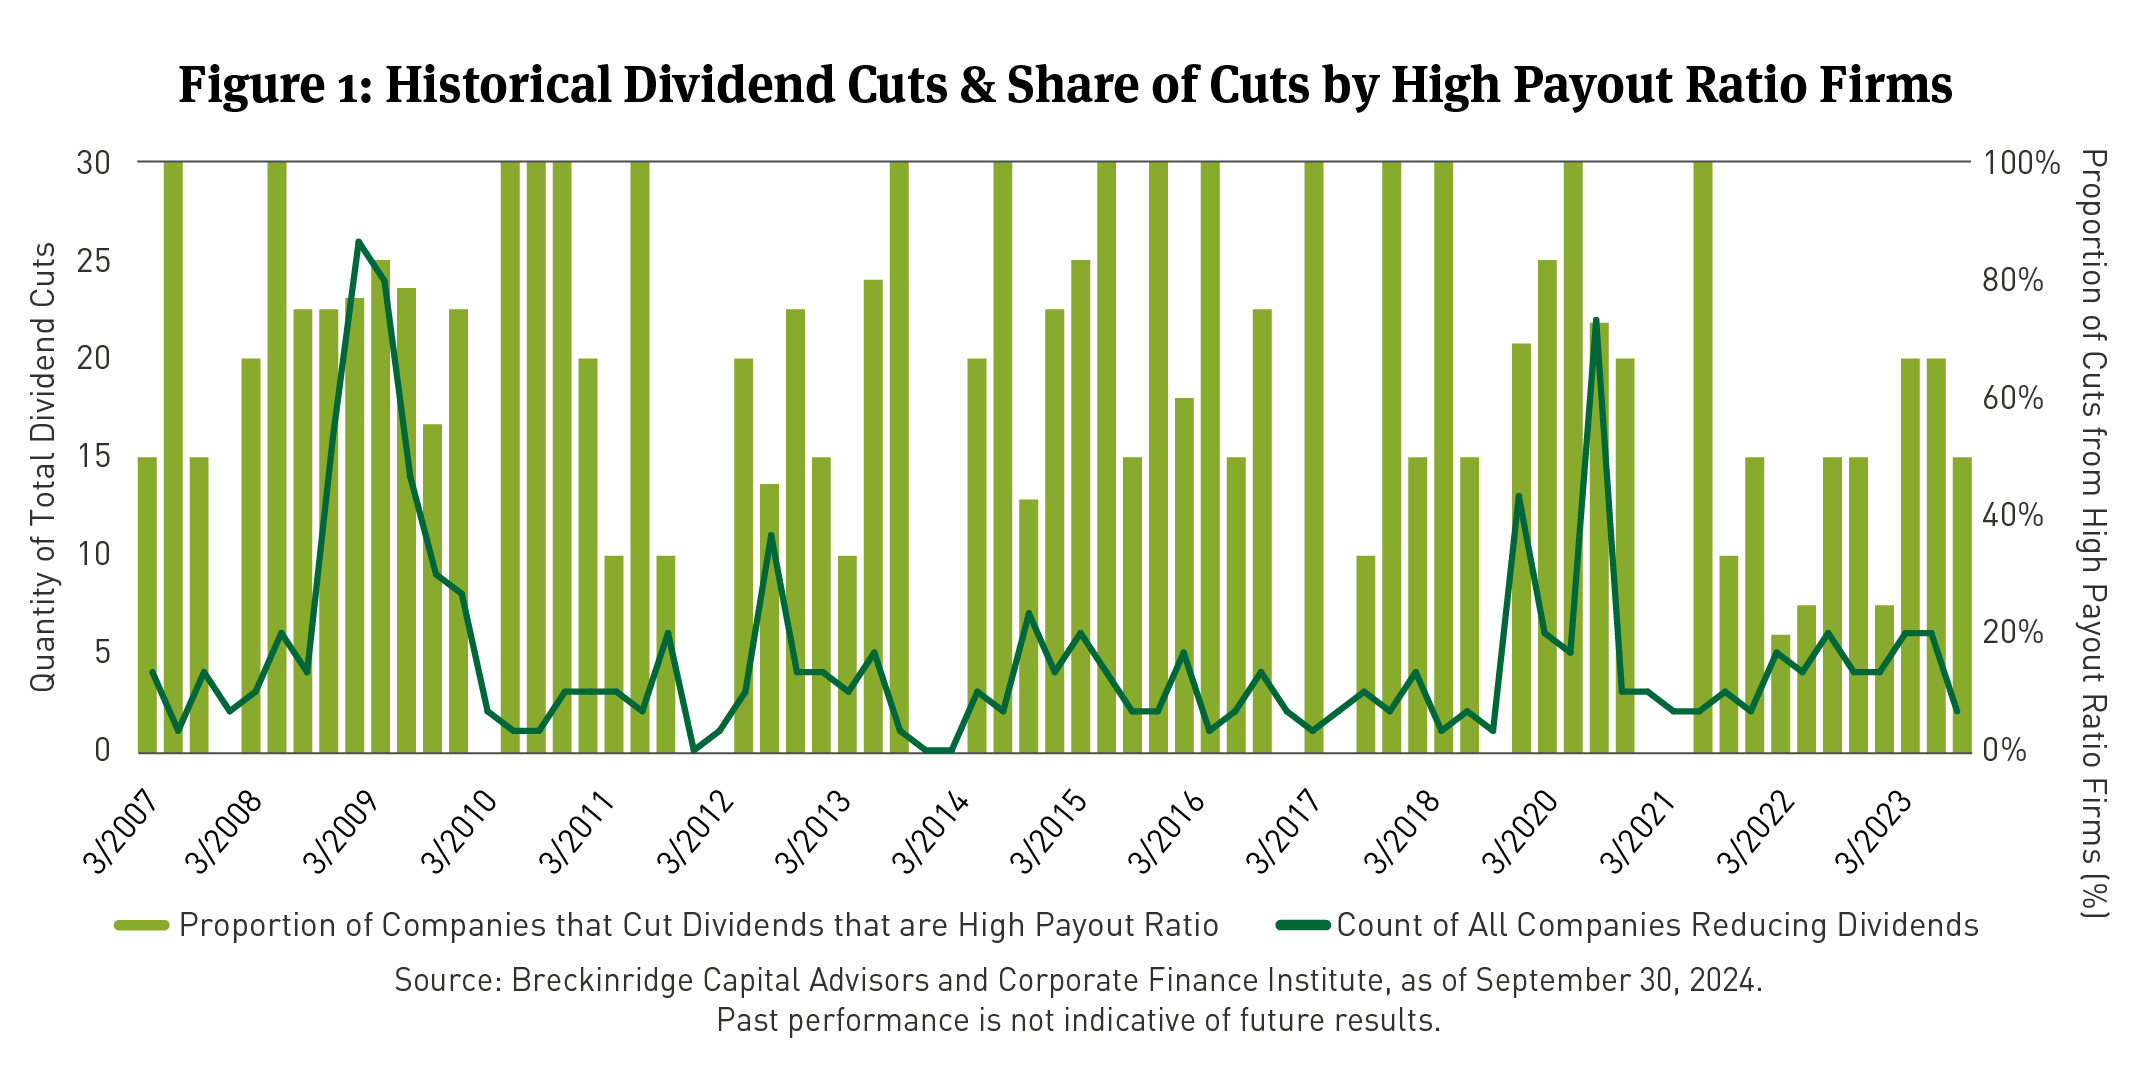
- Since the global financial crisis, a disproportionate number of total dividend cuts have been made by firms with the highest payout ratios.
- We believe prioritizing lower payout ratios is an important factor in identifying financially healthy firms that are poised to be robust dividend payers over time.
Dividend Yields Catch Attention, Payout Ratios Offer Insight
In our paper Looking Beyond Yield for Stable Dividend Income, we discussed evidence that suggests high dividend yield, while appearing attractive, may ultimately disappoint investors through lower-than-expected income returns as well as less potential for long-term capital appreciation when compared to lower dividend-yield equities.
We believe a key component of this phenomenon is attributable to high and consequently, unsustainable payout ratios at many of these firms. Payout ratio measures a firm’s dividend payments as a proportion of its earnings. Ultimately, payout ratios provide a snapshot of the level of financial burden that a dividend has on a firm and is useful in measuring the capacity of the company to continue and potentially grow payments over time.
High Payout-Ratio Firms Are Vulnerable To Financial Strain
High payout ratios suggest a firm may have less organic capacity to continue to pay dividends. For high payout ratio firms, deteriorating profitability may prompt them to issue additional debt to cover dividend payments, thereby increasing financial leverage and potentially diminishing future financial flexibility, or they consider cutting dividends outright.
Firms that have high payout ratios with inadequate free cash flow to cover dividend payments, which is a common characteristic of the cohort, must assess the trade-off between maintaining dividends at the cost of increased debt expense and potentially lower credit ratings or confronting the tough decision to reduce or eliminate dividends, which is a strong negative signal to investors about the future prospects of the firm.
Historically, dividends originating from high payout ratio firms have proven to be quite susceptible to cuts. In instances when firms reduced dividends, approximately 60 percent of those occurrences stemmed from the highest payout ratio cohort (See Figure 1). Since 2007, in nearly 25 percent of the occurrences when a company reduced dividends, that company was in both the highest dividend-yield and highest payout ratio cohorts. Additionally, the average dividend cut in those instances was significant, at 36 percent.
These charts are based on the data used in our analysis of monthly index returns for the period January 1994 to September 30, 2024. The analysis is intended to illustrate that equity dividend yields are not as reliable predictors of realized income returns as bonds, especially at higher dividend yields. Historically, investment grade (IG) bonds have a low default rate compared to non-IG bonds. For example, S&P Global reported that the highest one-year default rates for AAA, AA, A, and BBB-rated bonds (IG bonds) were 0 percent, 0.38 percent, 0.39 percent, and 1.02 percent, respectively. It can be contrasted with the maximum one-year default rate for BB, B, and CCC/C-rated bonds (non-IG bonds) of 4.22 percent, 13.84 percent, and 49.28 percent, respectively. Yields are snapshot metrics for securities that can help investors in valuing a security, portfolio or strategy. Yields do not represent performance results but are one of several components that contribute to the return for a security, portfolio or strategy.
High Payout-Ratio Companies Are Most at Risk When the Market Is in Peak Stress
Interestingly and perhaps intuitively, our research shows companies with the highest payout ratios underperform the most when the market is in peak stress, suggesting that the income stream isn’t the only component of returns at risk amid stressful environments (See Figure 2).
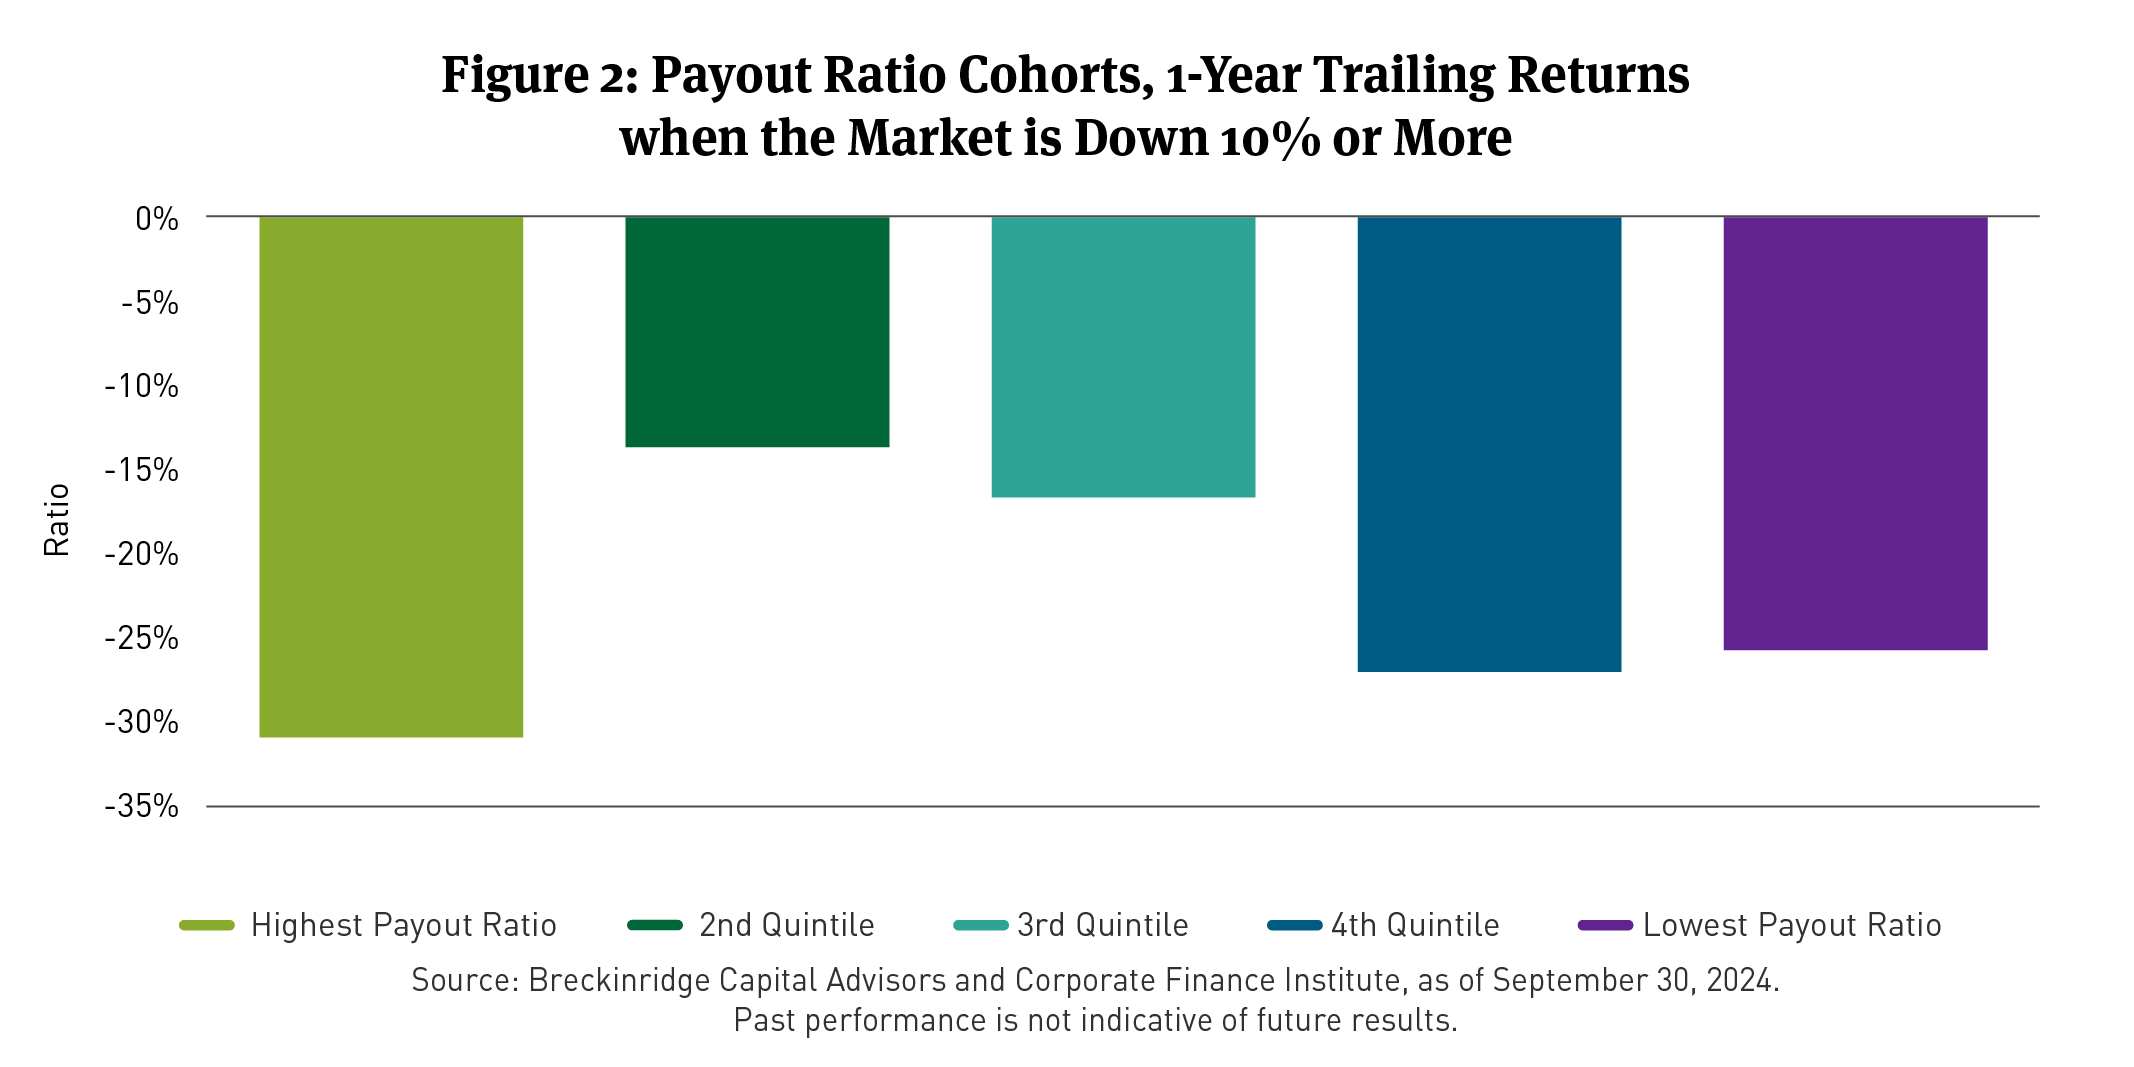
During large market sell-offs, defined here as when the trailing 12-month return of the S&P 500 Index1 is negative by 10 percent or more, companies with the highest payout ratios have materially underperformed other companies with lower ratios in terms of absolute returns. We believe the underperformance stems from both dividend cuts and concerns about longer-term stress on these companies. Those concerns may include diminished profitability and cash flow generation ability, which reduces the ability of these companies to sustain or grow dividends, as well as a diminished ability to re-invest in the business.
We View Firms with Reasonable Levels of Dividend Payouts As Positioned Well Over the Long Run
Payout ratio, though at times receiving less attention from investors, is an invaluable tool to assess the health of a company’s dividend payments. Dividend-paying equities are often a strategic allocation decision within a portfolio, suggesting that exposure to companies with sustainable payout ratios is a key investment criteria.
At Breckinridge, we focus on building high quality portfolios, placing significant emphasis on firms that have historically shown themselves strong stewards of their investors’ capital. We believe elevated dividend yields paired with reasonable levels of payout, relative to earnings, is a key building block of high quality equity portfolios.
[1] The S&P 500 Index consists of 500 stocks chosen for market size, liquidity, and industry group representation. Itis a market-value-weighted index with each stock’s weight in the index proportionate to its market value. You cannot invest directly in an index.
BCAI-06232025-r9vw7pjf 6/25/2025
DISCLAIMERS:
The content is intended for investment professionals and institutional investors.
This material provides general information and should not be construed as a solicitation or offer of services or products or as legal, tax or investment advice. Nothing contained herein should be considered a guide to security selection, asset allocation or portfolio construction.
All information and opinions are current as of the dates indicated and are subject to change. Breckinridge believes the data provided by unaffiliated third parties to be reliable but investors should conduct their own independent verification prior to use. Some economic and market conditions contained herein have been obtained from published sources and/or prepared by third parties, and in certain cases have not been updated through the date hereof.
There is no assurance that any estimate, target, projection or forward-looking statement (collectively, “estimates”) included in this material will be accurate or prove to be profitable; actual results may differ substantially. Breckinridge estimates are based on Breckinridge’s research, analysis and assumptions. Other events that were not considered in formulating such projections could occur and may significantly affect the outcome, returns or performance.
Not all securities or issuers mentioned represent holdings in client portfolios. Some securities have been provided for illustrative purposes only and should not be construed as investment recommendations. Any illustrative engagement or sustainability analysis examples are intended to demonstrate Breckinridge’s research and investment process.
Yields and other characteristics are metrics that can help investors in valuing a security, portfolio or composite. Yields do not represent performance results but they are one of several components that contribute to the return of a security, portfolio or composite. Yields and other characteristics are presented gross of advisory fees.
All investments involve risk, including loss of principal. No investment or risk management strategy, including diversification, can guarantee positive results or risk elimination in any market. Periods of elevated market volatility can significantly impact the value of securities. Investors should consult with their advisors to understand how these risks may affect their portfolios and to develop a strategy that aligns with their financial goals and risk tolerances.
Past performance is not indicative of future results. Breckinridge makes no assurances, warranties or representations that any strategies described herein will meet their investment objectives or incur any profits. Performance results for Breckinridge’s investment strategies include the reinvestment of interest and any other earnings, but do not reflect any brokerage or trading costs a client would have paid. Results may not reflect the impact that any material market or economic factors would have had on the accounts during the time period. Due to differences in client restrictions, objectives, cash flows, and other such factors, individual client account performance may differ substantially from the performance presented.
Actual client advisory fees may differ from the advisory fee used to calculate net performance results. Client returns will be reduced by the advisory fees and any other expenses incurred in the management of their accounts. For example, an advisory fee of 1 percent compounded over a 10-year period would reduce a 10 percent return to a 9 percent annual return. Additional information on fees can be found in Breckinridge’s Form ADV Part 2A.
Index results are shown for illustrative purposes and do not represent the performance of any specific investment. Indices are unmanaged and investors cannot directly invest in them. They do not reflect any management, custody, transaction or other expenses, and generally assume reinvestment of dividends, income and capital gains. Performance of indices may be more or less volatile than any investment strategy.
There is no guarantee that the strategies or approaches discussed will achieve their objectives, lower volatility or be profitable. All investments involve risk, including loss of principal. Diversification cannot assure a profit or protect against loss. No investment or risk management strategy can guarantee positive results or risk elimination in any market.
Fixed income investments have varying degrees of credit risk, interest rate risk, default risk, and prepayment and extension risk. In general, bond prices rise when interest rates fall and vice versa.
Equity investments are volatile and can decline significantly in response to investor reception of the issuer, market, economic, industry, political, regulatory or other conditions.
When integrating sustainability analysis with traditional financial analysis, Breckinridge’s investment team will consider material sustainability factors but may conclude that other attributes outweigh the sustainability considerations when making investment decisions.
There is no guarantee that integrating sustainability analyses will improve risk-adjusted returns, lower portfolio volatility over any specific time period, or outperform the broader market or other strategies that do not utilize these analyses when selecting investments. The consideration of sustainability factors may limit investment opportunities available to a portfolio. In addition, data for sustainable factors often lacks standardization, consistency and transparency and for certain companies such data may not be available, complete or accurate.
Breckinridge’s sustainability analysis is based on third party data and Breckinridge analysts’ internal analysis. Analysts will review a variety of sources such as corporate sustainability reports, data subscriptions, and research reports to obtain available metrics for internally developed frameworks. A high sustainability rating does not mean it will be included in a portfolio, nor does it mean that a bond will provide profits or avoid losses.
Investments in thematic customizations will subject the portfolio to proportionately higher risk exposure of any sectors or regions in which the investments target. In addition, the investments held in thematic customizations may not meet the desired positive impact or become subject to negative publicity; these types of events may cause the customizations to have poor performance due to the concentration of assets. There is no assurance that the customizations or the strategies will meet their objectives.
BLOOMBERG® is a trademark and service mark of Bloomberg Finance L.P. and its affiliates (collectively “Bloomberg”). Bloomberg does not approve or endorse this material or guarantees the accuracy or completeness of any information herein, or makes any warranty, express or implied, as to the results to be obtained therefrom and, to the maximum extent allowed by law, neither shall have any liability or responsibility for injury or damages arising in connection therewith.
Solactive AG ("Solactive") is the licensor of Breckinridge Sustainable Dividend Income Index and Breckinridge Dividend Income Index (the "Indices"). The financial instruments that are based on the Indices are not sponsored, endorsed, promoted or sold by Solactive in any way and Solactive makes no express or implied representation, guarantee or assurance with regard to: (a) the advisability in investing in the financial instruments; (b) the quality, accuracy and/or completeness of the Indices; and/or (c) the results obtained or to be obtained by any person or entity from the use of the Indices. Solactive reserves the right to change the methods of calculation or publication with respect to the Indices. Solactive shall not be liable for any damages suffered or incurred as a result of the use (or inability to use) of the Indices.
The S&P500 Index (“Index”) and associated data is a product of S&P Dow Jones Indices LLC, its affiliates and/or their licensors and has been licensed for use by Breckinridge. © 2024 S&P Dow Jones Indices LLC, its affiliates and/or their licensors. All rights reserved. Redistribution or reproduction in whole or in part are prohibited without written permission of S&P Dow Jones Indices LLC. For more information on any of S&P Dow Jones Indices LLC’s indices please visit www.spdji.com. S&P® is a registered trademark of Standard & Poor’s Financial Services LLC (“SPFS”) and Dow Jones® is a registered trademark of Dow Jones Trademark Holdings LLC (“Dow Jones”). Neither S&P Dow Jones Indices LLC, SPFS, Dow Jones, their affiliates nor their licensors (“S&P DJI”) make any representation or warranty, express or implied, as to the ability of any index to accurately represent the asset class or market sector that it purports to represent and S&P DJI shall have no liability for any errors, omissions, or interruptions of any index or the data included therein.