Equities
Perspective published on September 24, 2025
Maximizing Long-Term Equity Income Potential Is About Dividend Growth, Not Dividend Yield
Summary
- For investors seeking higher long-term income and capital appreciation, a company’s dividend growth rate can be a more important consideration than its dividend yield.
- A preference for high dividend growth has materially different implications for sector allocations when compared to focus on high dividend yield.
- When compared to other fundamentals, Return on Equity (ROE) provides an effective lens into identifying high quality companies that exhibit sustainable dividend growth.
For long-term investors, prioritizing strong dividend growth rates over elevated dividend yields can result in materially higher levels of income in later years and greater account balances, all else held equal.*
Consider the following scenario. An investor with $100,000 to invest is weighing two strategies and each strategy exhibits annualized price returns of 7 percent:
- Strategy 1 offers a 1.8 percent dividend yield with annual dividend growth of 12 percent.
- Strategy 2 has a dividend yield of 2.7 percent and annual dividend growth of 6.6 percent.
Higher long-term income, account balances favor strong dividend growth rates
Despite Strategy 2’s higher starting dividend yield, Strategy 1 generated a level of income that exceeds that of Strategy 2 by the end of year 10.
By year 30, the annual income generated by Strategy 1 is nearly triple that of Strategy 2 (See Figure 1).
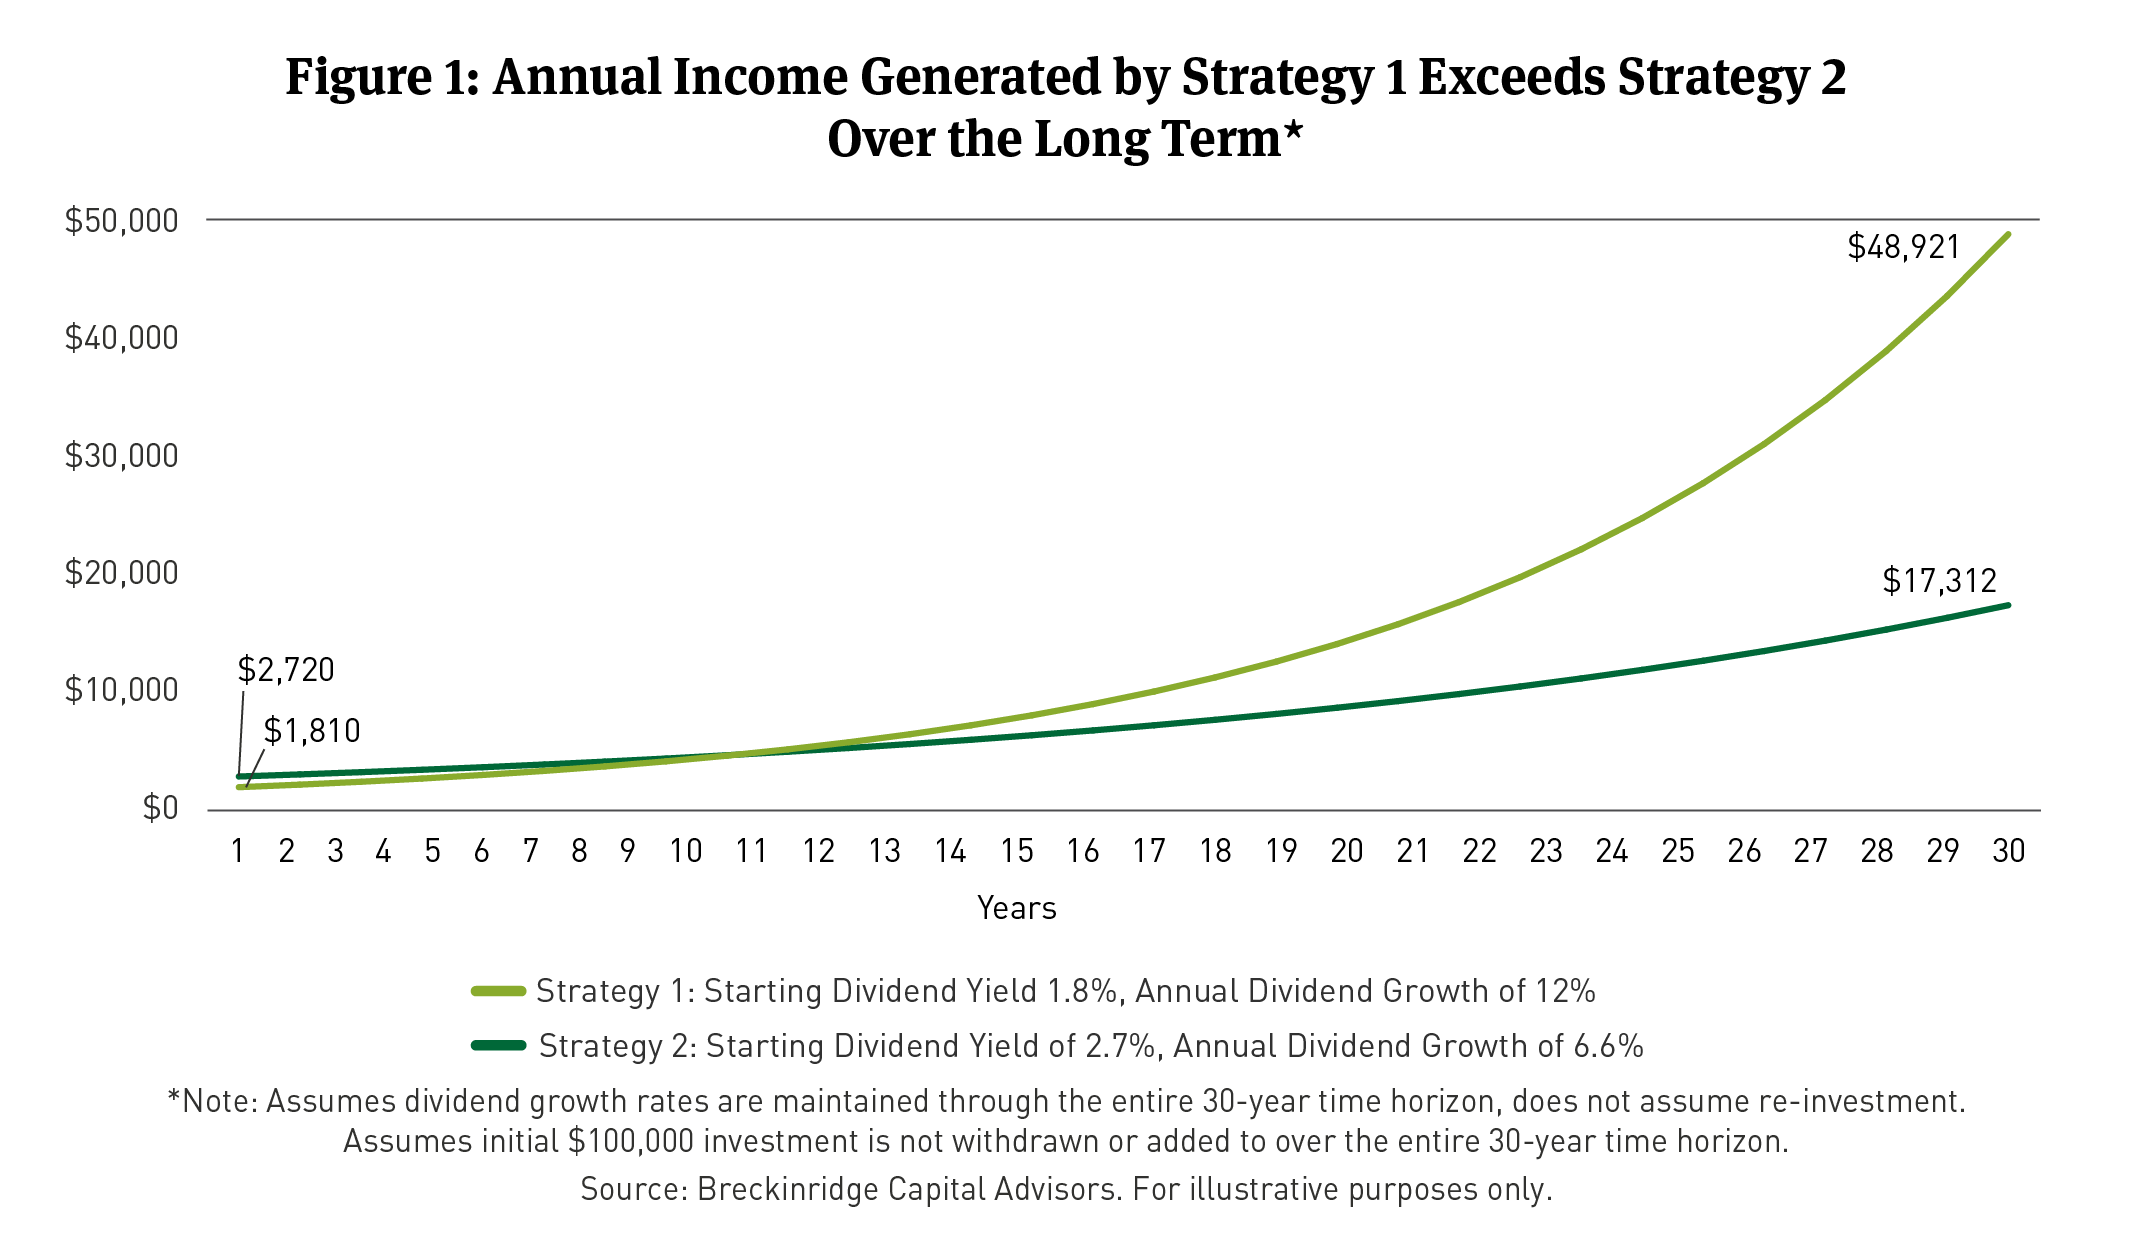
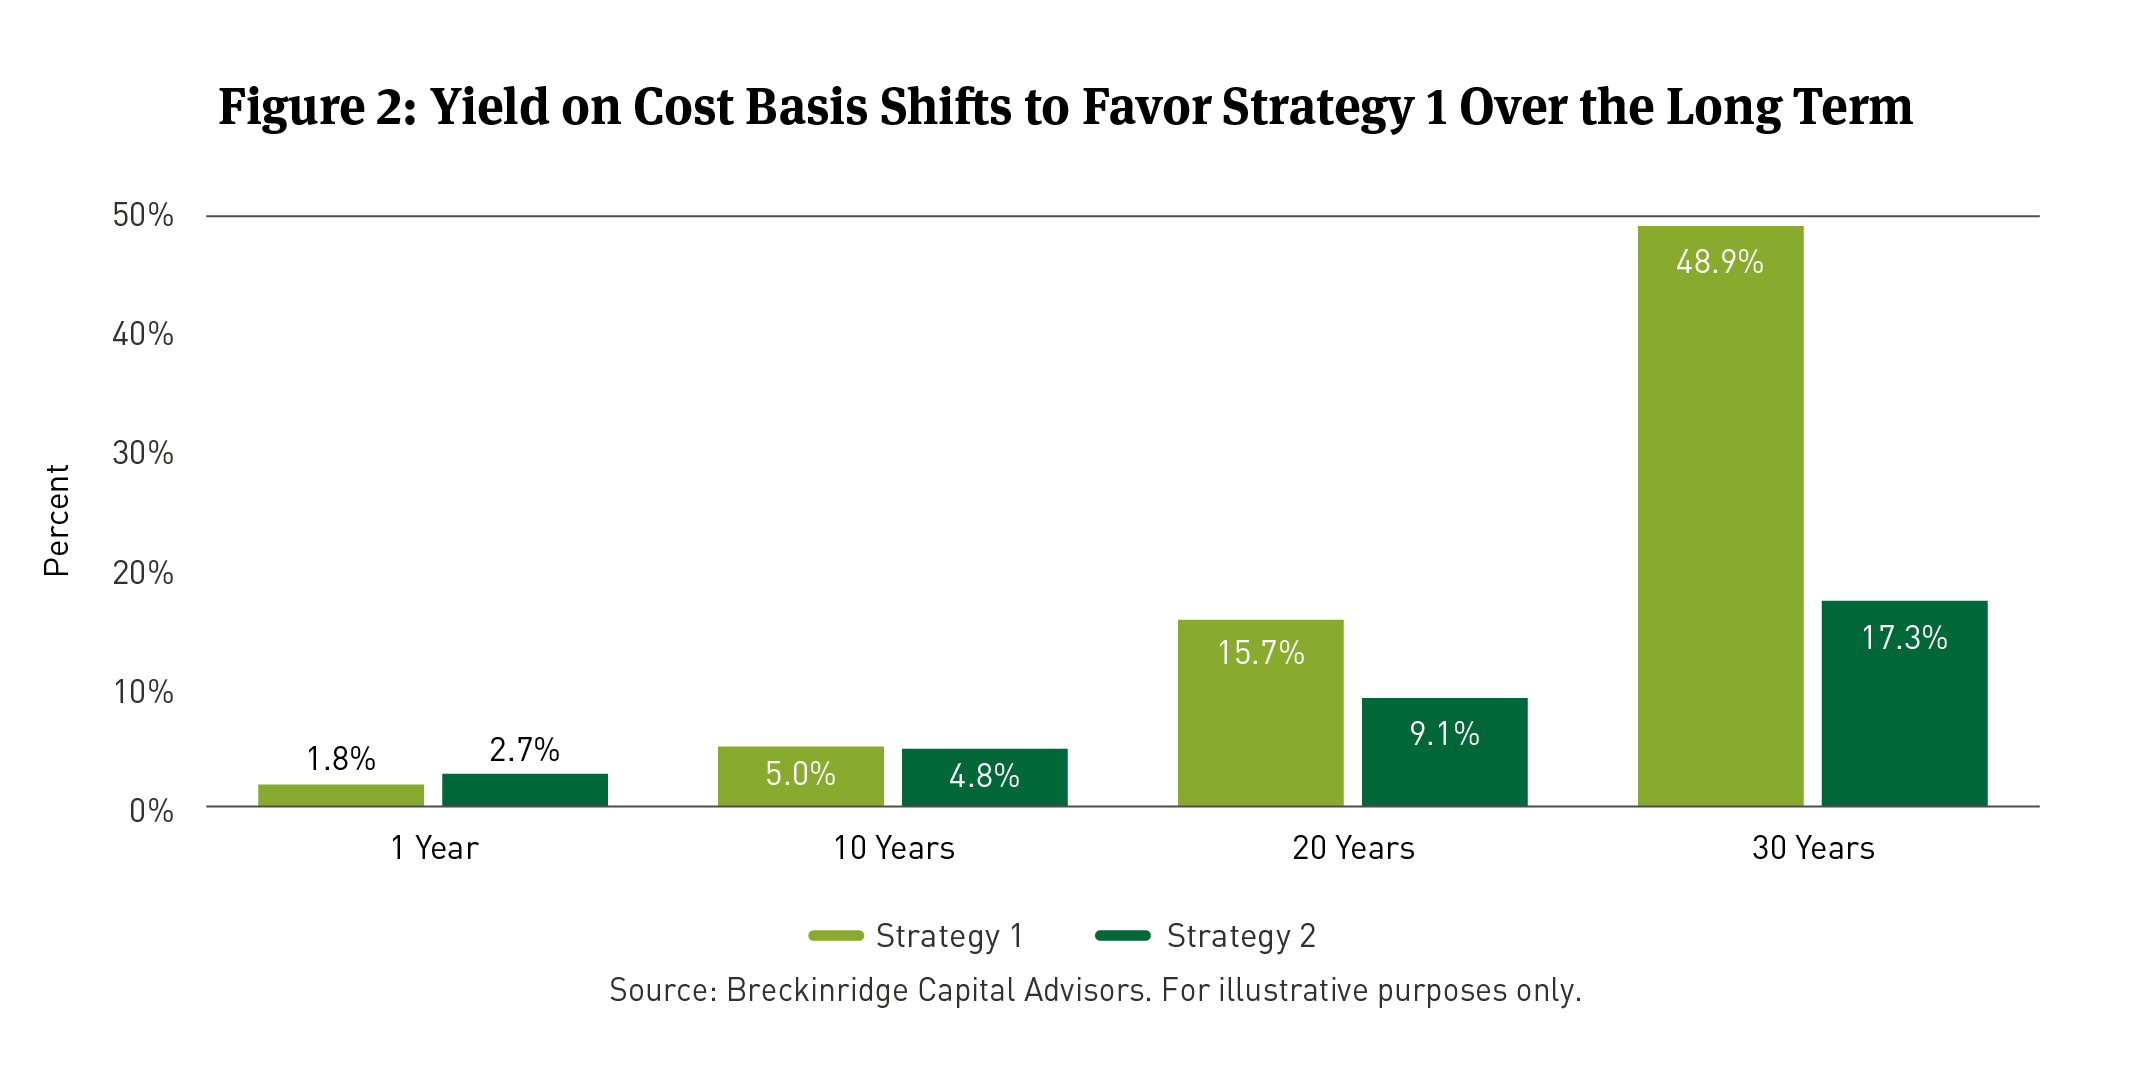
Although Strategy 2’s higher beginning dividend yield in the example generated marginally higher income in years one through nine, the book yield, or yield on cost (YOC) basis,1 significantly lags Strategy 1 in later periods (See Figure 2).
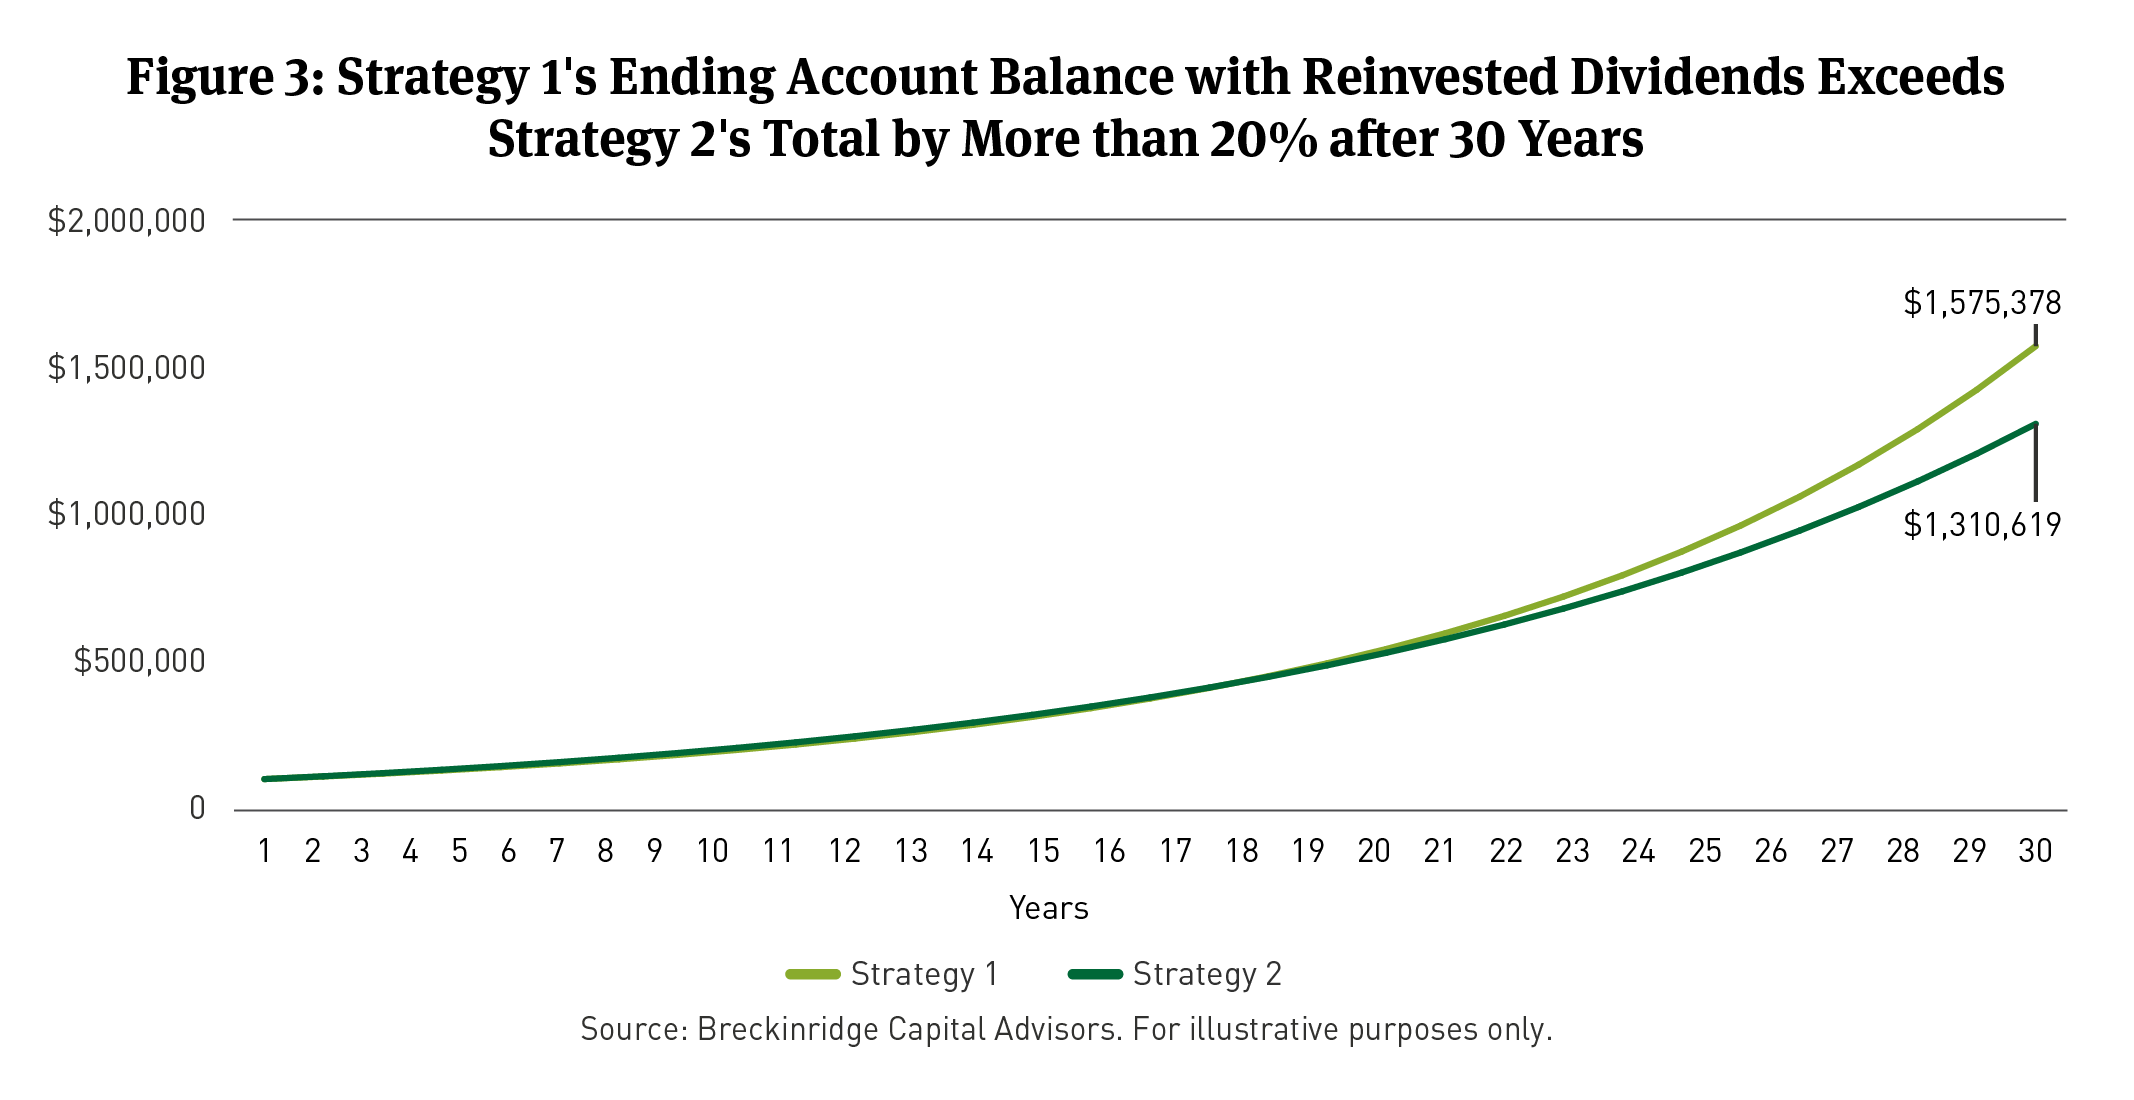
Should an investor choose to reinvest dividends, the break-even point is at about 16 years, when the ending account balance of each strategy would be roughly equal. Because of Strategy 2’s higher beginning dividend yield , reinvested income is higher in years one through nine.
The compounding effect of the time value of money2 results in higher account balances in earlier years, as more income is reinvested. However, the account balance in Strategy 1 begins to exceed that of Strategy 2 by the end of year 17. By the end of a 30-year investment horizon, Strategy 1’s ending account balance is more than 20 percent higher than Strategy 2 (See Figure 3).
Dividend growth and dividend yield may point to different sector allocations
Prioritizing high dividend yielding stocks over high dividend growers often results in different sector preferences. A bias to higher dividend yield often results in exposure to companies in mature industries such as Energy and Utilities. On the other hand, higher dividend growth measures tend to result in higher exposures to Healthcare and Information Technology. Investors with longer time horizons can benefit from higher exposures to growth-oriented companies with a track record of sustainable dividend increases.
High Return on Equity (ROE) is an indicator of high dividend growth
ROE is a measure of capital efficiency that outlines profit per dollar of equity capital invested. Firms that are consistently generating high ROE are better positioned to achieve strong dividend growth over time.
Historically, there has been a strong positive correlation between firms that have high dividend growth rates and high ROE, whereas there has been an inverse relationship between firms with high dividend yields and those with high dividend growth.
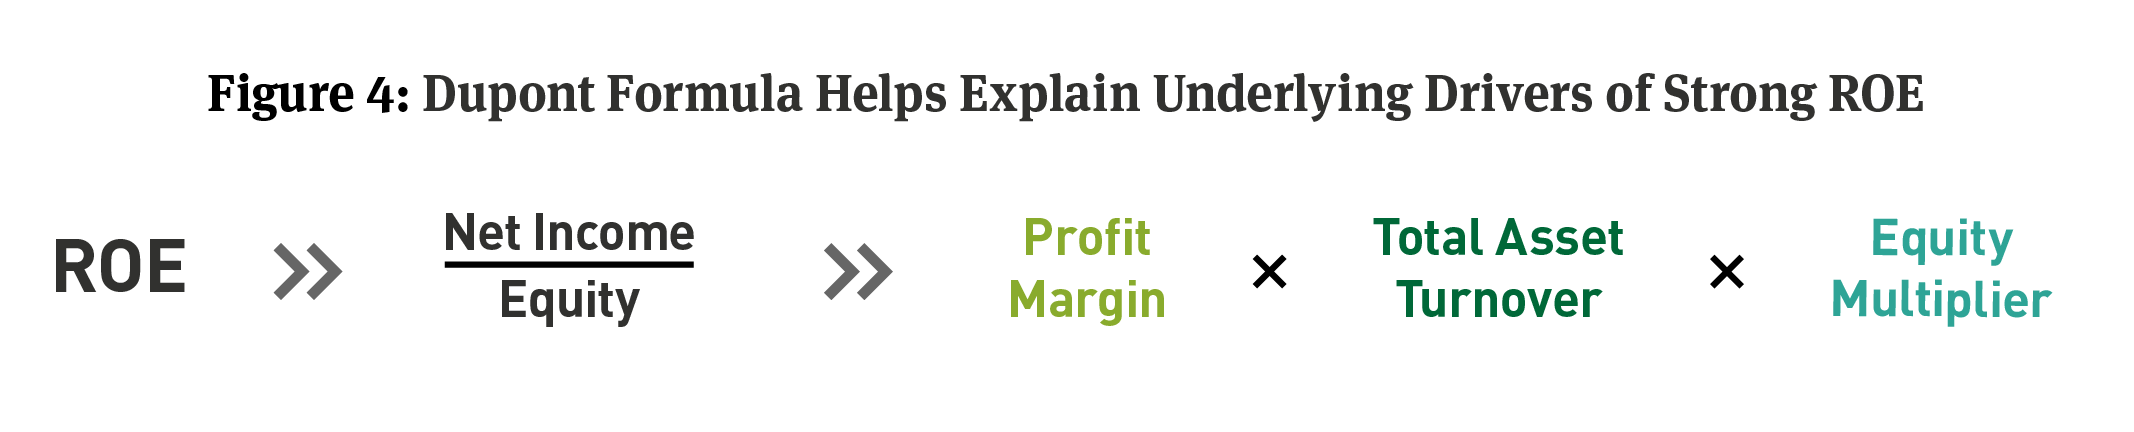
While understanding these fundamental correlations are a useful starting point, they can break down for a variety of reasons, such as elevated use of leverage, inadequate free cash flow or weak liquidity. A decomposition of ROE through the use of the DuPont Formula3 can help to better frame the drivers behind firms that exhibit strong capital efficiency.
The key takeaway is that high ROE reflects the prudent use of capital and should be considered a baseline requirement for high dividend growth, but ultimately dividend payout decisions are influenced by additional factors including a firm’s financial policy, growth prospects and cash flows that are often captured through a company’s fundamental credit rating.
The Breckinridge perspective on dividend investing
Dividend growth rates can vary from year to year because companies may adjust payouts based on earnings. The Breckinridge High Quality Dividend and Sustainable High Quality Dividend strategies seek high quality dividend payers with higher dividend growth rates; in other words, companies that are likely to grow their dividends strongly over time.
Breckinridge focuses on large, well-capitalized firms with long track records of consecutive dividend payments that also exhibit strong profitability. Our rules-based methodology includes the ROE metric, which has proven to be strongly correlated with both the high dividend growth and high Quality factors.4
Given some of the challenges to ROE as a pure play forecaster of future dividend growth, we believe that prioritizing higher ROE and lower relative payout ratios (Please see: Navigating the Risks: High Payout Ratios and Stable Dividend Income) is an effective strategy to identify companies that can achieve sustained dividend growth over the long term.
[1] Yield on cost (YOC) is an investment metric used to determine the rate of return on the original cost of an investment, taking into account any changes in the income generated by the asset over time. In dividend growth investing, YOC is the annual dividend income paid by a stock divided by the original purchase price (cost basis) of the shares. This metric highlights how an investor's income stream from an investment has grown (or declined) due to changes in dividend payments over time, regardless of fluctuations in the stock price.
[2] Time value of money is the fundamental financial principle that a dollar today is worth more than a dollar received in the future because money available today can be invested and earn a return, increasing its value over time.
[3] The DuPont formula breaks down a company's ROE into three components: profitability (Net Profit Margin), efficiency (Total Asset Turnover), and financial leverage (Equity Multiplier). By multiplying these three ratios, the formula provides a more detailed view of how a company generates returns for its shareholders, allowing for better analysis of performance drivers and strategic improvements.
[4] Factors such as Value, Size, Momentum, Quality and Minimum Volatility are employed to identify stocks with specific characteristics. Key Quality factors include: high profitability, as demonstrated by metrics like high ROE and Return on Invested Capital (ROIC); strong balance sheets, suggesting low debt levels, often measured by a low Debt-to-Equity (D/E) ratio; stable and consistent earnings, with lower earnings variability over time, demonstrating resilience and predictability in financial performance; durable competitive advantages like strong brands, patents, or efficient supply chains, which may support sustained profitability and market share; and effective management and strong corporate governance, which may reflect responsible leadership, ethical practices and shareholder-friendly decision making.
BCAI-09172025-req0ushp (9/18/25)
DISCLAIMERS:
The content is intended for investment professionals and institutional investors.
This material provides general information and should not be construed as a solicitation or offer of services or products or as legal, tax or investment advice. Nothing contained herein should be considered a guide to security selection, asset allocation or portfolio construction.
All information and opinions are current as of the dates indicated and are subject to change. Breckinridge believes the data provided by unaffiliated third parties to be reliable but investors should conduct their own independent verification prior to use. Some economic and market conditions contained herein have been obtained from published sources and/or prepared by third parties, and in certain cases have not been updated through the date hereof.
There is no assurance that any estimate, target, projection or forward-looking statement (collectively, “estimates”) included in this material will be accurate or prove to be profitable; actual results may differ substantially. Breckinridge estimates are based on Breckinridge’s research, analysis and assumptions. Other events that were not considered in formulating such projections could occur and may significantly affect the outcome, returns or performance.
Not all securities or issuers mentioned represent holdings in client portfolios. Some securities have been provided for illustrative purposes only and should not be construed as investment recommendations. Any illustrative engagement or sustainability analysis examples are intended to demonstrate Breckinridge’s research and investment process.
Yields and other characteristics are metrics that can help investors in valuing a security, portfolio or composite. Yields do not represent performance results but they are one of several components that contribute to the return of a security, portfolio or composite. Yields and other characteristics are presented gross of advisory fees.
All investments involve risk, including loss of principal. No investment or risk management strategy, including diversification, can guarantee positive results or risk elimination in any market. Periods of elevated market volatility can significantly impact the value of securities. Investors should consult with their advisors to understand how these risks may affect their portfolios and to develop a strategy that aligns with their financial goals and risk tolerances.
Past performance is not indicative of future results. Breckinridge makes no assurances, warranties or representations that any strategies described herein will meet their investment objectives or incur any profits. Performance results for Breckinridge’s investment strategies include the reinvestment of interest and any other earnings, but do not reflect any brokerage or trading costs a client would have paid. Results may not reflect the impact that any material market or economic factors would have had on the accounts during the time period. Due to differences in client restrictions, objectives, cash flows, and other such factors, individual client account performance may differ substantially from the performance presented.
Actual client advisory fees may differ from the advisory fee used to calculate net performance results. Client returns will be reduced by the advisory fees and any other expenses incurred in the management of their accounts. For example, an advisory fee of 1 percent compounded over a 10-year period would reduce a 10 percent return to a 9 percent annual return. Additional information on fees can be found in Breckinridge’s Form ADV Part 2A.
Index results are shown for illustrative purposes and do not represent the performance of any specific investment. Indices are unmanaged and investors cannot directly invest in them. They do not reflect any management, custody, transaction or other expenses, and generally assume reinvestment of dividends, income and capital gains. Performance of indices may be more or less volatile than any investment strategy.
There is no guarantee that the strategies or approaches discussed will achieve their objectives, lower volatility or be profitable. All investments involve risk, including loss of principal. Diversification cannot assure a profit or protect against loss. No investment or risk management strategy can guarantee positive results or risk elimination in any market.
Fixed income investments have varying degrees of credit risk, interest rate risk, default risk, and prepayment and extension risk. In general, bond prices rise when interest rates fall and vice versa.
Equity investments are volatile and can decline significantly in response to investor reception of the issuer, market, economic, industry, political, regulatory or other conditions.
When integrating sustainability analysis with traditional financial analysis, Breckinridge’s investment team will consider material sustainability factors but may conclude that other attributes outweigh the sustainability considerations when making investment decisions.
There is no guarantee that integrating sustainability analyses will improve risk-adjusted returns, lower portfolio volatility over any specific time period, or outperform the broader market or other strategies that do not utilize these analyses when selecting investments. The consideration of sustainability factors may limit investment opportunities available to a portfolio. In addition, data for sustainable factors often lacks standardization, consistency and transparency and for certain companies such data may not be available, complete or accurate.
Breckinridge’s sustainability analysis is based on third party data and Breckinridge analysts’ internal analysis. Analysts will review a variety of sources such as corporate sustainability reports, data subscriptions, and research reports to obtain available metrics for internally developed frameworks. A high sustainability rating does not mean it will be included in a portfolio, nor does it mean that a bond will provide profits or avoid losses.
Investments in thematic customizations will subject the portfolio to proportionately higher risk exposure of any sectors or regions in which the investments target. In addition, the investments held in thematic customizations may not meet the desired positive impact or become subject to negative publicity; these types of events may cause the customizations to have poor performance due to the concentration of assets. There is no assurance that the customizations or the strategies will meet their objectives.
BLOOMBERG® is a trademark and service mark of Bloomberg Finance L.P. and its affiliates (collectively “Bloomberg”). Bloomberg does not approve or endorse this material or guarantees the accuracy or completeness of any information herein, or makes any warranty, express or implied, as to the results to be obtained therefrom and, to the maximum extent allowed by law, neither shall have any liability or responsibility for injury or damages arising in connection therewith.
Solactive AG ("Solactive") is the licensor of Breckinridge Sustainable Dividend Income Index and Breckinridge Dividend Income Index (the "Indices"). The financial instruments that are based on the Indices are not sponsored, endorsed, promoted or sold by Solactive in any way and Solactive makes no express or implied representation, guarantee or assurance with regard to: (a) the advisability in investing in the financial instruments; (b) the quality, accuracy and/or completeness of the Indices; and/or (c) the results obtained or to be obtained by any person or entity from the use of the Indices. Solactive reserves the right to change the methods of calculation or publication with respect to the Indices. Solactive shall not be liable for any damages suffered or incurred as a result of the use (or inability to use) of the Indices.
The S&P500 Index (“Index”) and associated data is a product of S&P Dow Jones Indices LLC, its affiliates and/or their licensors and has been licensed for use by Breckinridge. © 2024 S&P Dow Jones Indices LLC, its affiliates and/or their licensors. All rights reserved. Redistribution or reproduction in whole or in part are prohibited without written permission of S&P Dow Jones Indices LLC. For more information on any of S&P Dow Jones Indices LLC’s indices please visit www.spdji.com. S&P® is a registered trademark of Standard & Poor’s Financial Services LLC (“SPFS”) and Dow Jones® is a registered trademark of Dow Jones Trademark Holdings LLC (“Dow Jones”). Neither S&P Dow Jones Indices LLC, SPFS, Dow Jones, their affiliates nor their licensors (“S&P DJI”) make any representation or warranty, express or implied, as to the ability of any index to accurately represent the asset class or market sector that it purports to represent and S&P DJI shall have no liability for any errors, omissions, or interruptions of any index or the data included therein.