Equities
Perspective published on June 26, 2025
Looking Beyond Yield for Stable Dividend Income
Summary
- We believe that investors may place too much emphasis on high absolute dividend yield when seeking defensive and high income-generating equity exposure.
- High dividend-yielding securities are more likely to cut their dividends in times of distress, making dividend yield a poor predictor of future income.
- While they have been good for investors who want to invest in more safe stocks, high dividend-yielding securities have a lower total and risk-adjusted return over the long term.
- Investors seeking a defensive posture in their equity income portfolios should look beyond dividend yield and consider a more discerning approach that offers a comprehensive assessment of dividend payers’ financial health.
Over-reliance on Lower Beta,1 High Dividend-Yielding Stocks can be “Risky” Business
Dividend equity investors often look to dividend yield as the main way to find companies that are attractive. This is likely because they like the idea that higher yielding stocks are more safe, which helps them stay stable in volatile markets.
However, relying too much on dividend yield could be very misleading. It could lead portfolios toward companies that have too many dividends, weaker fundamentals, and limited growth chances.
While dividend yield is an important input, it is only the first piece of a more complex puzzle. A more balanced and forward-looking approach is essential for building a durable, income-generating equity portfolio.
Today’s High Yield May Not Be Tomorrow’s High Income
Income derived from high dividend-yield equities is not a reliable indicator of forward income returns (See Figure 1). Companies with the highest dividend yields have given out 50 basis points (bps) less in dividend income each year than they said they would over the next five years.
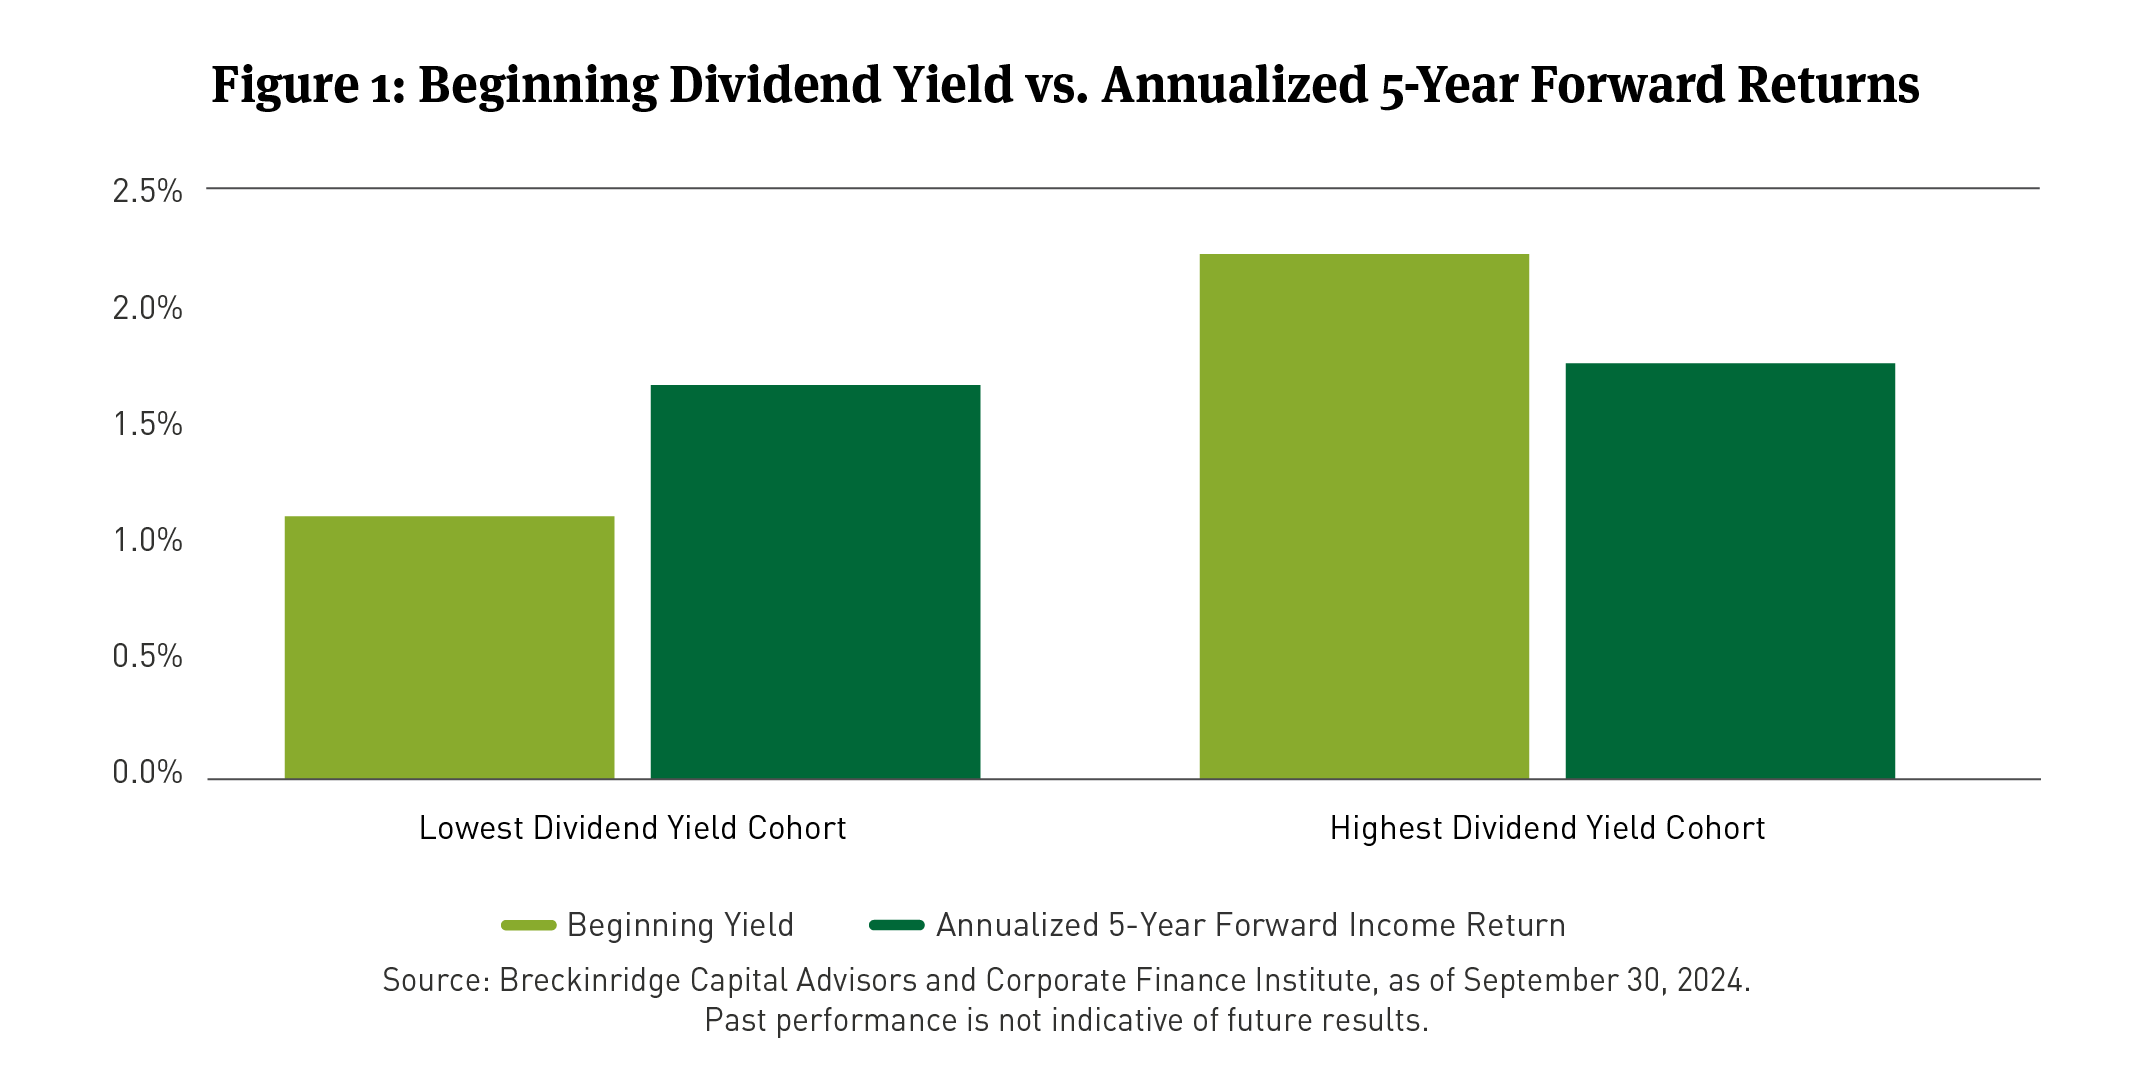
These charts are based on the data used in our analysis of monthly index returns for the period January 1994 to September 30, 2024. The analysis is intended to illustrate that equity dividend yields are not as reliable predictors of realized income returns as bonds, especially at higher dividend yields. Historically, investment grade (IG) bonds have a low default rate compared to non-IG bonds. For example, S&P Global reported that the highest one-year default rates for AAA, AA, A, and BBB-rated bonds (IG bonds) were 0 percent, 0.38 percent, 0.39 percent, and 1.02 percent, respectively. It can be contrasted with the maximum one-year default rate for BB, B, and CCC/C-rated bonds (non-IG bonds) of 4.22 percent, 13.84 percent, and 49.28 percent, respectively. Yields are snapshot metrics for securities that can help investors in valuing a security, portfolio or strategy. Yields do not represent performance results but are one of several components that contribute to the return for a security, portfolio or strategy.
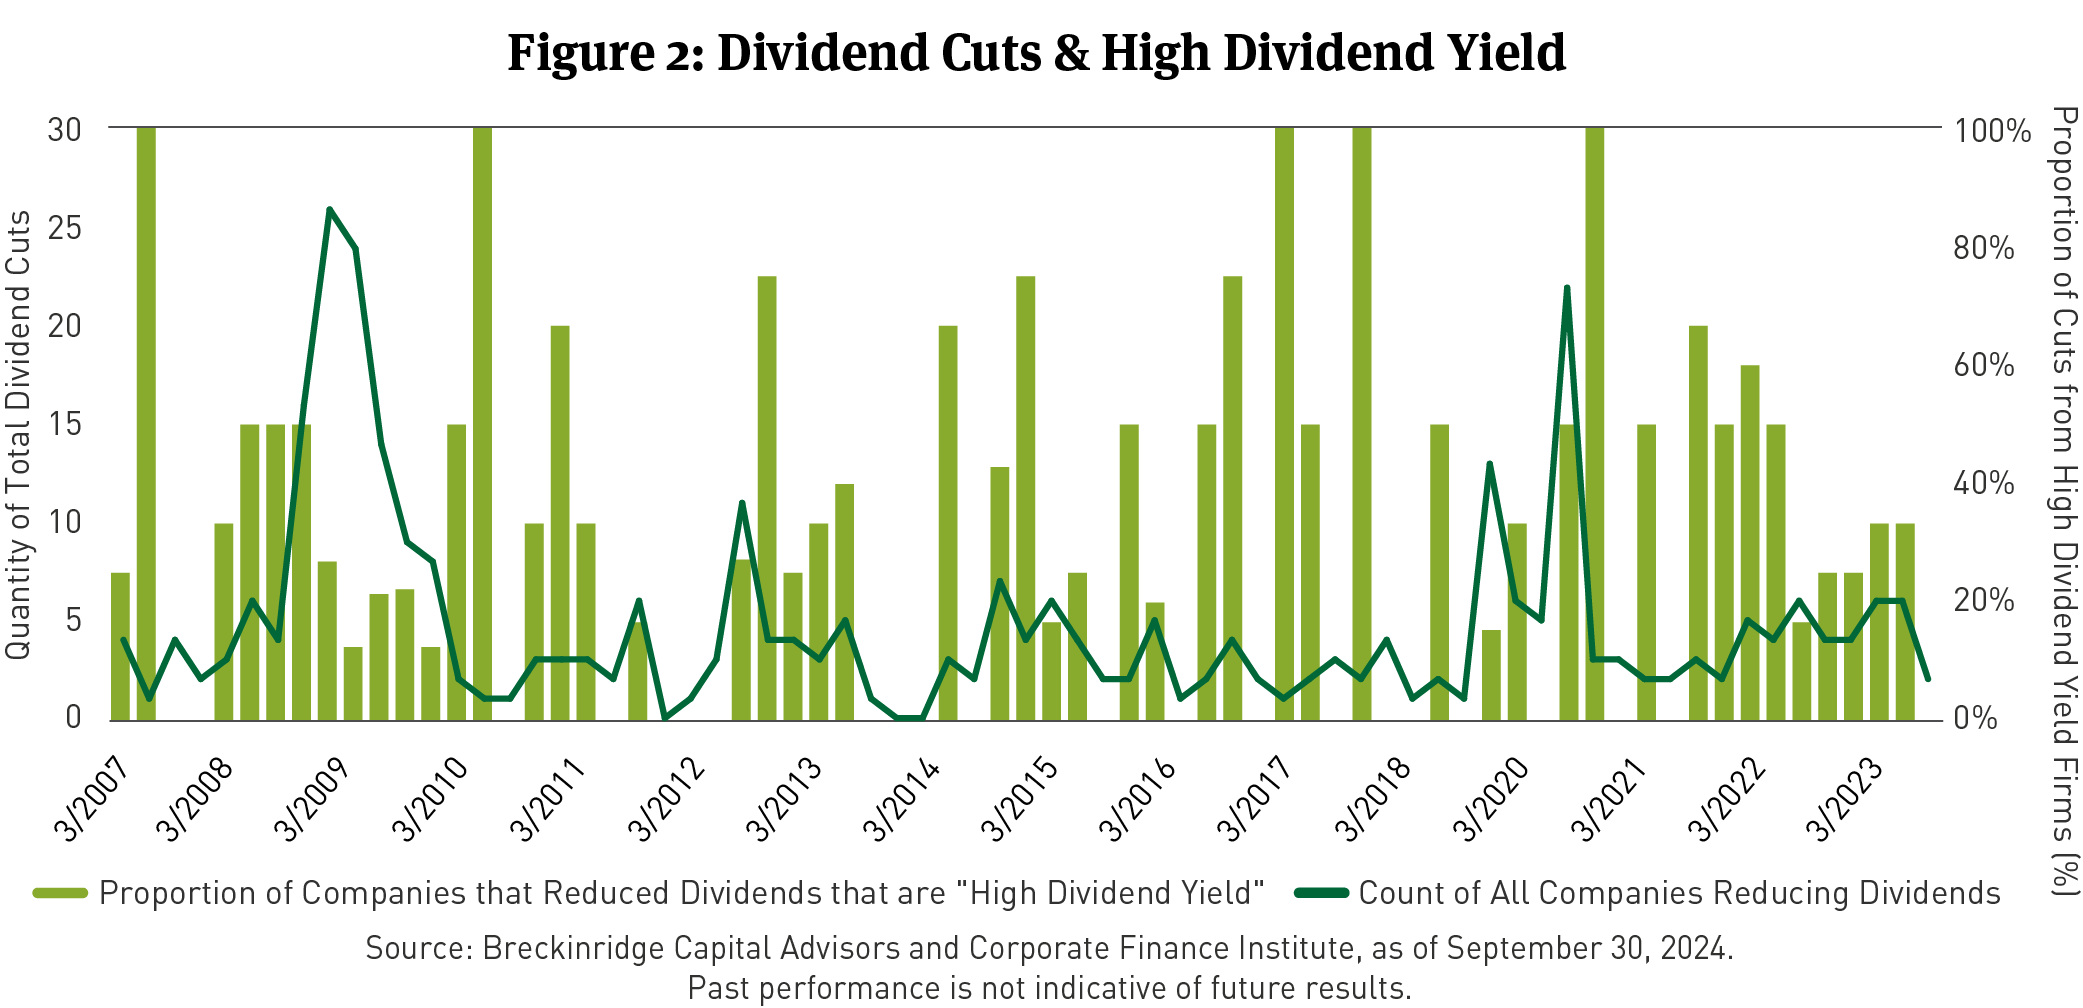
In contrast, the group of companies that first said they had the lowest average dividend yield actually made 60bps more in income each year than they said they had. The underwhelming income derived from the high dividend-yield cohort is likely due to dividend cuts and eliminations. In fact, during instances when dividends were reduced, 33 percent of those instances occurred within the highest dividend yield cohort (See Figure 2).
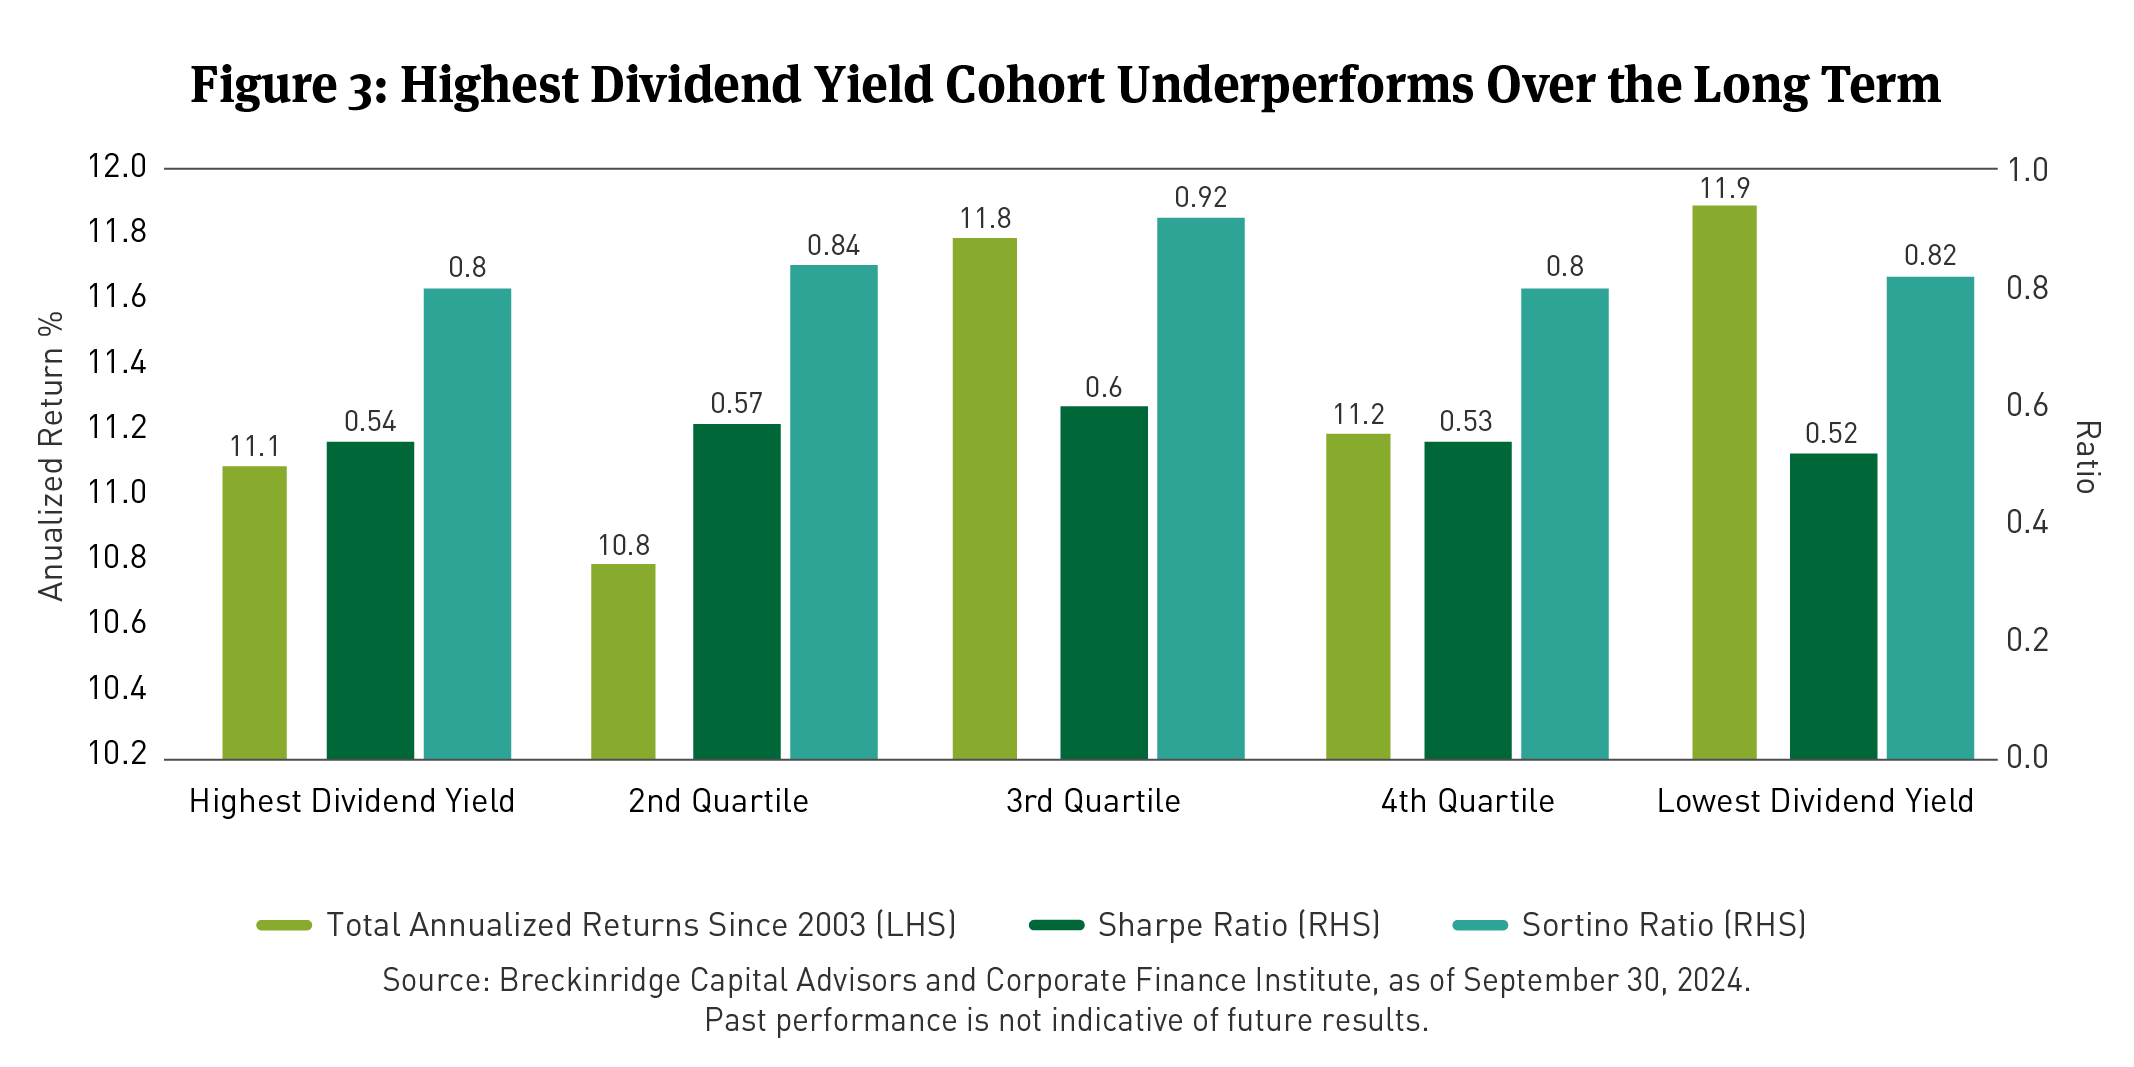
High Dividend Yield May Also Result in Both Absolute and Risk Adjusted Underperformance Over the Long Term
The high dividend-yield cohort has underperformed on both an absolute and on a risk-adjusted basis over the long term, using both Sharpe2 and Sortino3 ratios (See Figure 3). These cohorts tend to lag broader market performance during up-markets, likely due to a variety of factors such as exposure to established companies in mature industries with less appealing growth prospects (such as Materials) or sectors that are constrained due to regulatory or structural reasons (such as Utilities and Real Estate Investment Trusts (REITs)). Risk-adjusted metrics indicate that the middle quintiles exhibit stronger results and avoid the tails of the distribution.
The Case for Counterbalancing High Dividend Yield
There are discerning approaches to seeking downside mitigation and/or income generation without significantly sacrificing higher absolute and risk-adjusted returns over the long run. For investors focused on income stability and downside risk mitigation, focusing solely on high dividend yield can sometimes lead to disappointment.
Ultimately, we believe that investors seeking sustainable dividend income would be better served by considering factors such as payout ratio, earnings quality, dividend growth and balance sheet strength in addition to dividend yield. While these metrics may make portfolios give a lower overall dividend yield, they help income stay steady while giving more chances for more dividend growth and capital appreciation.
[1] Beta is a measure of a stock's volatility in relation to the overall market. High-beta stocks generally are considered riskier while offering higher return potential.
[2] The Sharpe ratio is a metric used in finance to assess the performance of an investment by adjusting for its risk. It measures the excess return (return above a risk-free rate) per unit of risk (usually measured by standard deviation). A higher Sharpe ratio generally indicates a better risk-adjusted return, meaning the investment is providing more returns for the level of risk taken.
[3] The Sortino ratio is a measure of risk-adjusted return that focuses on downside risk. It assesses how well an investment performs relative to the volatility of returns below a specified target or minimum acceptable return, unlike the Sharpe ratio which considers total volatility. The Sortino ratio indicates how much excess return an investment generates for each unit of downside risk.
BCAI-06202025-msxq3nbk (06/25/2025)
DISCLAIMERS:
The content is intended for investment professionals and institutional investors.
This material provides general information and should not be construed as a solicitation or offer of services or products or as legal, tax or investment advice. Nothing contained herein should be considered a guide to security selection, asset allocation or portfolio construction.
All information and opinions are current as of the dates indicated and are subject to change. Breckinridge believes the data provided by unaffiliated third parties to be reliable but investors should conduct their own independent verification prior to use. Some economic and market conditions contained herein have been obtained from published sources and/or prepared by third parties, and in certain cases have not been updated through the date hereof.
There is no assurance that any estimate, target, projection or forward-looking statement (collectively, “estimates”) included in this material will be accurate or prove to be profitable; actual results may differ substantially. Breckinridge estimates are based on Breckinridge’s research, analysis and assumptions. Other events that were not considered in formulating such projections could occur and may significantly affect the outcome, returns or performance.
Not all securities or issuers mentioned represent holdings in client portfolios. Some securities have been provided for illustrative purposes only and should not be construed as investment recommendations. Any illustrative engagement or sustainability analysis examples are intended to demonstrate Breckinridge’s research and investment process.
Yields and other characteristics are metrics that can help investors in valuing a security, portfolio or composite. Yields do not represent performance results but they are one of several components that contribute to the return of a security, portfolio or composite. Yields and other characteristics are presented gross of advisory fees.
All investments involve risk, including loss of principal. No investment or risk management strategy, including diversification, can guarantee positive results or risk elimination in any market. Periods of elevated market volatility can significantly impact the value of securities. Investors should consult with their advisors to understand how these risks may affect their portfolios and to develop a strategy that aligns with their financial goals and risk tolerances.
Past performance is not indicative of future results. Breckinridge makes no assurances, warranties or representations that any strategies described herein will meet their investment objectives or incur any profits. Performance results for Breckinridge’s investment strategies include the reinvestment of interest and any other earnings, but do not reflect any brokerage or trading costs a client would have paid. Results may not reflect the impact that any material market or economic factors would have had on the accounts during the time period. Due to differences in client restrictions, objectives, cash flows, and other such factors, individual client account performance may differ substantially from the performance presented.
Actual client advisory fees may differ from the advisory fee used to calculate net performance results. Client returns will be reduced by the advisory fees and any other expenses incurred in the management of their accounts. For example, an advisory fee of 1 percent compounded over a 10-year period would reduce a 10 percent return to a 9 percent annual return. Additional information on fees can be found in Breckinridge’s Form ADV Part 2A.
Index results are shown for illustrative purposes and do not represent the performance of any specific investment. Indices are unmanaged and investors cannot directly invest in them. They do not reflect any management, custody, transaction or other expenses, and generally assume reinvestment of dividends, income and capital gains. Performance of indices may be more or less volatile than any investment strategy.
There is no guarantee that the strategies or approaches discussed will achieve their objectives, lower volatility or be profitable. All investments involve risk, including loss of principal. Diversification cannot assure a profit or protect against loss. No investment or risk management strategy can guarantee positive results or risk elimination in any market.
Fixed income investments have varying degrees of credit risk, interest rate risk, default risk, and prepayment and extension risk. In general, bond prices rise when interest rates fall and vice versa.
Equity investments are volatile and can decline significantly in response to investor reception of the issuer, market, economic, industry, political, regulatory or other conditions.
When integrating sustainability analysis with traditional financial analysis, Breckinridge’s investment team will consider material sustainability factors but may conclude that other attributes outweigh the sustainability considerations when making investment decisions.
There is no guarantee that integrating sustainability analyses will improve risk-adjusted returns, lower portfolio volatility over any specific time period, or outperform the broader market or other strategies that do not utilize these analyses when selecting investments. The consideration of sustainability factors may limit investment opportunities available to a portfolio. In addition, data for sustainable factors often lacks standardization, consistency and transparency and for certain companies such data may not be available, complete or accurate.
Breckinridge’s sustainability analysis is based on third party data and Breckinridge analysts’ internal analysis. Analysts will review a variety of sources such as corporate sustainability reports, data subscriptions, and research reports to obtain available metrics for internally developed frameworks. A high sustainability rating does not mean it will be included in a portfolio, nor does it mean that a bond will provide profits or avoid losses.
Investments in thematic customizations will subject the portfolio to proportionately higher risk exposure of any sectors or regions in which the investments target. In addition, the investments held in thematic customizations may not meet the desired positive impact or become subject to negative publicity; these types of events may cause the customizations to have poor performance due to the concentration of assets. There is no assurance that the customizations or the strategies will meet their objectives.
BLOOMBERG® is a trademark and service mark of Bloomberg Finance L.P. and its affiliates (collectively “Bloomberg”). Bloomberg does not approve or endorse this material or guarantees the accuracy or completeness of any information herein, or makes any warranty, express or implied, as to the results to be obtained therefrom and, to the maximum extent allowed by law, neither shall have any liability or responsibility for injury or damages arising in connection therewith.
Solactive AG ("Solactive") is the licensor of Breckinridge Sustainable Dividend Income Index and Breckinridge Dividend Income Index (the "Indices"). The financial instruments that are based on the Indices are not sponsored, endorsed, promoted or sold by Solactive in any way and Solactive makes no express or implied representation, guarantee or assurance with regard to: (a) the advisability in investing in the financial instruments; (b) the quality, accuracy and/or completeness of the Indices; and/or (c) the results obtained or to be obtained by any person or entity from the use of the Indices. Solactive reserves the right to change the methods of calculation or publication with respect to the Indices. Solactive shall not be liable for any damages suffered or incurred as a result of the use (or inability to use) of the Indices.
The S&P500 Index (“Index”) and associated data is a product of S&P Dow Jones Indices LLC, its affiliates and/or their licensors and has been licensed for use by Breckinridge. © 2024 S&P Dow Jones Indices LLC, its affiliates and/or their licensors. All rights reserved. Redistribution or reproduction in whole or in part are prohibited without written permission of S&P Dow Jones Indices LLC. For more information on any of S&P Dow Jones Indices LLC’s indices please visit www.spdji.com. S&P® is a registered trademark of Standard & Poor’s Financial Services LLC (“SPFS”) and Dow Jones® is a registered trademark of Dow Jones Trademark Holdings LLC (“Dow Jones”). Neither S&P Dow Jones Indices LLC, SPFS, Dow Jones, their affiliates nor their licensors (“S&P DJI”) make any representation or warranty, express or implied, as to the ability of any index to accurately represent the asset class or market sector that it purports to represent and S&P DJI shall have no liability for any errors, omissions, or interruptions of any index or the data included therein.