Investing
Commentary published on August 13, 2025
July 2025 Market Commentary
Summary
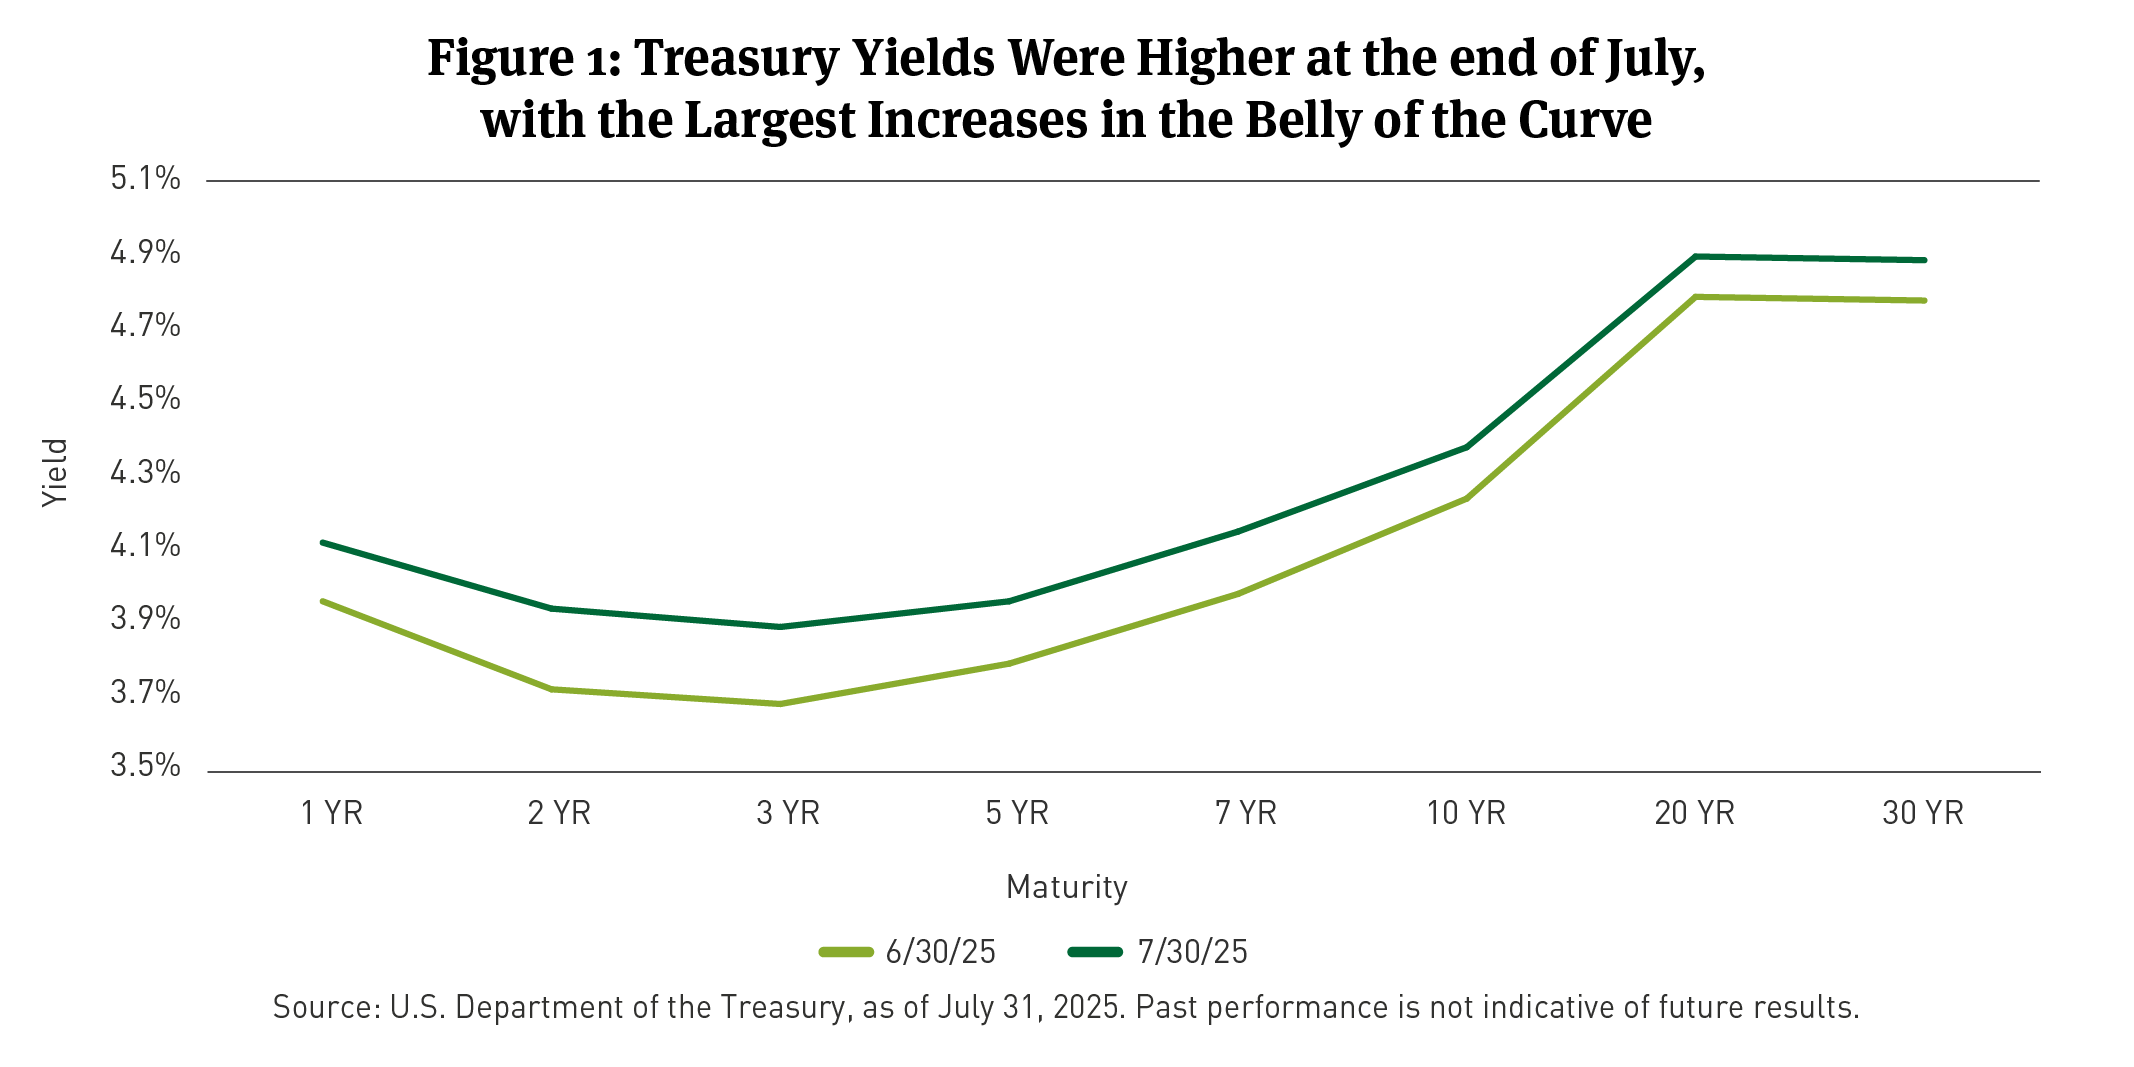
- U.S. Treasury Curve: Treasury yields increased in July on favorable economic data and the Federal Reserve’s (Fed’s) decision to hold rates steady.
- Municipal Market Rates and Technicals: Supply continued at an elevated level and demand was sustained. Municipal bonds [1] earned a positive total return of 0.60 percent, as short and intermediate bonds outperformed longer-term bonds.
- Corporate Market Technicals: The option-adjusted spread (OAS) for the Bloomberg (BBG) Corporate Investment Grade (IG) Index [2] (the Corporate Bond Index) ended at 76 basis points (bps), tightening another 7bps on the month. Total fixed-rate gross investment grade (IG) corporate bond supply was nearly $90 billion, although net issuance was negative after redemptions.
- Securitized Trends: Total returns, per BBG data, across mortgage-backed securities (MBS) were flat to negative, while excess [3] were generally flat to positive. Asset-backed securities (ABS) earned positive total and excess returns.
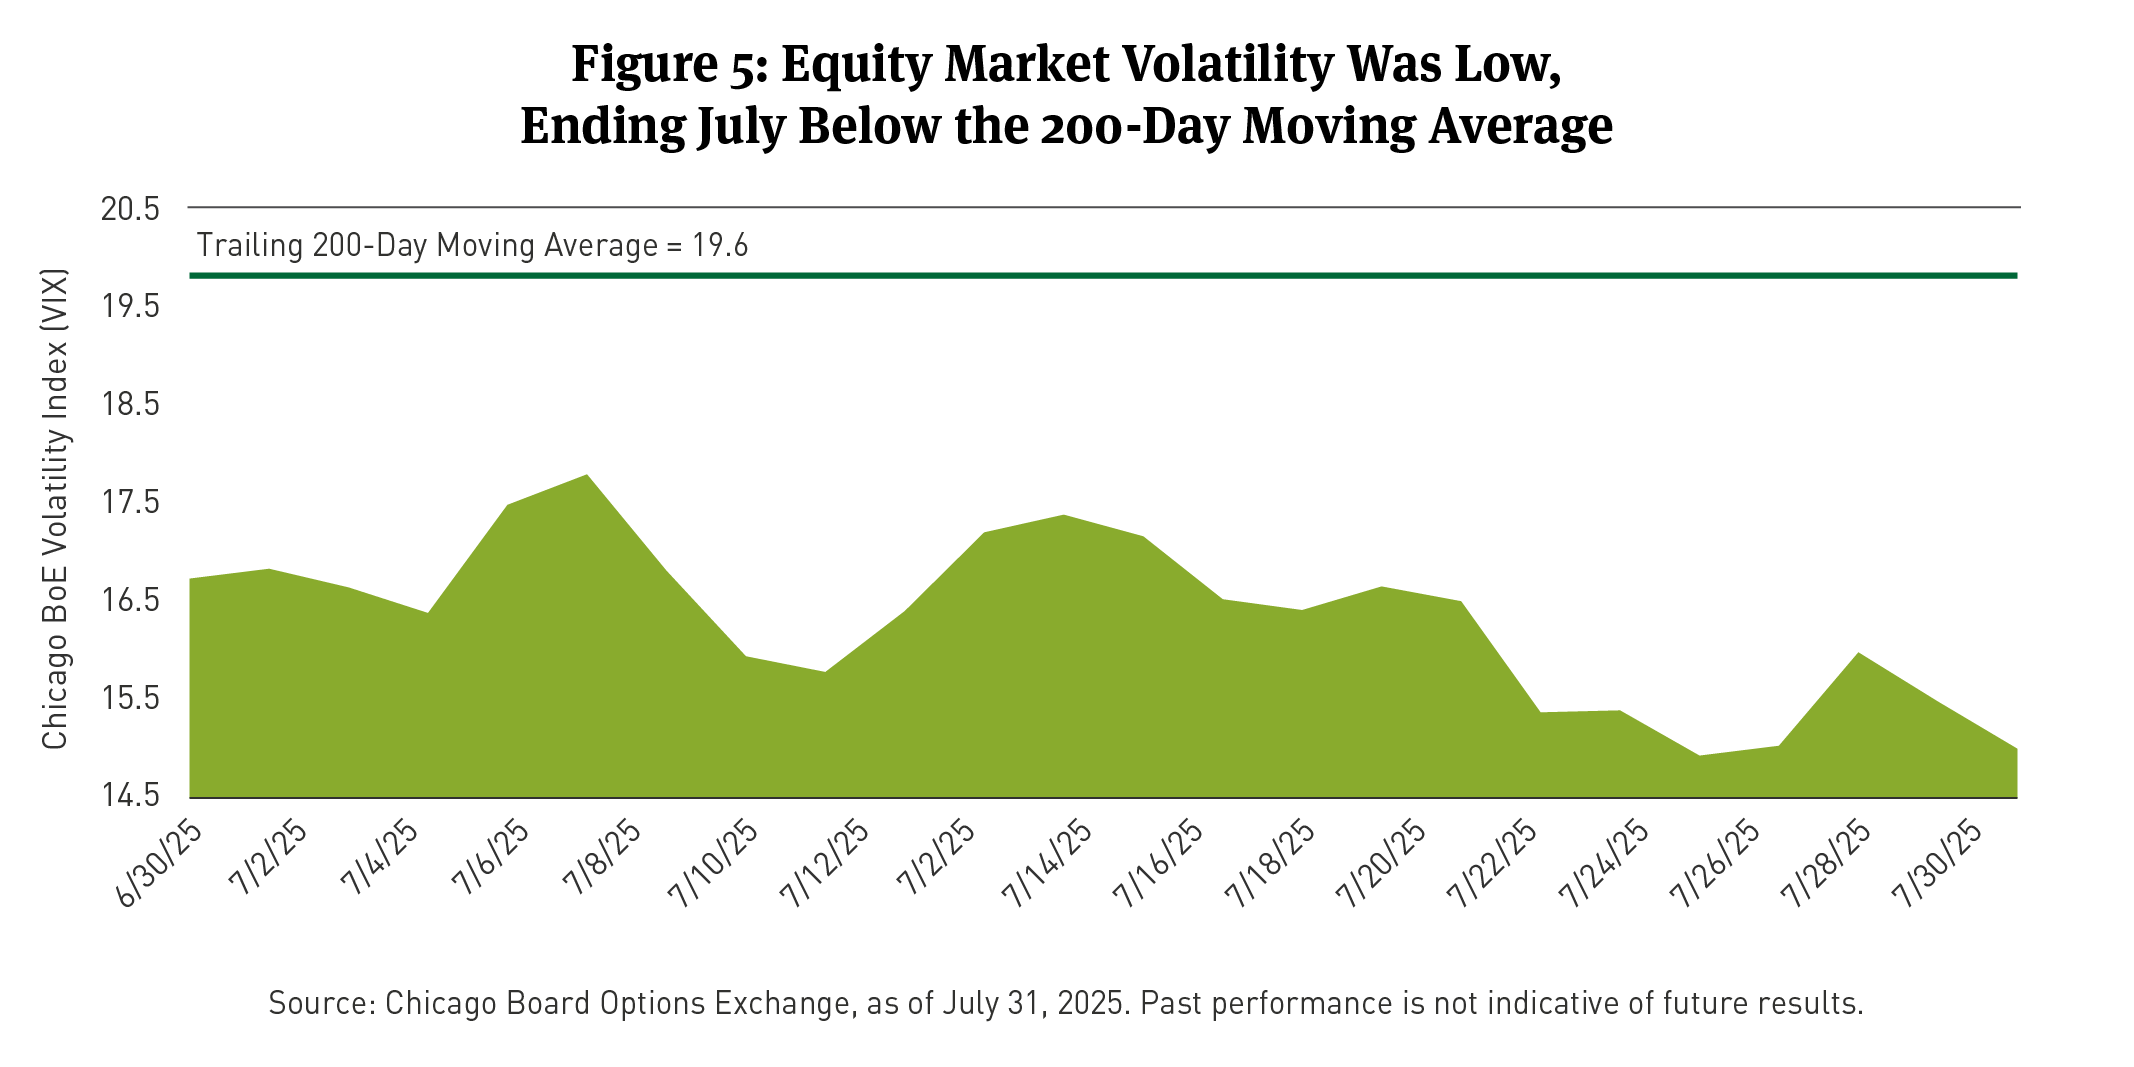
- Equity Market Trends: Equity markets, as represented by the S&P (the S&P Index), [4] added about 2.2 percent. July returns were positive across 6 of 11 sectors.
(The following commentary is a summary of discussions among members of the Breckinridge Capital Advisors Investment Committee as they reviewed monthly activity in the markets and investment returns. The members of the Investment Committee, under the leadership of Co-Chief Investment Officers Matthew Buscone and Jeffrey Glenn, CFA, are Co-Heads of Research, Nicholas Elfner and Adam Stern, J.D., M.P.A.; and Portfolio Manager and Director, Corporate Research, Josh Perez, CFA.)
Market Review
Investor sentiment remained positive in July, driving equity prices higher and bond prices lower. Equity gains were led by Information Technology and Utility stocks and the biggest decline in bonds came from longer maturities.
Economic data indicated the U.S. economy continued an upward trajectory. On July 29, second quarter gross domestic product (GDP) was reported by the U.S. Commerce Department to be 3 percent year-over-year (Y/Y), on a seasonally adjusted annual rate, which was a rebound from the first three months of the year, when output contracted at a 0.5 percent rate, which some analysts attributed to shifting tariff policies. Over the first six months of 2025 (1H25), GDP data suggested more modest economic growth.
Earlier in the month, the U.S. Bureau of Labor Statistics (BLS) reported the June Consumer Price Index (CPI) rose 0.3 compared to May’s reading, leaving the Y/Y change at 2.7 percent. The Fed’s preferred inflation measure, the Personal Consumption Expenditures (PCE) index, increased by 0.3 percent from the previous month, according to the U.S. Bureau of Economic Analysis (BEA), pushing the annual PCE inflation rate to 2.6 percent from 2.4 percent in May. Forecasters continued to sift through the data for definitive proof that tariffs were contributing to higher inflation.
The BLS reported in early July that U.S. non-farm payrolls rose by 147,000 in June 2025, following an upwardly revised 144,000 May total. Analysts who were waiting for federal job cuts and stricter immigration policies to filter through the economy got some evidence in the July jobs report. On August 1, the BLS reported that the economy added 73,000 jobs in July, lower than economists’ expectations, according to Bloomberg. The unemployment rate rose to 4.2 percent, up from 4.1 percent the month before. Job gains from the prior two months were revised lower.
With encouraging GDP data offset by unresolved concerns about future inflation and employment, the Federal Open Market Committee (FOMC) ended its July meeting by announcing no change to the federal funds rate. Two FOMC members expressed their dissent from the committee’s view, aligning with President Donald J. Trump’s consistent urging for rate cuts. Their action offered support to those viewing an interest-rate cut is in the making sooner rather than later.
In July, Treasury yields from two years and longer moved higher. Yields for the 2-, 5-, 10-, and 30-year Treasuries were 24, 18, 15, and 13bps higher, respectively (See Figure 1). The BBG Treasury Bond Index5 lost 0.39 percent in July.
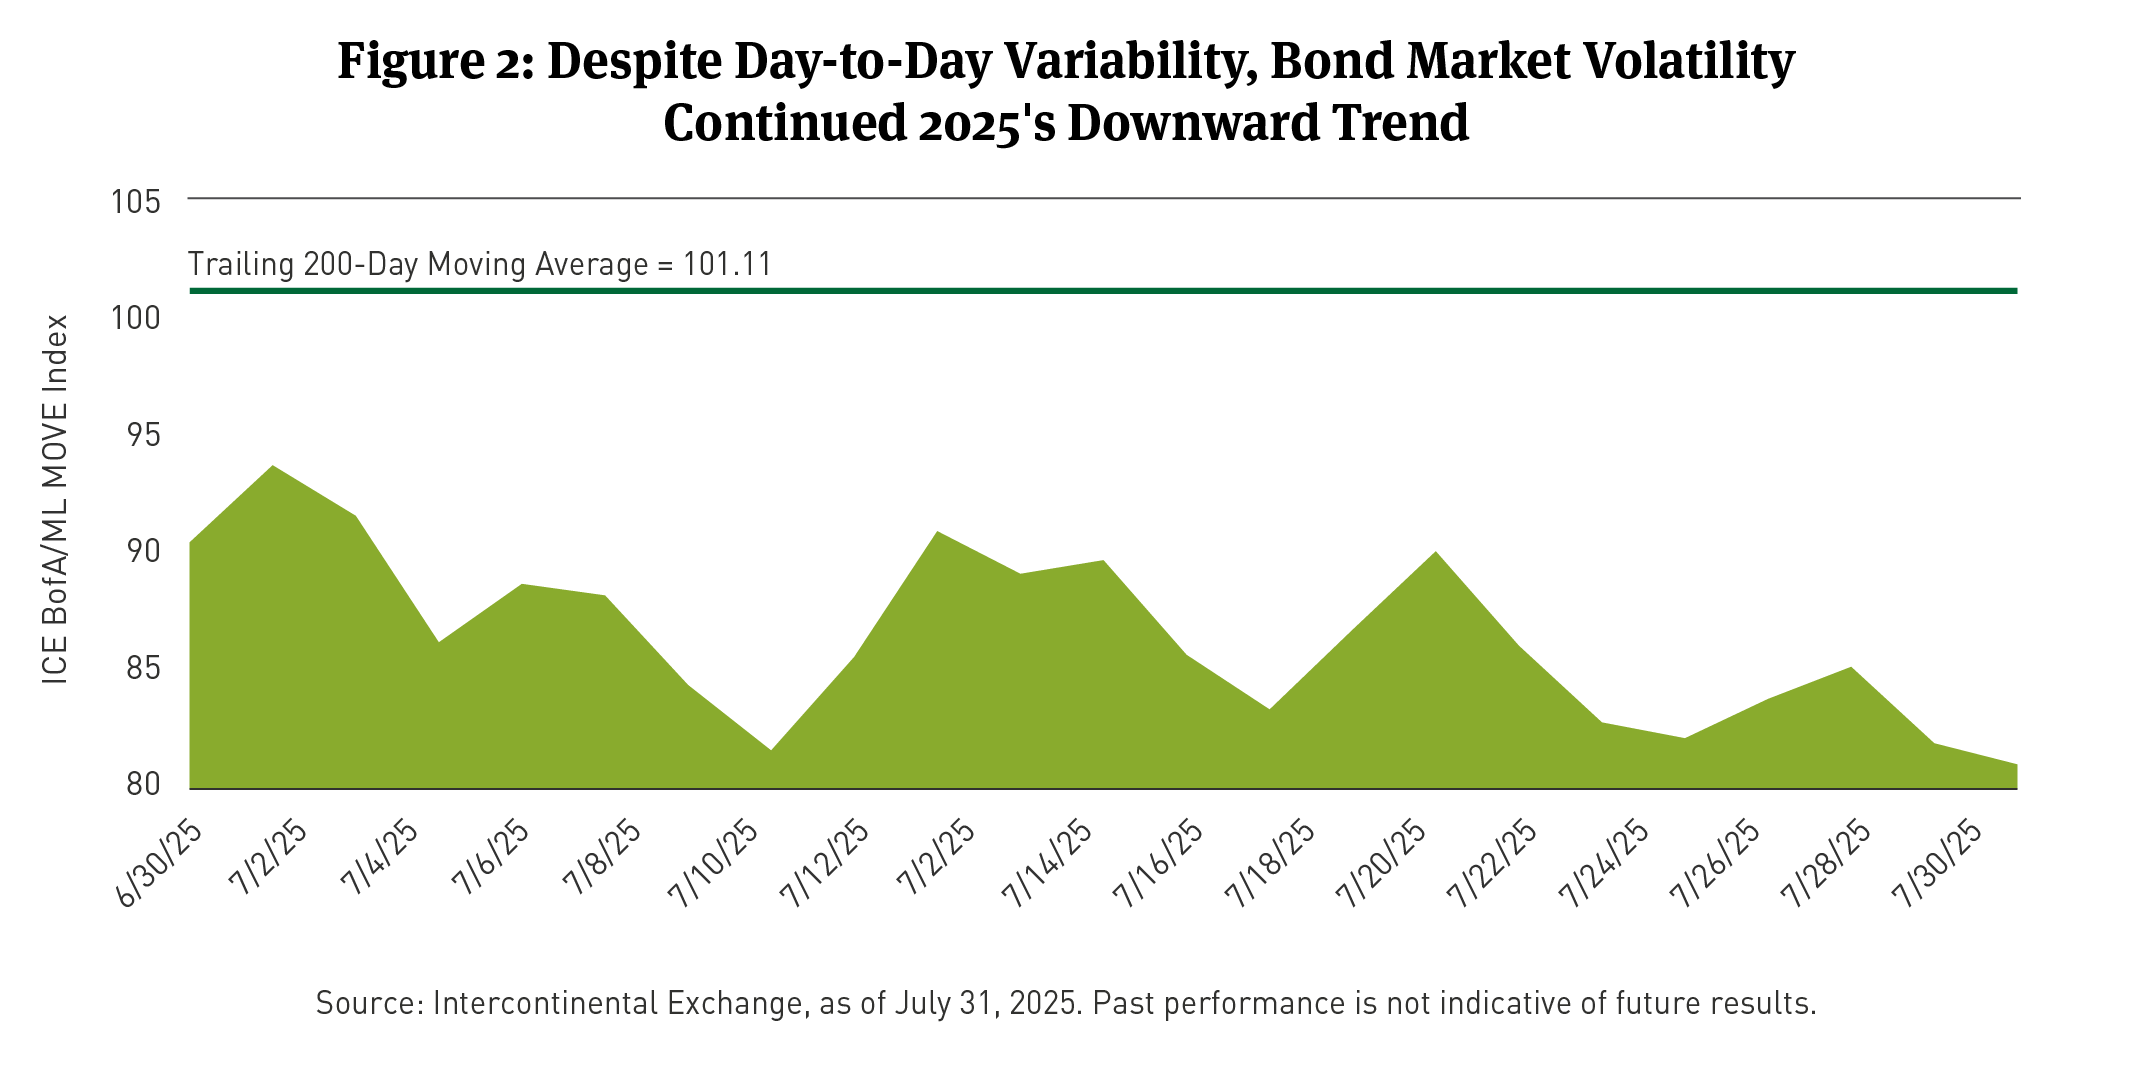
Bond market volatility was at low levels, as measured by the Intercontinental Exchange Bank of America/Merrill Lynch MOVE Index declined (See Figure 2).
The Breckinridge Investment Committee expects growth to remain muted in the second half of 2025. Because consumer spending is a critical component of the growth outlook, a recent softening of real spending (down 0.3 percent in May) and the ongoing tariff-related uncertainty are the largest risks to growth, consumer spending, and price levels. The Committee continues to expect two Fed rate cuts this year, starting in September.
Municipal Market Review
Ample new bond supply continued in July, with more than $53 billion issued, according to data from the London Stock Exchange Group (LSEG), as reported by The Bond Buyer. The total represented a nearly $12 billion or 29 percent increase over issuance in the same month in 2024.
Municipal bonds, as measured by the BBG Short/Intermediate (1-10) Municipal Bond Index, posted a positive return at 0.60 percent.
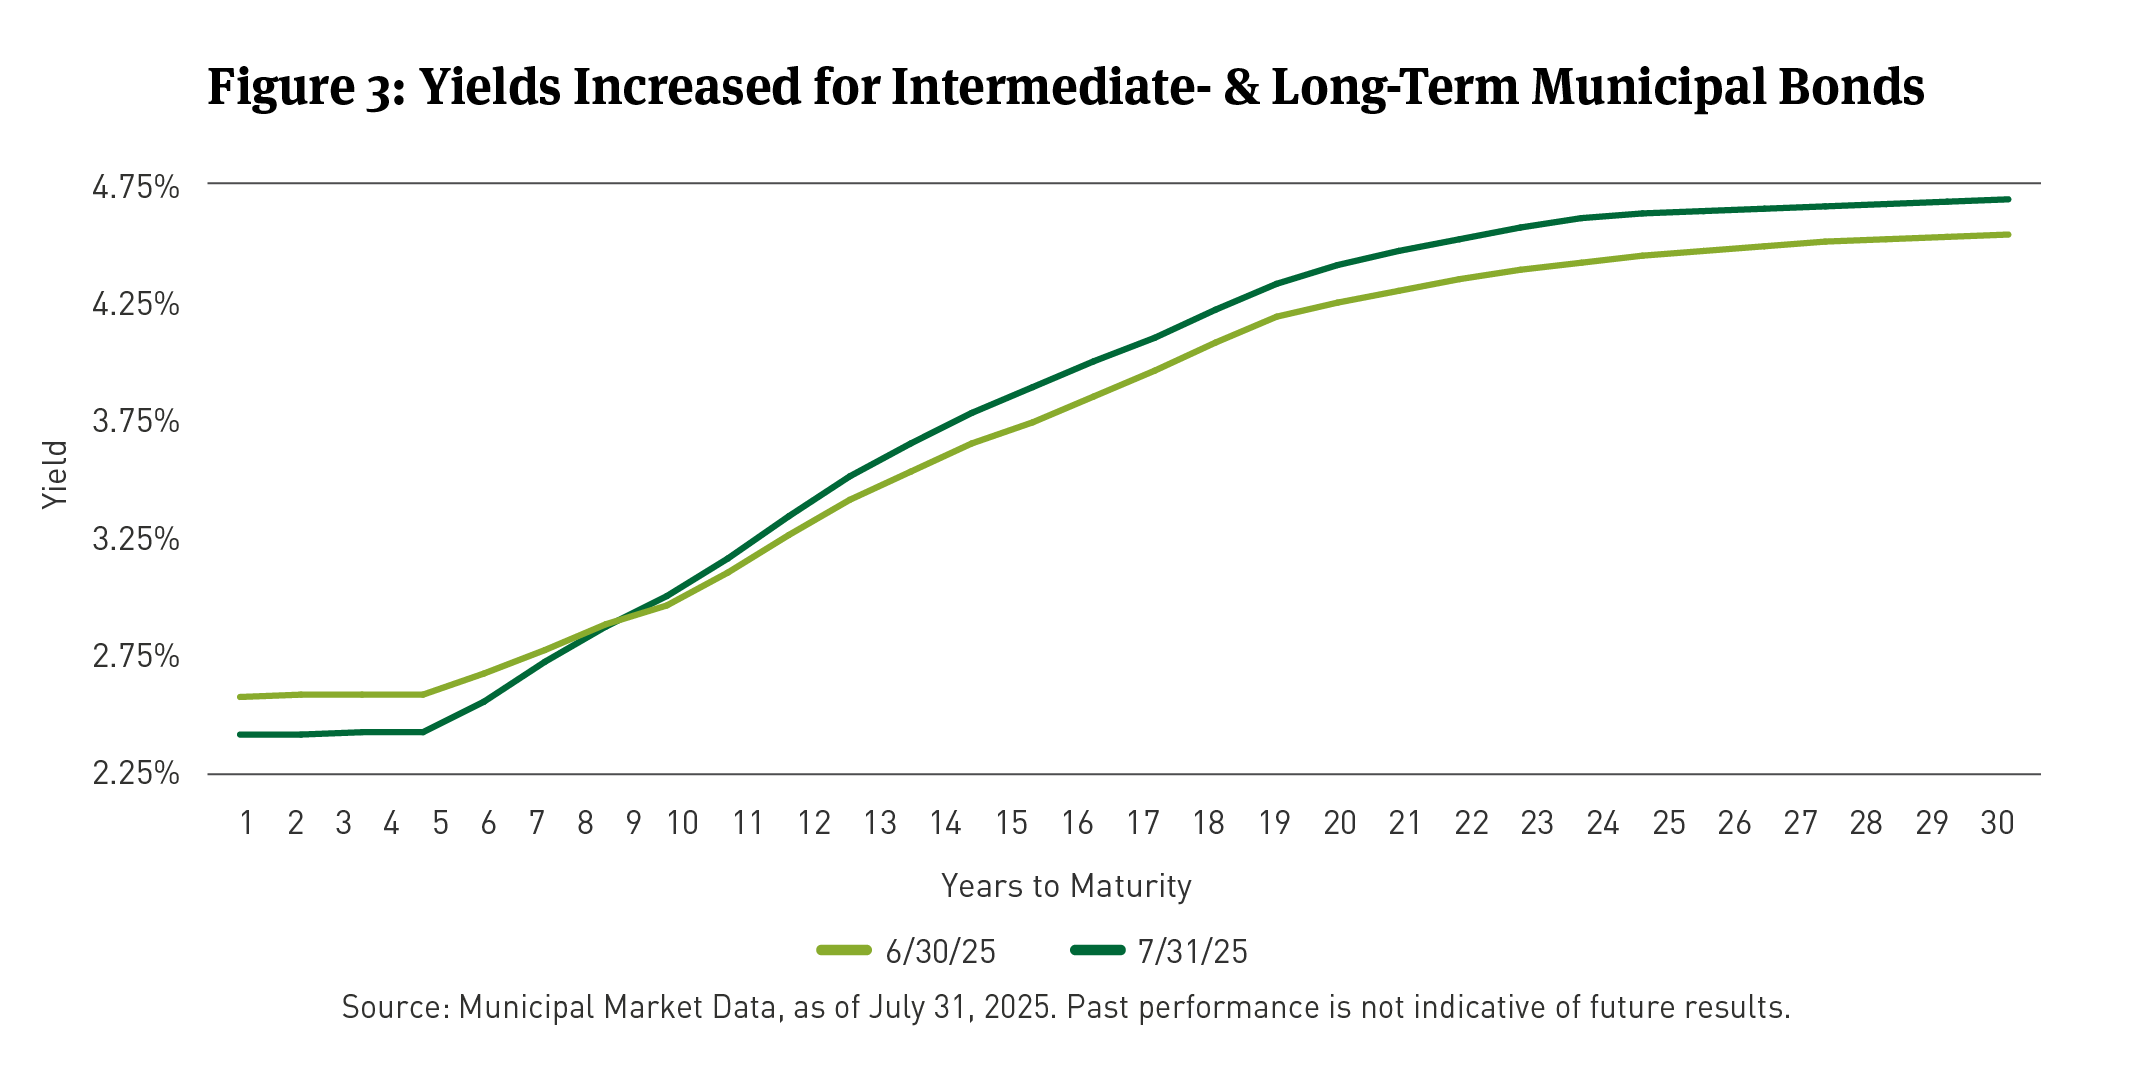
Yields for 2- and 5-year municipal bonds fell 22 and 19bps, respectively, while yields on 10- and 30-year bonds increased 6 and 17bps, respectively (See Figure 3).
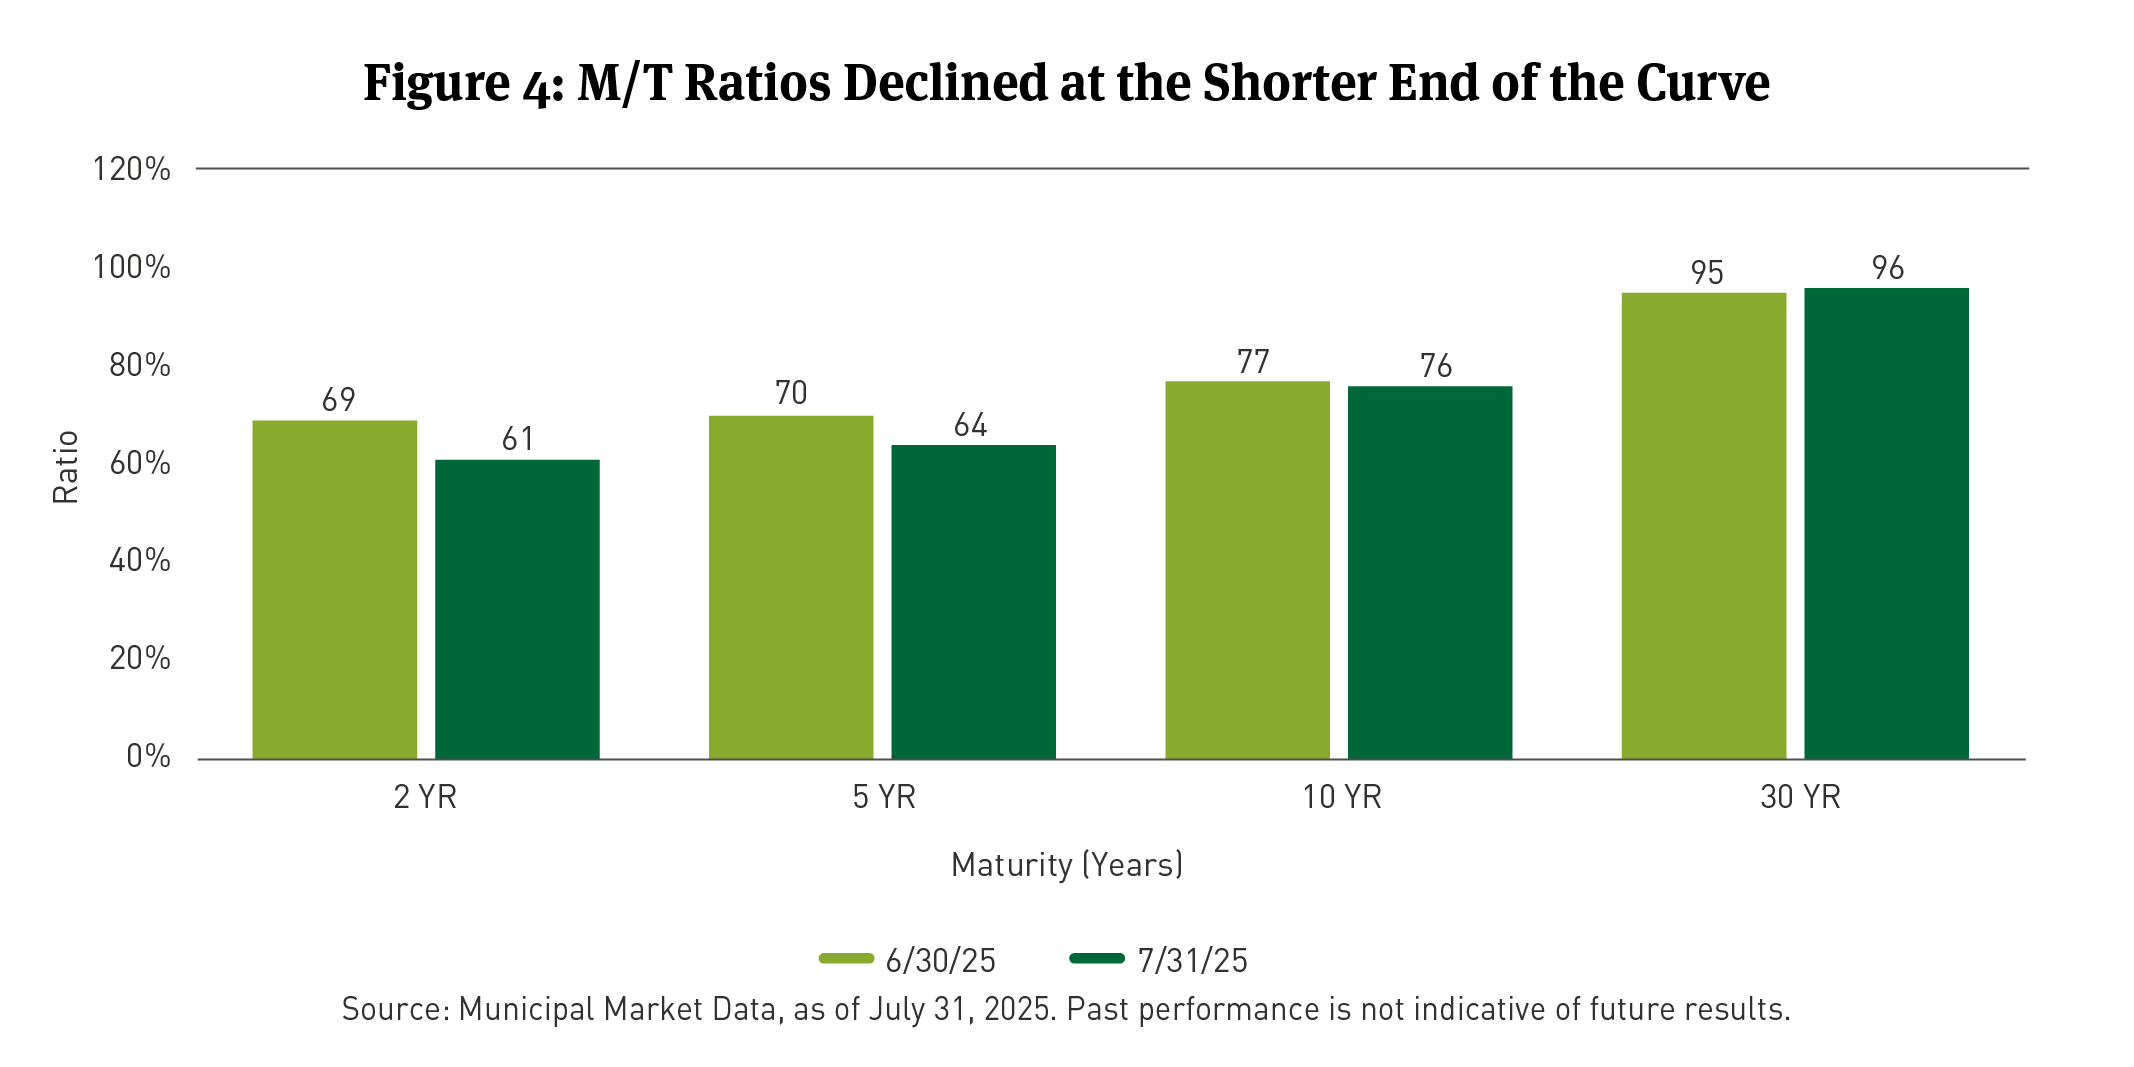
Municipal/Treasury Ratios6 (M/T Ratios) dipped by 8 and 6 ratios at 2 and 5 years, while holding fairly unchanged at 10 and 30 years (See Figure 4).
Through July 31, monthly municipal bond fund net asset inflows exceeded $1.7 billion, LSEG reported, and totaled about $9.1 billion year-to-date (YTD).
Corporate Market Review
The U.S. Corporate Index OAS tightened by 7bps in July. The Corporate Bond Index earned a total return of 0.07 percent and an excess return of 0.56 percent.
According to BBG data, the best-performing sectors were Sovereign bonds, Independent Oil and Gas producers, Electric Utilities, Oil Refining and Natural Gas producers. The worst-performing sectors were Health Insurance, Cable Satellite, Supranational financing entities, Foreign Agencies and Chemical companies. Bonds rated BBB fared the best across the IG quality spectrum, while AA rated bonds fared the worst.
Total fixed rate gross IG supply in July was $89.8 billion. After $119 billion in redemptions, net supply was a negative total of $29.4 billion, BBG reported.
Through July 23, 2025, month-to-date flows to taxable mutual and exchange-traded funds (ETFs) was more than $59 billion, according to the Investment Company Institute (ICI).
Securitized Market Review
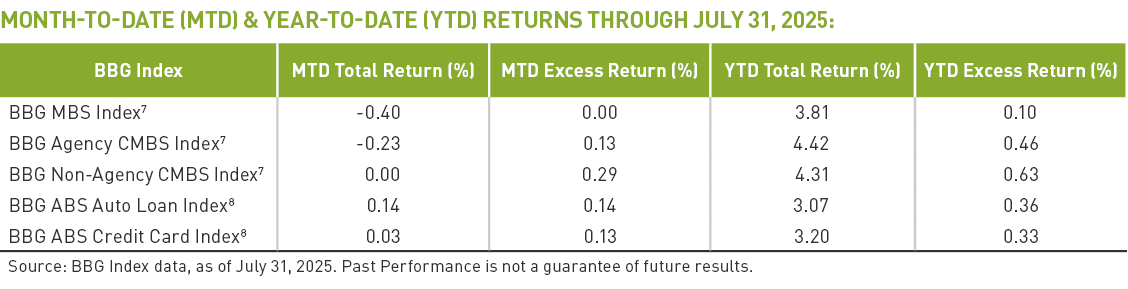
MBS MTD total returns were mostly negative while excess returns were mostly positive. ABS MTD total and excess returns were positive. YTD total and excess returns across MBS and ABS sectors were positive through July 31, 2025.
According to BBG data, conventional9 and Ginnie Mae10 MBS with coupons ranging from 5.5 to 6.5 outperformed others in their categories.
Auto loan ABS outperformed credit card ABS on a total and excess return basis MTD through July 31. Total returns for credit card ABS exceeded auto loan ABS YTD through July, while auto loan excess returns beat credit cards.
Equity Market Review
The S&P Index earned a positive monthly return of 2.2 percent in July. The VIX Index declined (See Figure 5).
At a sector level, 6 of 11 sectors earned positive monthly returns, led by Information Technology (5.2 percent) and Utilities (4.9 percent). Industrials (3 percent), Energy (2.9 percent), Consumer Discretionary (2.6 percent) and Communication Services (2.4 percent) also turned in positive results. Negative returns were recorded in Health Care (-3.3 percent), Consumer Staples (-2.4 percent), Materials (-0.4 percent), Real Estate (-0.1 percent) and Financials (-0.05 percent).
The Russell 1000 Value Index11 gained 0.6 percent, while the Russell 1000 Growth Index12 added 3.8.
From a factor perspective, Momentum and Dividends delivered positive returns, while Volatility, Growth, Value, Size and Quality were negative.
On August 1, FactSet reported, “About two-thirds of the way through the second quarter earnings season, the S&P 500 is reporting strong results. Both the percentage of S&P 500 companies reporting positive earnings surprises and the magnitude of earnings surprises are above their 10-year averages.” The S&P 500 is reporting double-digit Y/Y earnings growth for the third consecutive quarter.
[1] Returns are as of July 31, 2025, for the Bloomberg Municipal Managed Money Short/Intermediate (1-10) Index, which measures the performance of the publicly traded municipal bonds that cover the USD-denominated short/intermediate term tax-exempt bond market, including state and local general obligation bonds, revenue bonds, insured bonds, and pre-refunded bonds. It is rules-based and market-value weighted. You cannot invest directly in an index.
[2] IG Corporate bond performance as of July 31, 2025, is as measured by the BBG U.S. Corporate Investment Grade Bond Index, an unmanaged market-value-weighted index of investment grade corporate fixed-rate debt issues with maturities of one year or more. You cannot invest directly in an index.
[3] Excess return refers to the amount by which an investment's actual return exceeds what is expected, given its risk level. It measures how much an investment outperforms a benchmark or a risk-free rate. A positive excess return indicates outperformance, while a negative one suggests underperformance. Bond excess return is typically the return of a corporate or securitized bond compared to the return of a U.S. Treasury security of the same maturity.
[4] The S&P 500 Index consists of 500 stocks chosen for market size, liquidity, and industry group representation. Itis a market-value-weighted index with each stock’s weight in the index proportionate to its market value. You cannot invest directly in an index.
[5] The Bloomberg U.S. Treasury Bond Index is an unmanaged index of prices of U.S. Treasury bonds with maturities of 1 to 30 years. You cannot invest directly in an index. You cannot invest directly in an index.
[6] The Municipal/Treasury (M/T) ratio compare yields of municipals bonds with those of U.S. Treasury bonds of the same maturity. M/T ratios can show the relative value of municipal bonds compared with taxable bonds, by indicating when yields for municipal bonds exceed the after-tax yields on taxable bonds. M/T ratio data is per Municipal Market Data, as of May 31, 2025.
[7] The Bloomberg MBS Index tracks agency mortgage-backed pass-through securities (both fixed-rate and hybrid ARM) guaranteed by government-sponsored enterprises (GSEs) Government National Mortgage Association (Ginnie Mae) (GNMA), Federal National Mortgage Association (Fannie Mae) (FNMA), and Federal Home Loan Mortgage Corporation (Freddie Mac) (FHLMC). The index is constructed by grouping individual pools into aggregates or generics based on program, coupon, and vintage. You cannot invest directly in an index.
[8] Bloomberg U.S. Asset-Backed Securities (ABS) Index is the ABS component of the Bloomberg U.S. Aggregate Bond Index, a flagship measure of the U.S. investment grade, fixed-rate bond market. The ABS index has three subsectors: credit and credit cards, autos, and utility. You cannot invest directly in an index.
[9] Conventional MBS are issued by the Federal National Mortgage Association (FNMA) and the Federal Home Loan Mortgage Corporation (FHLMC).
[10] Ginnie Mae MBS are issued by the Government National Mortgage Association (GNMA).
[11] The Russell 1000® Value Index is an unmanaged market capitalization-weighted index of value-oriented stocks of U.S. domiciled companies that are included in the Russell 1000 Index. Value-oriented stocks tend to have lower price-to-book ratios and lower forecasted growth values. You cannot invest directly in an index.
[12] The Russell 1000® Growth Index is an unmanaged market capitalization-weighted index of growth-oriented stocks of U.S. domiciled companies that are included in the Russell 1000 Index. Growth-oriented stocks tend to have higher price-to-book ratios and higher forecasted growth values. You cannot invest directly in an index.
BCAI-08072025-rejsvznl (8/10/2025)
DISCLAIMERS:
This material provides general information and should not be construed as a solicitation or offer of services or products or as legal, tax or investment advice. Nothing contained herein should be considered a guide to security selection, asset allocation or portfolio construction.
All information and opinions are current as of the dates indicated and are subject to change. Breckinridge believes the data provided by unaffiliated third parties to be reliable but investors should conduct their own independent verification prior to use. Some economic and market conditions contained herein have been obtained from published sources and/or prepared by third parties, and in certain cases have not been updated through the date hereof.
There is no assurance that any estimate, target, projection or forward-looking statement (collectively, “estimates”) included in this material will be accurate or prove to be profitable; actual results may differ substantially. Breckinridge estimates are based on Breckinridge’s research, analysis and assumptions. Other events that were not considered in formulating such projections could occur and may significantly affect the outcome, returns or performance.
Not all securities or issuers mentioned represent holdings in client portfolios. Some securities have been provided for illustrative purposes only and should not be construed as investment recommendations. Any illustrative engagement or sustainability analysis examples are intended to demonstrate Breckinridge’s research and investment process.
Yields and other characteristics are metrics that can help investors in valuing a security, portfolio or composite. Yields do not represent performance results but they are one of several components that contribute to the return of a security, portfolio or composite. Yields and other characteristics are presented gross of advisory fees.
All investments involve risk, including loss of principal. No investment or risk management strategy, including diversification, can guarantee positive results or risk elimination in any market. Periods of elevated market volatility can significantly impact the value of securities. Investors should consult with their advisors to understand how these risks may affect their portfolios and to develop a strategy that aligns with their financial goals and risk tolerances.
Past performance is not indicative of future results. Breckinridge makes no assurances, warranties or representations that any strategies described herein will meet their investment objectives or incur any profits. Performance results for Breckinridge’s investment strategies include the reinvestment of interest and any other earnings, but do not reflect any brokerage or trading costs a client would have paid. Results may not reflect the impact that any material market or economic factors would have had on the accounts during the time period. Due to differences in client restrictions, objectives, cash flows, and other such factors, individual client account performance may differ substantially from the performance presented.
Actual client advisory fees may differ from the advisory fee used to calculate net performance results. Client returns will be reduced by the advisory fees and any other expenses incurred in the management of their accounts. For example, an advisory fee of 1 percent compounded over a 10-year period would reduce a 10 percent return to a 9 percent annual return. Additional information on fees can be found in Breckinridge’s Form ADV Part 2A.
Index results are shown for illustrative purposes and do not represent the performance of any specific investment. Indices are unmanaged and investors cannot directly invest in them. They do not reflect any management, custody, transaction or other expenses, and generally assume reinvestment of dividends, income and capital gains. Performance of indices may be more or less volatile than any investment strategy.
Fixed income investments have varying degrees of credit risk, interest rate risk, default risk, and prepayment and extension risk. In general, bond prices rise when interest rates fall and vice versa.
Equity investments are volatile and can decline significantly in response to investor reception of the issuer, market, economic, industry, political, regulatory or other conditions.
BLOOMBERG® is a trademark and service mark of Bloomberg Finance L.P. and its affiliates (collectively “Bloomberg”). Bloomberg does not approve or endorse this material or guarantees the accuracy or completeness of any information herein, or makes any warranty, express or implied, as to the results to be obtained therefrom and, to the maximum extent allowed by law, neither shall have any liability or responsibility for injury or damages arising in connection therewith.
The S&P500 Index (“Index”) and associated data is a product of S&P Dow Jones Indices LLC, its affiliates and/or their licensors and has been licensed for use by Breckinridge. © 2025 S&P Dow Jones Indices LLC, its affiliates and/or their licensors. All rights reserved. Redistribution or reproduction in whole or in part are prohibited without written permission of S&P Dow Jones Indices LLC. For more information on any of S&P Dow Jones Indices LLC’s indices please visit www.spdji.com. S&P® is a registered trademark of Standard & Poor’s Financial Services LLC (“SPFS”) and Dow Jones® is a registered trademark of Dow Jones Trademark Holdings LLC (“Dow Jones”). Neither S&P Dow Jones Indices LLC, SPFS, Dow Jones, their affiliates nor their licensors (“S&P DJI”) make any representation or warranty, express or implied, as to the ability of any index to accurately represent the asset class or market sector that it purports to represent and S&P DJI shall have no liability for any errors, omissions, or interruptions of any index or the data included therein.