Investing
Commentary published on February 10, 2026
January 2026 Market Commentary
Summary
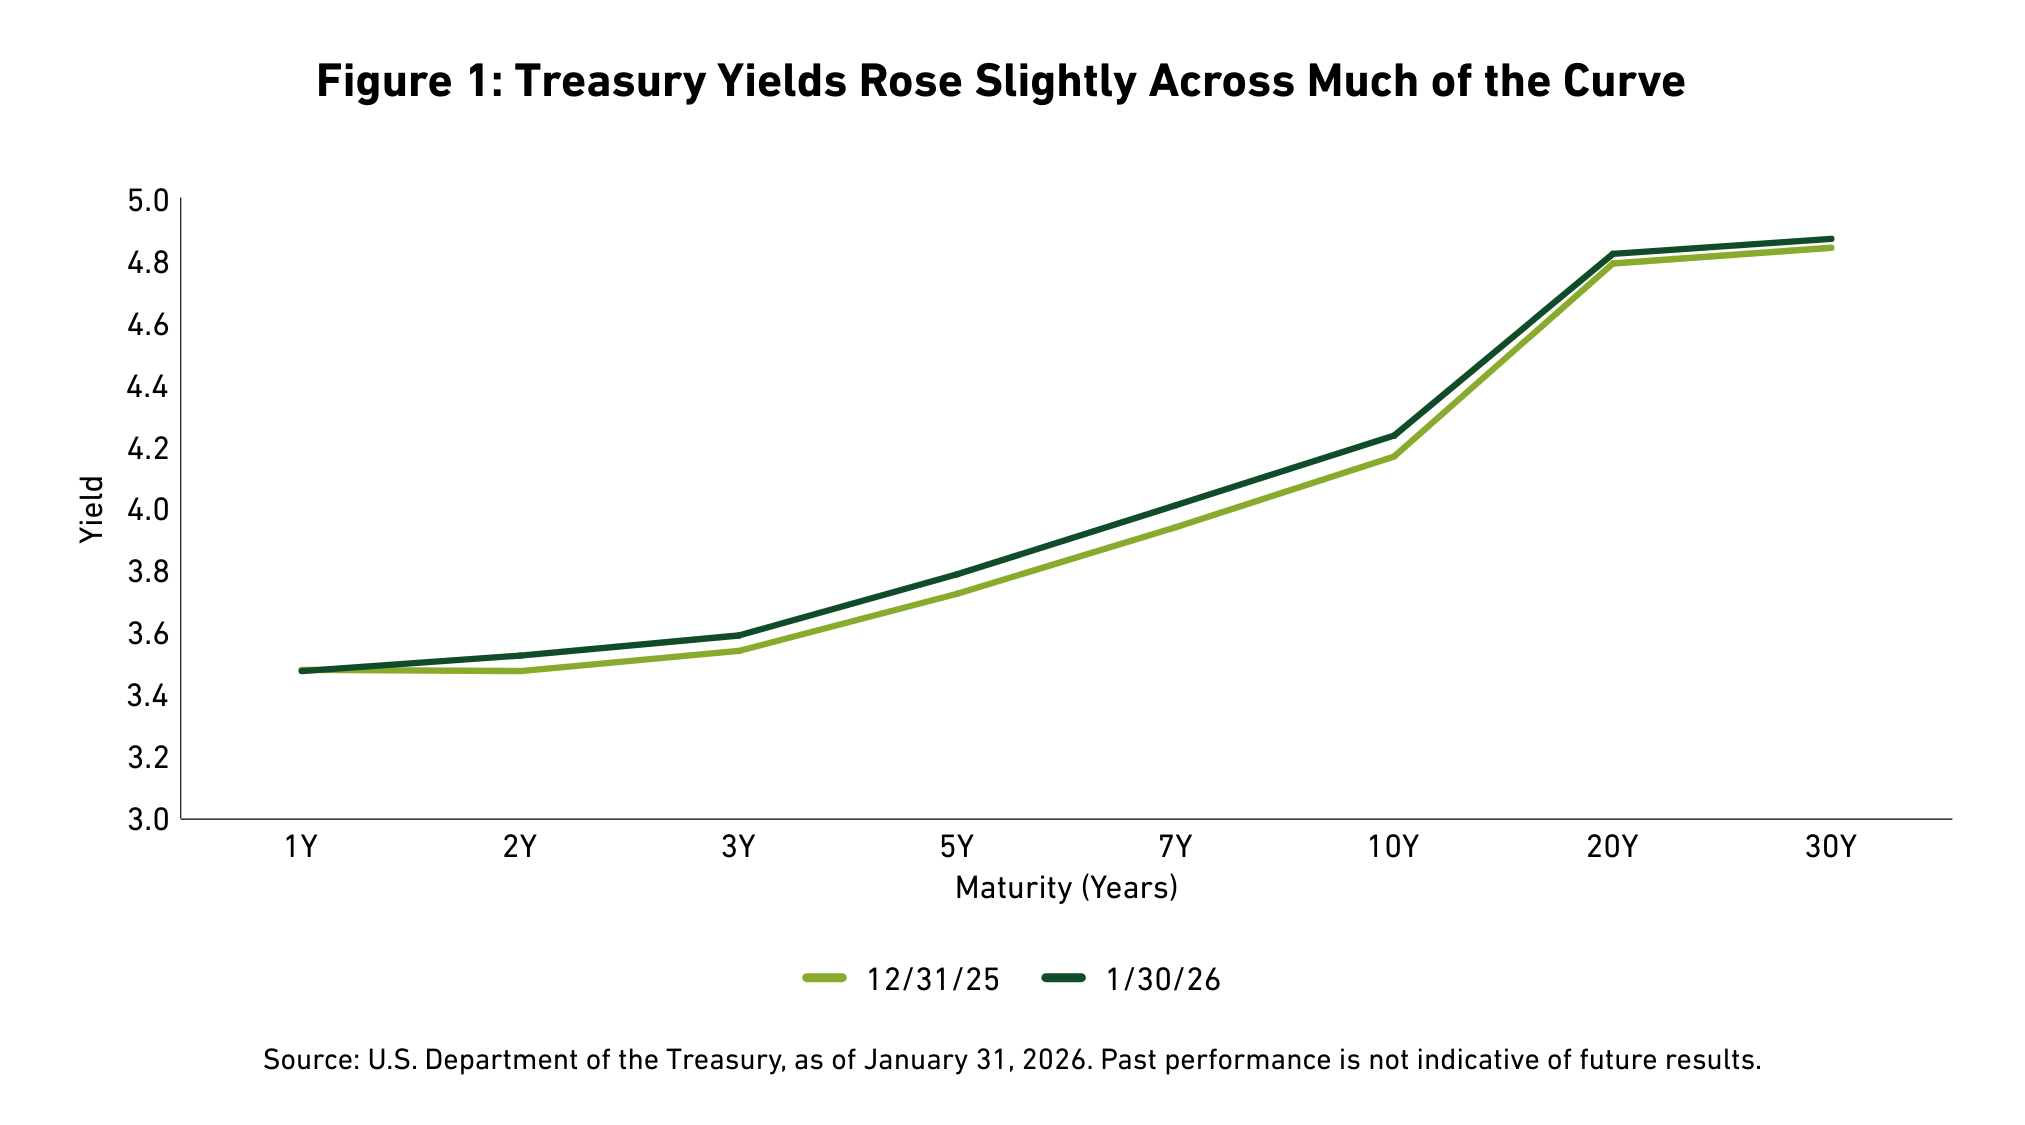
- U.S. Treasury Curve: Treasury yields rose modestly across the curve during January, with the 2-year and 10-year maturities seeing increases of 5 basis points (bps), as markets adjusted to shifting economic data.
- Municipal Market Rates and Technicals: Municipal bonds delivered positive returns, supported by a constructive technical environment characterized by lower supply levels and strong demand. The 10-year Municipal/Treasury [1] (M/T) ratio ended the month lower at 62 percent.
- Corporate Market Technicals: The Bloomberg (BBG) Corporate Investment Grade Index [2] (the Corporate Bond Index) option-adjusted spread (OAS) tightened by 5bps, and monthly investment-grade bond issuance reached a robust $289.9 billion.
- Securitized Trends: Both mortgage-backed (MBS) and asset-backed (ABS) securities performed well in January, delivering positive total and excess returns amid steady demand and tightening spreads.
- Equity Market Trends: The S&P 500 Index [3] gained 1.45 percent for the month, with performance leadership concentrated in the Energy and Materials sectors.
The following commentary is a summary of discussions among members of the Breckinridge Capital Advisors Investment Committee, as they reviewed monthly activity in the markets and investment returns. The members of the Investment Committee, under the leadership of Co-Chief Investment Officers Matthew Buscone and Jeffrey Glenn, CFA, are Co-Heads of Research, Nicholas Elfner and Adam Stern, J.D., M.P.A.; and Portfolio Manager and Director, Corporate Research, Josh Perez, CFA.
Market Review
The U.S. economy demonstrated significant resilience in the third quarter, expanding at a solid 4.4 percent pace—the strongest growth recorded in two years. Against this backdrop of expansion, the Federal Open Market Committee (FOMC) elected to hold interest rates steady between 3.50 percent and 3.75 percent in January. The Breckinridge Investment Committee (IC) noted the FOMC’s focus on a stabilizing labor market, with the unemployment rate holding at 4.4 percent, while inflation remains above the 2-percent target. Market attention also turned to political shifts at the Federal Reserve (Fed) following the nomination of Kevin Warsh as the next Chair. As a former Governor, Warsh is recognized for his historical emphasis on rigorous inflation control and balance sheet management, suggesting a potential shift in the central bank's future policy leanings.
Treasury yields moved higher across the curve in January (See Figure 1). According to the U.S. Department of the Treasury, yields for 2-, 5-, 10-, and 30-year maturities increased by 5, 6, 7, and 3bps, respectively. This upward pressure on rates led the BBG U.S. Treasury Index4 to record a modest decline, with a total return of -0.09 percent for the month.
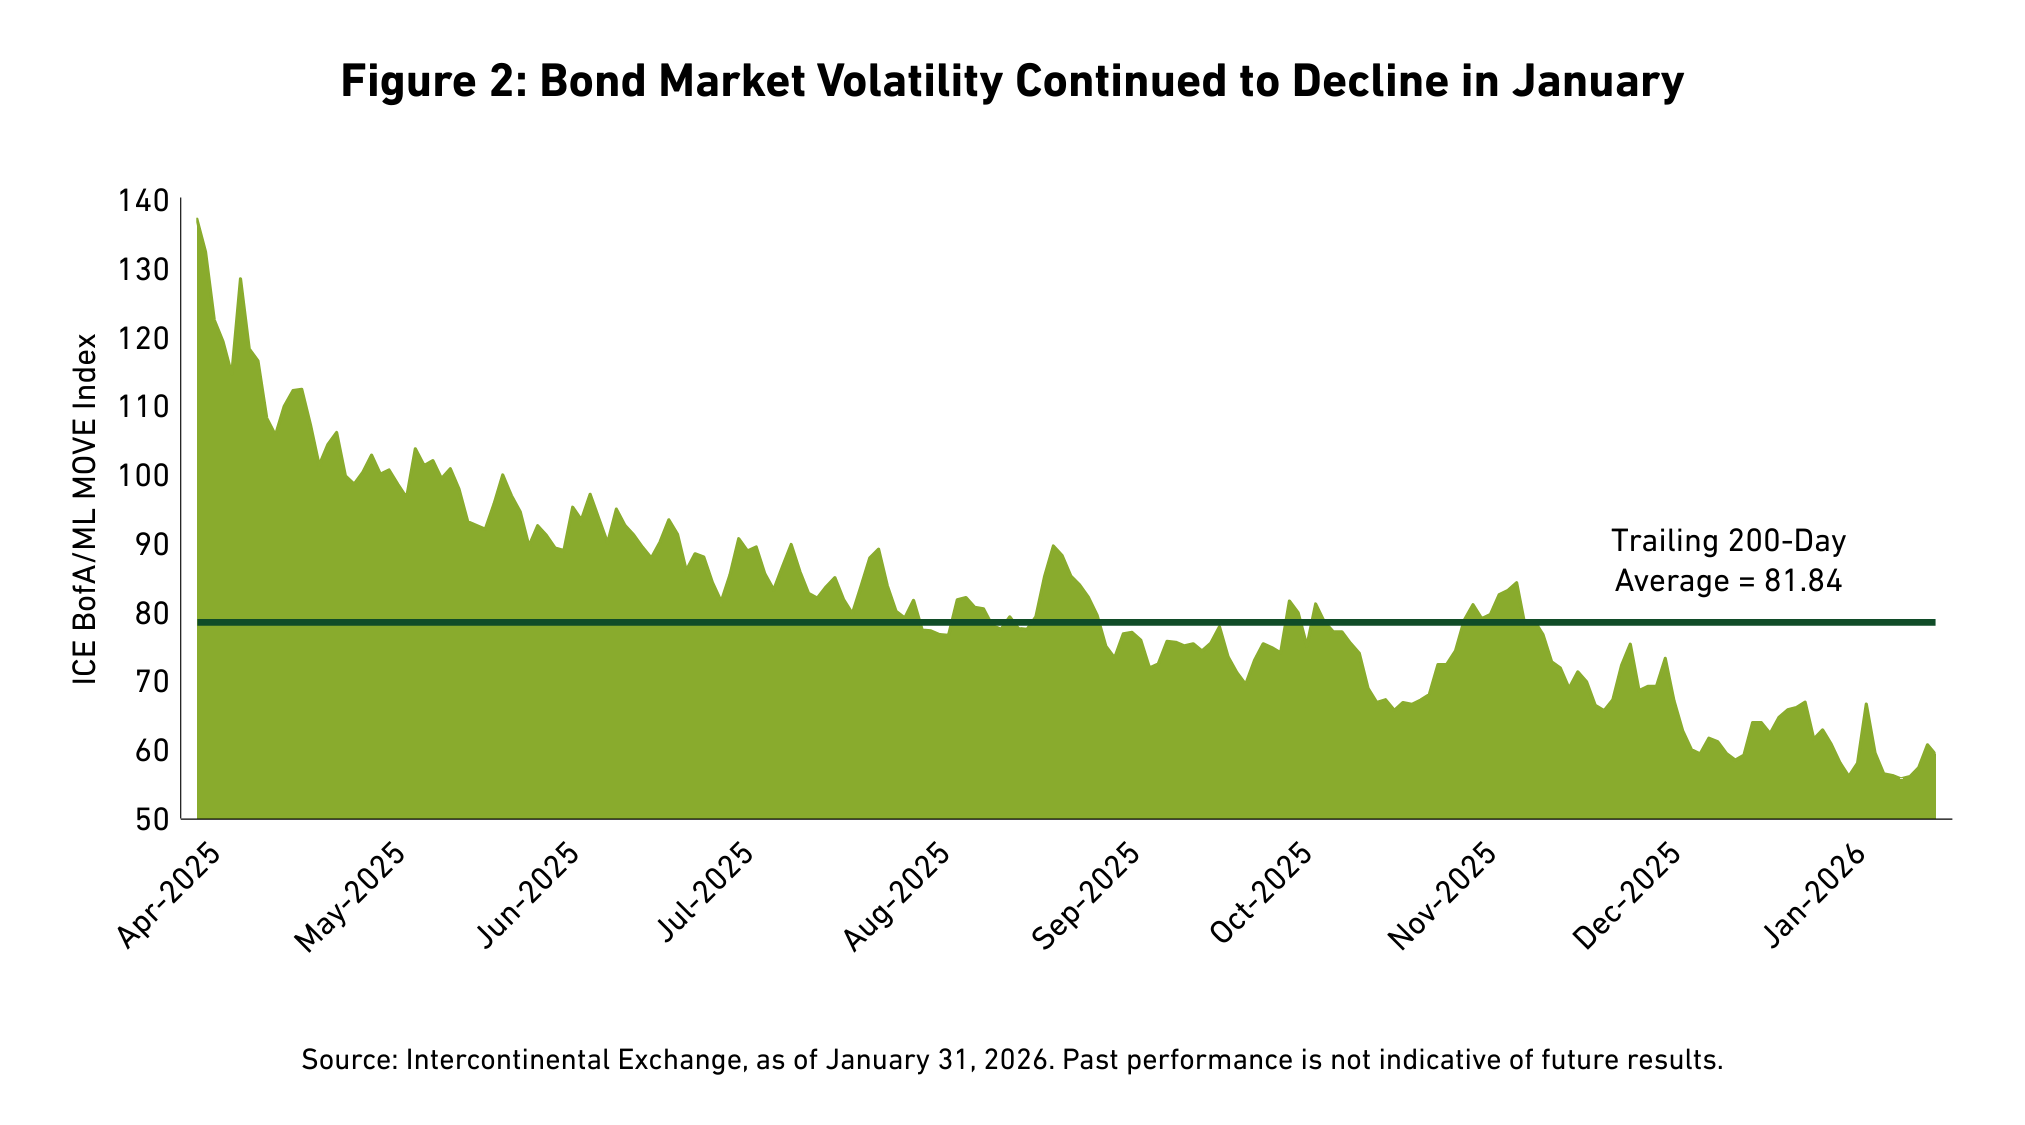
Declining volatility remained a persistent theme in the fixed income markets, evidenced by the ICE Bank of America/Merrill Lynch Option Volatility Estimate (MOVE) Index5 ending the period at a 200-day moving average of 81.84 (See Figure 2), below 2025’s year-end level.
Looking ahead, the IC anticipates that the Fed will implement a single interest rate cut during the first half of 2026, as inflation persists above the 2 percent target. We expect the 10-year Treasury yield to remain largely range-bound between 4 percent and 4.5 percent, a level that should continue to attract flows into investment-grade fixed income. Consequently, we maintain a defensive portfolio posture, wary of tight valuations in spread sectors and the potential risks inherent in elevated equity valuations.
Municipal Market Review
Municipal bond issuance moderated in January, totaling $36 billion compared to $40 billion in December 2025. Inflows were strong across open-end funds, ETFs and the SMA complex. Year-to-date inflows are over $11 billion. Lower supply, paired with seasonal reinvestment capital, created a supportive technical backdrop that favored the asset class and helped munis outperform Treasuries.
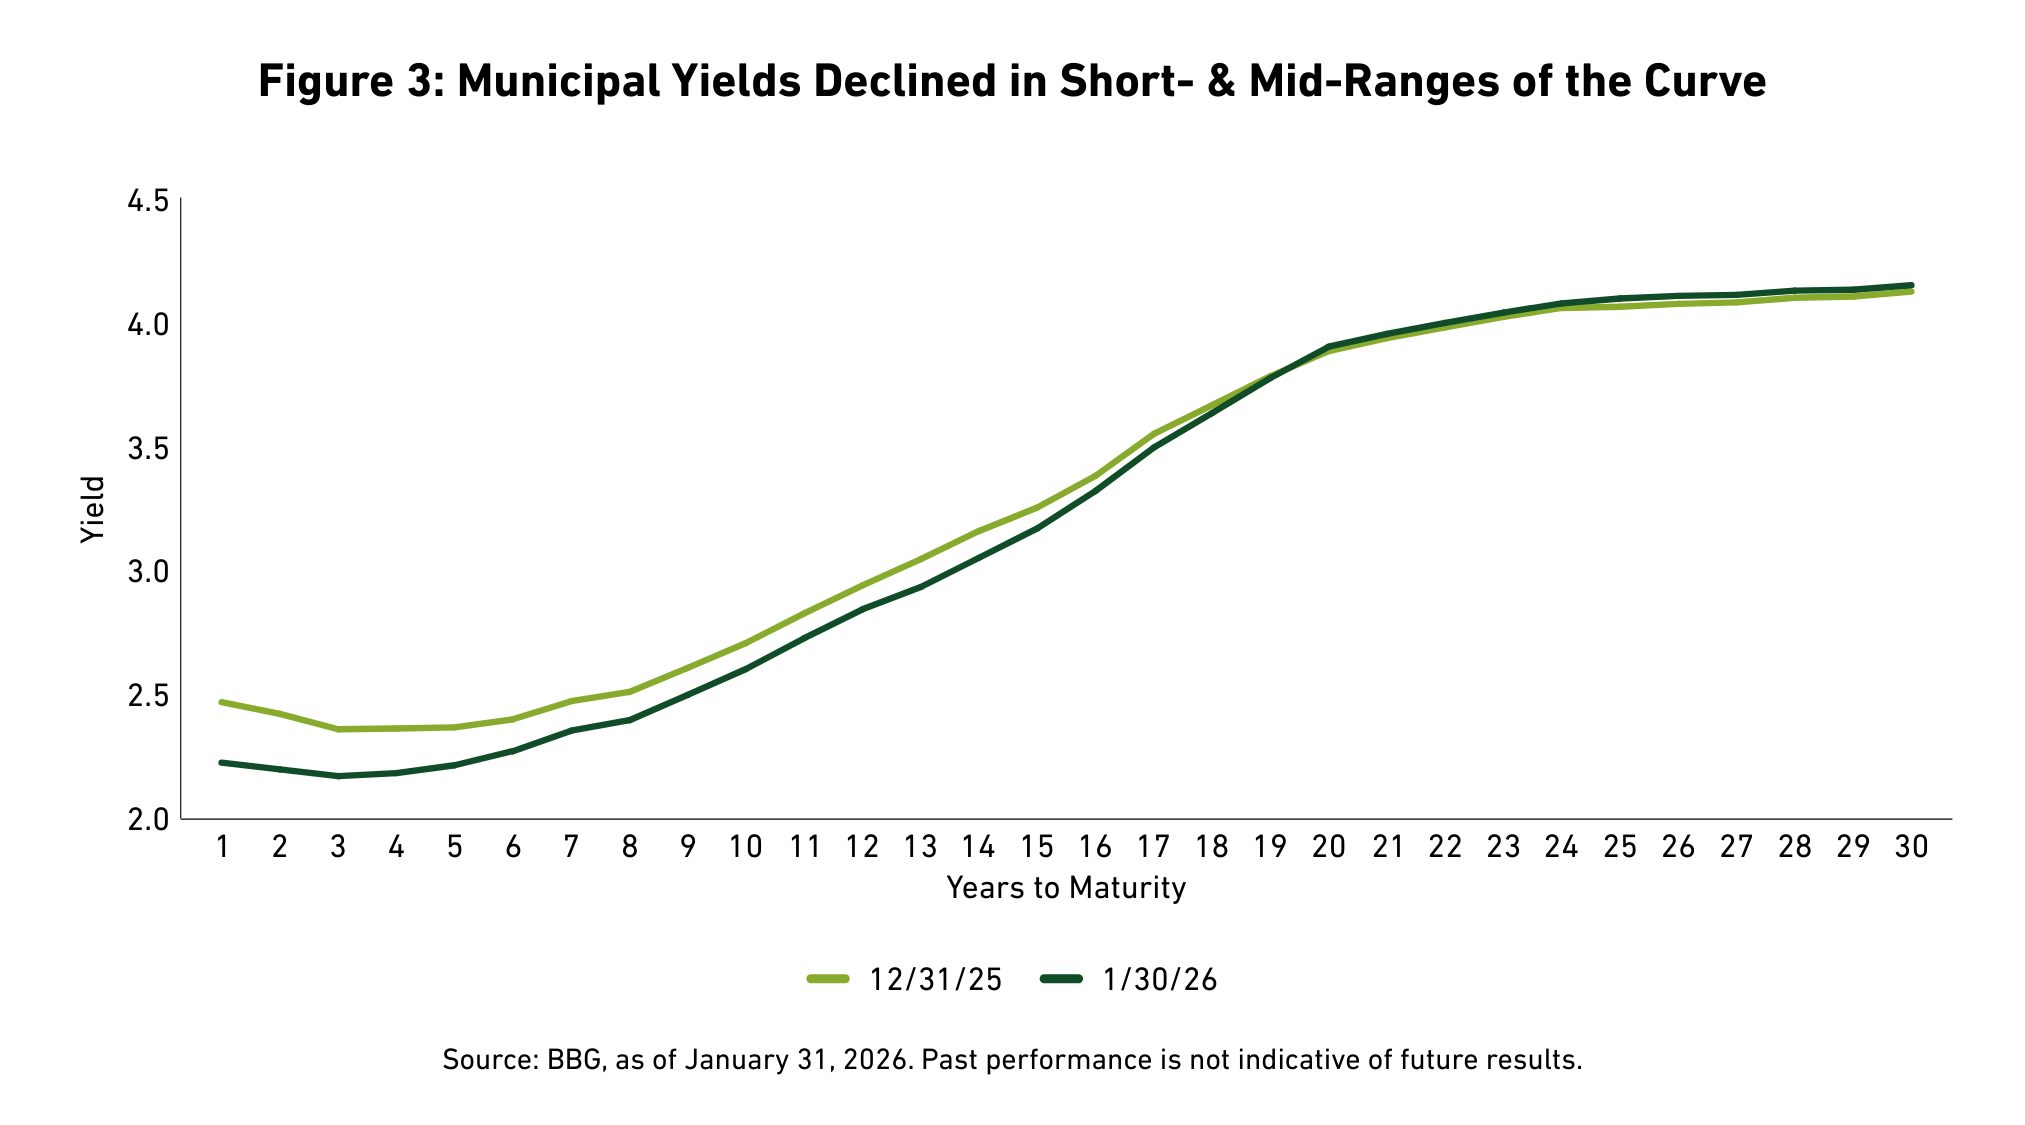
Reflecting this strength, the BBG Managed Money Short/Intermediate Index6 returned 1.08 percent. Yields fell across most of the curve, with the 2-, 5-, and 10-year maturities decreasing by 23, 15, and 11bps, respectively (See Figure 3). This movement, contrasted by a 3bps rise in the 30-year yield, resulted in a bull steepening of the municipal curve.
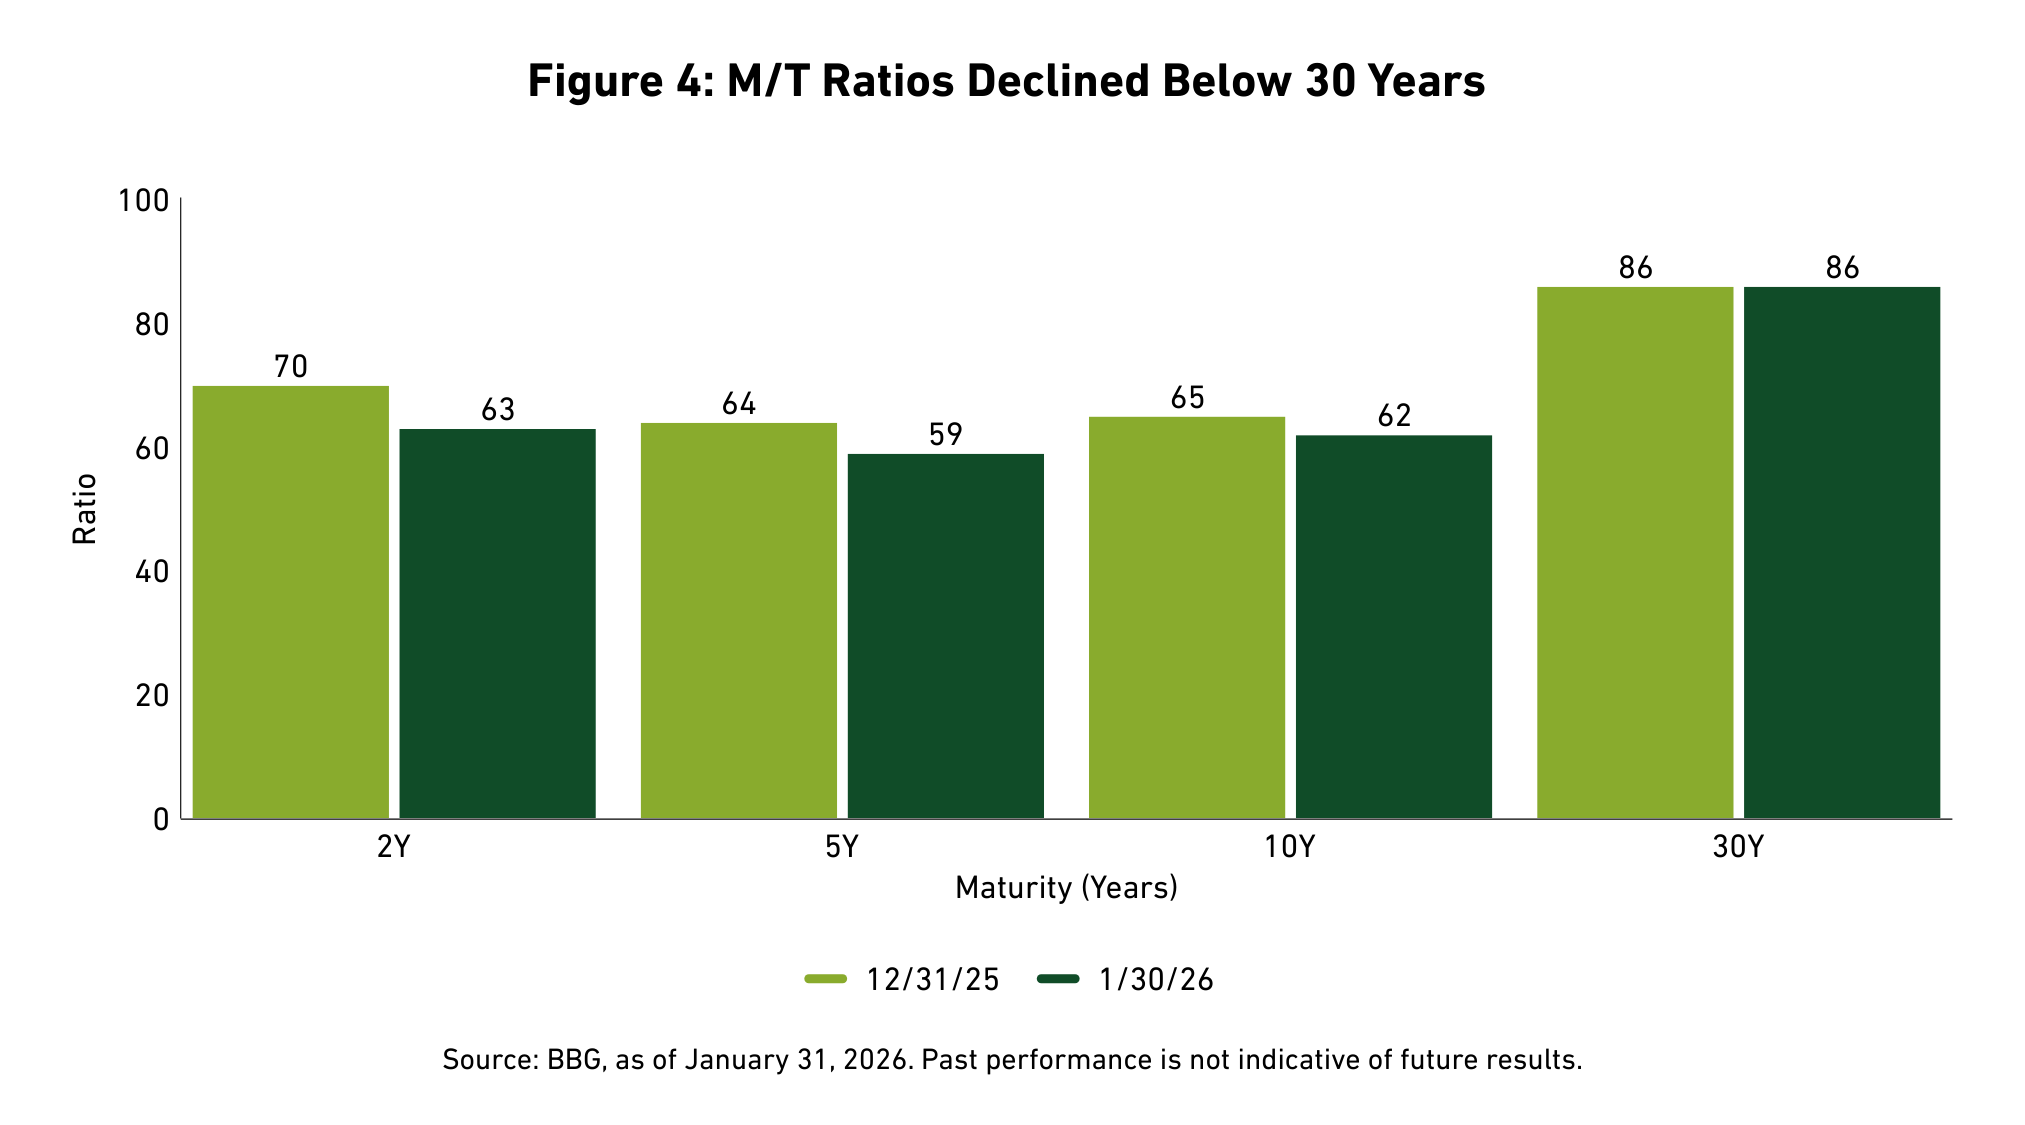
Relative valuations also shifted, with M/T ratios ending the month at 63 percent for the 2-year, 59 percent for the 5-year, 62 percent for the 10-year, and 86 percent for the 30-year (See Figure 4). These figures underscore the significant outperformance of municipal bonds relative to their taxable counterparts. Investors may be rebalancing to more fixed income exposure after another strong year of equity returns but after nine straight months of positive returns, lower yields and relative value readings may slow returns from here. In response to recent performance, we have moved to shorten the duration target on our intermediate strategy and reduce exposure to bonds with maturities of 10 years and longer.
Corporate Market Review
The corporate credit environment remained favorable in January, as the Corporate Bond Index OAS tightened by 5bps. Spread tightening contributed to an excess return of 0.34 percent for the Corporate Bond Index, while the total return for the month reached 0.18 percent.
Sector dispersion was evident throughout the month. Per BBG, the strongest performers included Independent Oil Exploration & Production, Oil Field Services, Transportation Services, Refining, and Midstream Oil and Gas Services. Conversely, Media Entertainment, Health Insurance, and Sovereigns lagged the broader market.
Primary market activity was notably high, with gross corporate bond issuance reaching $289.9 billion—a 9 percent increase over the same period last year. After accounting for $170.3 billion in redemptions, net issuance for January totaled $119.6 billion. Investor appetite for corporate bonds remains healthy; the Investment Company Institute reported $82.7 billion in taxable bond fund flows over the 30-day period ended January 31.
Securitized Market Review
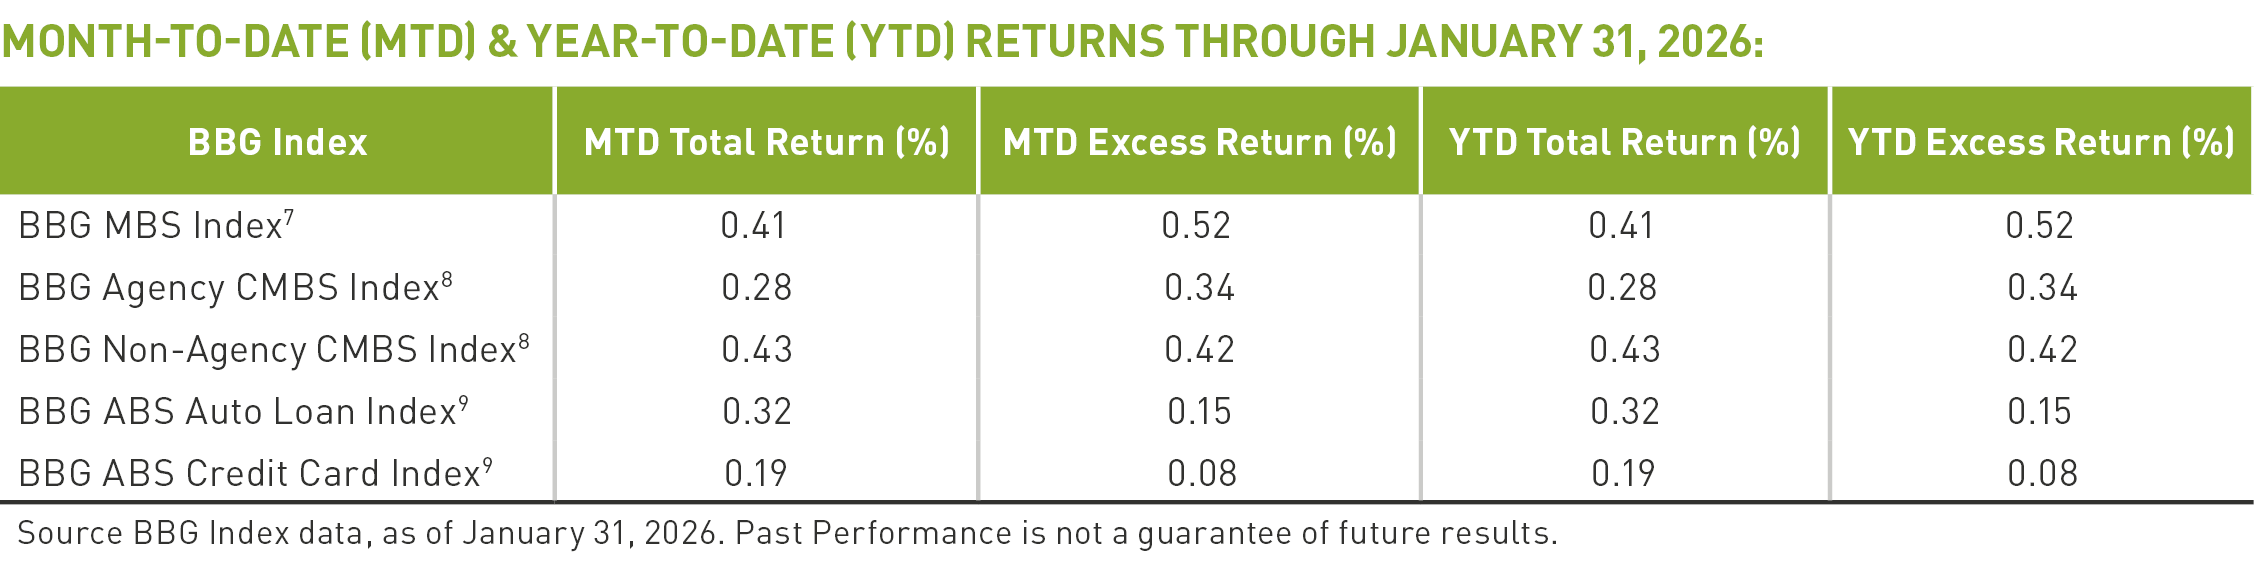
The securitized sectors provided steady gains in January. BBG reported that MBS delivered a total return of 0.41 percent and an excess return of 0.52 percent as spreads tightened after President Trump directed the government-sponsored enterprises (GSEs) to purchase $200 billion in MBS. Within the broader sector, Commercial MBS (CMBS) posted a 0.35 percent total return, while Agency and Non-Agency CMBS returned 0.28 percent and 0.43 percent, respectively. These results were driven largely by favorable technicals, as Agency MBS spreads tightened by 6bps, with particular strength in mid-coupon issues.
Similarly, ABS generated a total return of 0.25 percent and an excess return of 0.14 percent. Auto Loans led subsector performance with a 0.32 percent return, while Credit Card Loans returned 0.19 percent. Robust demand for new auto loan issuance helped compress ABS spreads by 4bps during the month.
Equity Market Review
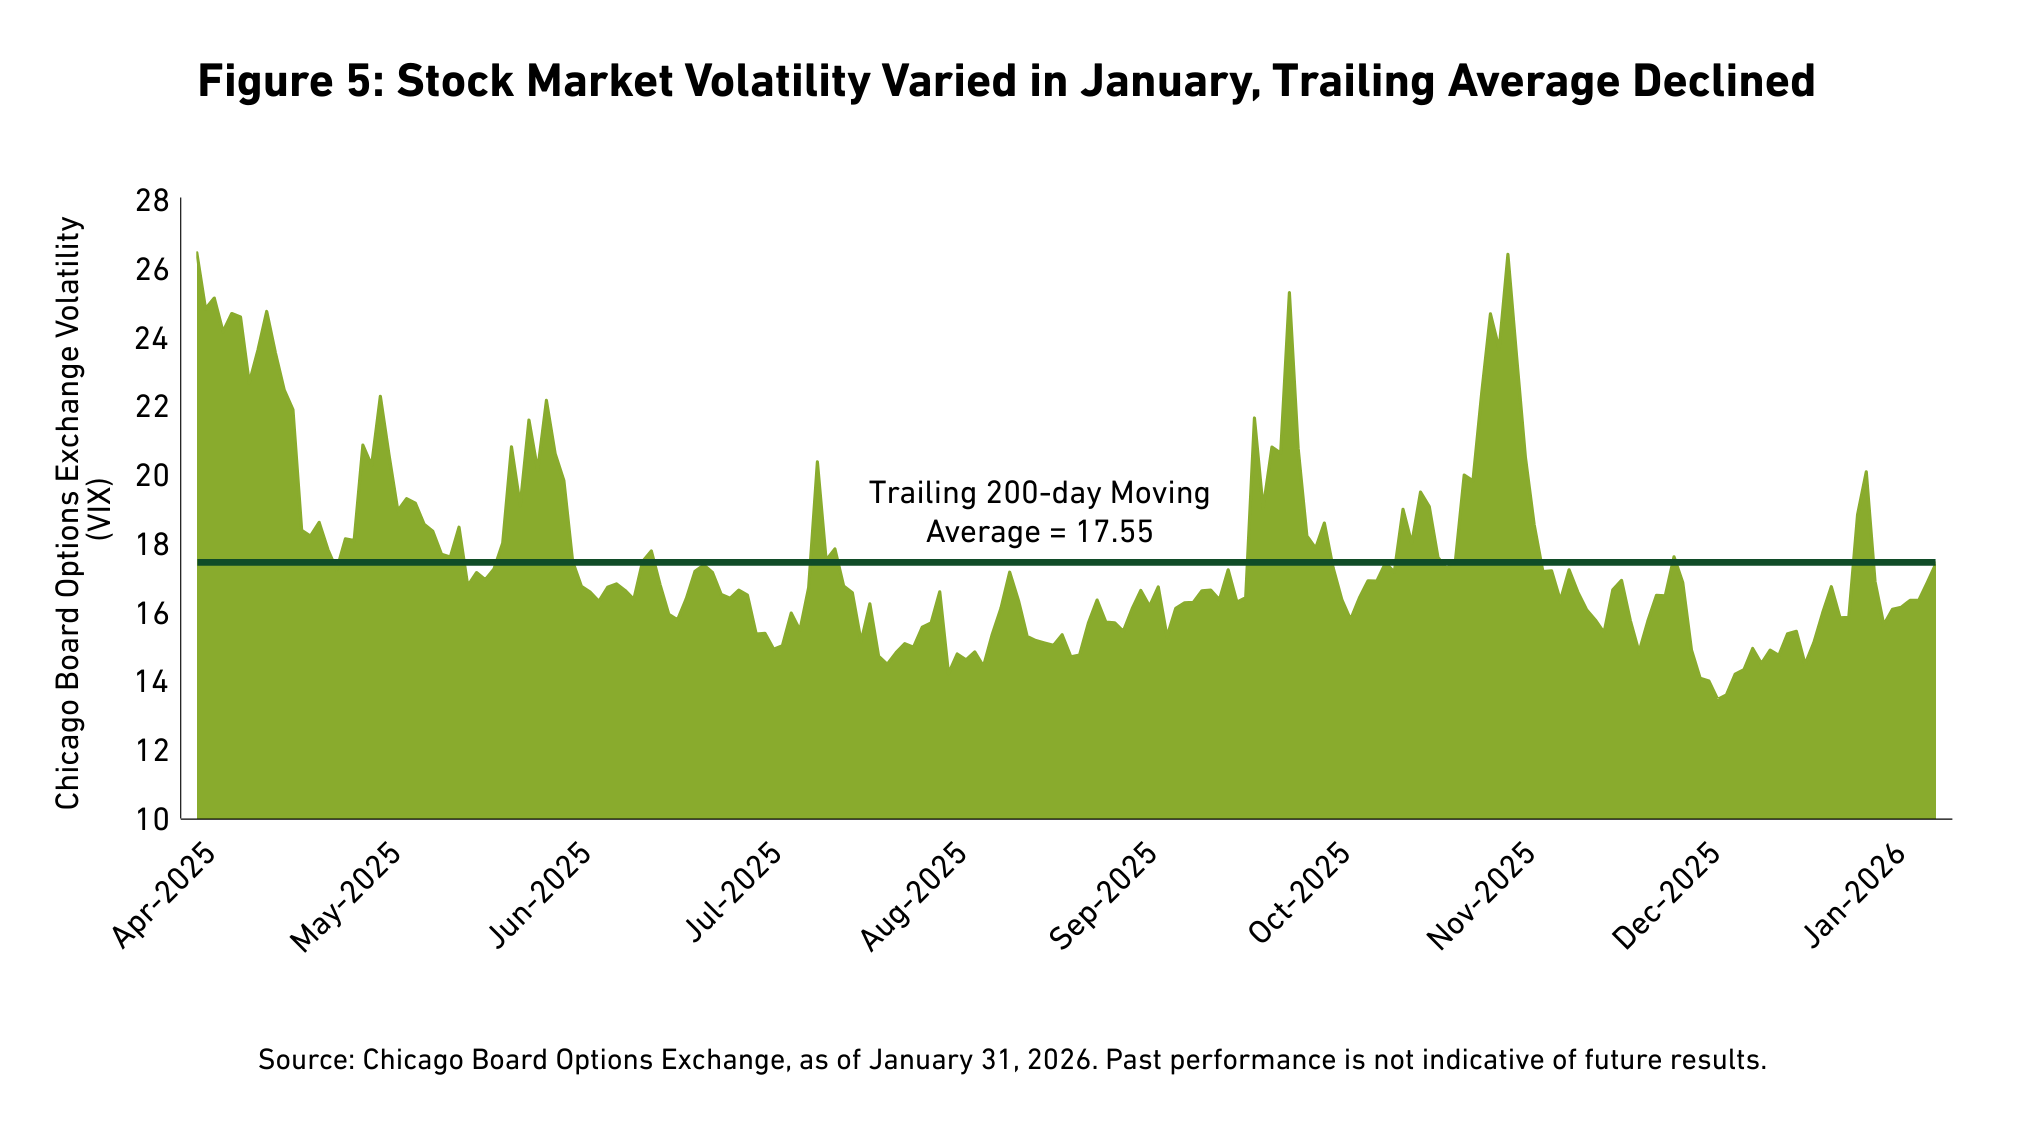
Equity markets maintained their upward trajectory, with the S&P 500 Index generating a total monthly return of 1.45 percent. Market sentiment appeared relatively stable, as the Chicago Board Options Exchange (CBOE) Volatility Index10 (VIX) concluded January with a trailing 200-day moving average of 17.55 (See Figure 5).
Sector performance was highly bifurcated. Energy (14.43 percent), Materials (8.70 percent), and Consumer Staples (7.71 percent) led the market higher. In contrast, the Financials (-2.50 percent), Information Technology (-1.66 percent), and Health Care (-0.02 percent) sectors faced headwinds. This rotation was reflected in style performance: the Russell 1000 Value Index climbed 4.56 percent, while the Russell 1000 Growth Index declined 1.51 percent. Momentum, Dividend Yield, and Value factors outperformed, while Growth, Quality, and Profitability were laggards.
Fundamental data remains a pillar of support for equities. Current earnings results reported for the fourth quarter of 2025 reveal a record blended net profit margin of 13.2 percent for the S&P 500, according to Factset. Fourth quarter earnings show 15 percent year-over-year (Y/Y) growth with approximately one third of companies reporting, marking the fifth consecutive quarter of double-digit Y/Y earnings growth.
[1] The Municipal/Treasury (M/T) ratio compares yields of municipal bonds with those of U.S. Treasury bonds of the same maturity. M/T ratios can show the relative value of municipal bonds compared with taxable bonds, by indicating when yields for municipal bonds exceed the after-tax yields on taxable bonds.
[2] As of January 31, 2026, as measured by the BBG U.S. Corporate Investment Grade Bond Index, an unmanaged market-value-weighted index of investment grade corporate fixed-rate debt issues with maturities of one year or more. You cannot invest directly in an index.
[3] The S&P 500 Index consists of 500 stocks chosen for market size, liquidity, and industry group representation. It is a market-value-weighted index with each stock’s weight in the index proportionate to its market value. Performance is as of January 31, 2026. You cannot invest directly in an index.
[4] The BBG U.S. Treasury Bond Index is an unmanaged index of prices of U.S. Treasury bonds with maturities of 1 to 30 years. You cannot invest directly in an index
[5] As of January 31, 2026, based on the Intercontinental Exchange (ICE) Bank of America/Merrill Lynch Option Volatility Estimate (MOVE) Index, which tracks the movement in U.S. Treasury yield volatility implied by current prices of one-month over-the-counter options on 2-year, 5-year, 10-year, and 30-year Treasuries. Historically, the index rises as concerns grow that interest rates may be higher. You cannot invest directly in an index.
[6] Municipal bond performance is as of January 31, 2026, as measured by the BBG Managed Money Short/Intermediate (1-10) Index, which measures the performance of the publicly traded municipal bonds that cover the USD-denominated short/intermediate term tax-exempt bond market, including state and local general obligation bonds, revenue bonds, insured bonds, and pre-refunded bonds. It is rules-based, and market-value weighted. You cannot invest directly in an index.
[7] The BBG MBS Index tracks agency mortgage-backed pass-through securities (both fixed-rate and hybrid ARM) guaranteed by government-sponsored enterprises (GSEs) Government National Mortgage Association (Ginnie Mae) (GNMA), Federal National Mortgage Association (Fannie Mae) (FNMA), and Federal Home Loan Mortgage Corporation (Freddie Mac) (FHLMC). The index is constructed by grouping individual pools into aggregates or generics based on program, coupon, and vintage. You cannot invest directly in an index.
[8] The BBG U.S. CMBS Investment Grade Index measures the market of U.S. Agency (GNMA, FNMA, and (FHLMC) and U.S. Non-Agency conduit and fusion CMBS deals with a minimum current deal size of $300mn. You cannot invest directly in an index.
[9] BBG U.S. Asset-Backed Securities (ABS) Index is the ABS component of the Bloomberg U.S. Aggregate Bond Index, a flagship measure of the U.S. investment grade, fixed-rate bond market. The ABS index has three subsectors: credit and credit cards, autos, and utility. You cannot invest directly in an index.
[10] The Chicago Board Options Exchange (OEX) Volatility (VIX) Index is the ticker symbol and name for the Chicago Board Options Exchange's (CBOE) Volatility Index, a measure of the stock market's expectation of volatility based on S&P 500 index options. You cannot invest directly in an index.
BCAI-02062026-xusgmqlm (2/10/2026)
DISCLAIMERS:
This material provides general information and should not be construed as a solicitation or offer of services or products or as legal, tax or investment advice. Nothing contained herein should be considered a guide to security selection, asset allocation or portfolio construction.
All information and opinions are current as of the dates indicated and are subject to change. Breckinridge believes the data provided by unaffiliated third parties to be reliable but investors should conduct their own independent verification prior to use. Some economic and market conditions contained herein have been obtained from published sources and/or prepared by third parties, and in certain cases have not been updated through the date hereof.
There is no assurance that any estimate, target, projection or forward-looking statement (collectively, “estimates”) included in this material will be accurate or prove to be profitable; actual results may differ substantially. Breckinridge estimates are based on Breckinridge’s research, analysis and assumptions. Other events that were not considered in formulating such projections could occur and may significantly affect the outcome, returns or performance.
Not all securities or issuers mentioned represent holdings in client portfolios. Some securities have been provided for illustrative purposes only and should not be construed as investment recommendations. Any illustrative engagement or sustainability analysis examples are intended to demonstrate Breckinridge’s research and investment process.
Yields and other characteristics are metrics that can help investors in valuing a security, portfolio or composite. Yields do not represent performance results but they are one of several components that contribute to the return of a security, portfolio or composite. Yields and other characteristics are presented gross of advisory fees.
All investments involve risk, including loss of principal. No investment or risk management strategy, including diversification, can guarantee positive results or risk elimination in any market. Periods of elevated market volatility can significantly impact the value of securities. Investors should consult with their advisors to understand how these risks may affect their portfolios and to develop a strategy that aligns with their financial goals and risk tolerances.
Past performance is not indicative of future results. Breckinridge makes no assurances, warranties or representations that any strategies described herein will meet their investment objectives or incur any profits. Performance results for Breckinridge’s investment strategies include the reinvestment of interest and any other earnings, but do not reflect any brokerage or trading costs a client would have paid. Results may not reflect the impact that any material market or economic factors would have had on the accounts during the time period. Due to differences in client restrictions, objectives, cash flows, and other such factors, individual client account performance may differ substantially from the performance presented.
Actual client advisory fees may differ from the advisory fee used to calculate net performance results. Client returns will be reduced by the advisory fees and any other expenses incurred in the management of their accounts. For example, an advisory fee of 1 percent compounded over a 10-year period would reduce a 10 percent return to a 9 percent annual return. Additional information on fees can be found in Breckinridge’s Form ADV Part 2A.
Index results are shown for illustrative purposes and do not represent the performance of any specific investment. Indices are unmanaged and investors cannot directly invest in them. They do not reflect any management, custody, transaction or other expenses, and generally assume reinvestment of dividends, income and capital gains. Performance of indices may be more or less volatile than any investment strategy.
Fixed income investments have varying degrees of credit risk, interest rate risk, default risk, and prepayment and extension risk. In general, bond prices rise when interest rates fall and vice versa.
Equity investments are volatile and can decline significantly in response to investor reception of the issuer, market, economic, industry, political, regulatory or other conditions.
BLOOMBERG® is a trademark and service mark of Bloomberg Finance L.P. and its affiliates (collectively “Bloomberg”). Bloomberg does not approve or endorse this material or guarantees the accuracy or completeness of any information herein, or makes any warranty, express or implied, as to the results to be obtained therefrom and, to the maximum extent allowed by law, neither shall have any liability or responsibility for injury or damages arising in connection therewith.
The S&P500 Index (“Index”) and associated data is a product of S&P Dow Jones Indices LLC, its affiliates and/or their licensors and has been licensed for use by Breckinridge. © 2026 S&P Dow Jones Indices LLC, its affiliates and/or their licensors. All rights reserved. Redistribution or reproduction in whole or in part are prohibited without written permission of S&P Dow Jones Indices LLC. For more information on any of S&P Dow Jones Indices LLC’s indices please visit www.spdji.com. S&P® is a registered trademark of Standard & Poor’s Financial Services LLC (“SPFS”) and Dow Jones® is a registered trademark of Dow Jones Trademark Holdings LLC (“Dow Jones”). Neither S&P Dow Jones Indices LLC, SPFS, Dow Jones, their affiliates nor their licensors (“S&P DJI”) make any representation or warranty, express or implied, as to the ability of any index to accurately represent the asset class or market sector that it purports to represent and S&P DJI shall have no liability for any errors, omissions, or interruptions of any index or the data included therein.