Municipal
Perspective published on July 16, 2025
In-State and Out-of-State Municipal Bonds: Key Investment Considerations
Summary
- Municipal bond investors would be remiss to ignore the impact of state and local taxes on an appropriate mix of in- and out-of-state bonds in their portfolios.
- There are considerations and assessments needed when allocating to in- and out-of-state bonds and the inputs can change over time.
- This article takes a closer look at how Breckinridge thinks about the ever-evolving process of building state preference municipal bond portfolios and why one-size-fits-all approaches fall short.
When investors think of the income from municipal bonds, they tend to think of the tax-exempt nature of this income at the federal level. That makes sense given the relatively high level of federal taxes compared to those at the state and local level.
However, municipal bond investors should consider the beneficial impact an appropriate mix of in- and out-of-state bonds can have on in their portfolios.
Several considerations and assessments are required to create an ideal mix of in- and out-of-state bonds and the inputs to that analysis can change over time. Despite the ever-evolving market, Breckinridge follows a disciplined process when building state-preference municipal bond portfolios that include out-of-state bonds.
A look back offers perspective
1912 was a notable year, as the first eastbound U.S. transcontinental flight took place, the opulent Titanic infamously sank, and Fenway Park in Boston opened its gates for the first time. Also in 1912, the Badger State of Wisconsin put into place the first state income tax.
Today, state and local governments tax residents in various ways including taxes on income, purchases, and property. For many states, the revenue derived from taxes on investment income is significant but for others it’s smaller and for a few its nil (See Figure 1).
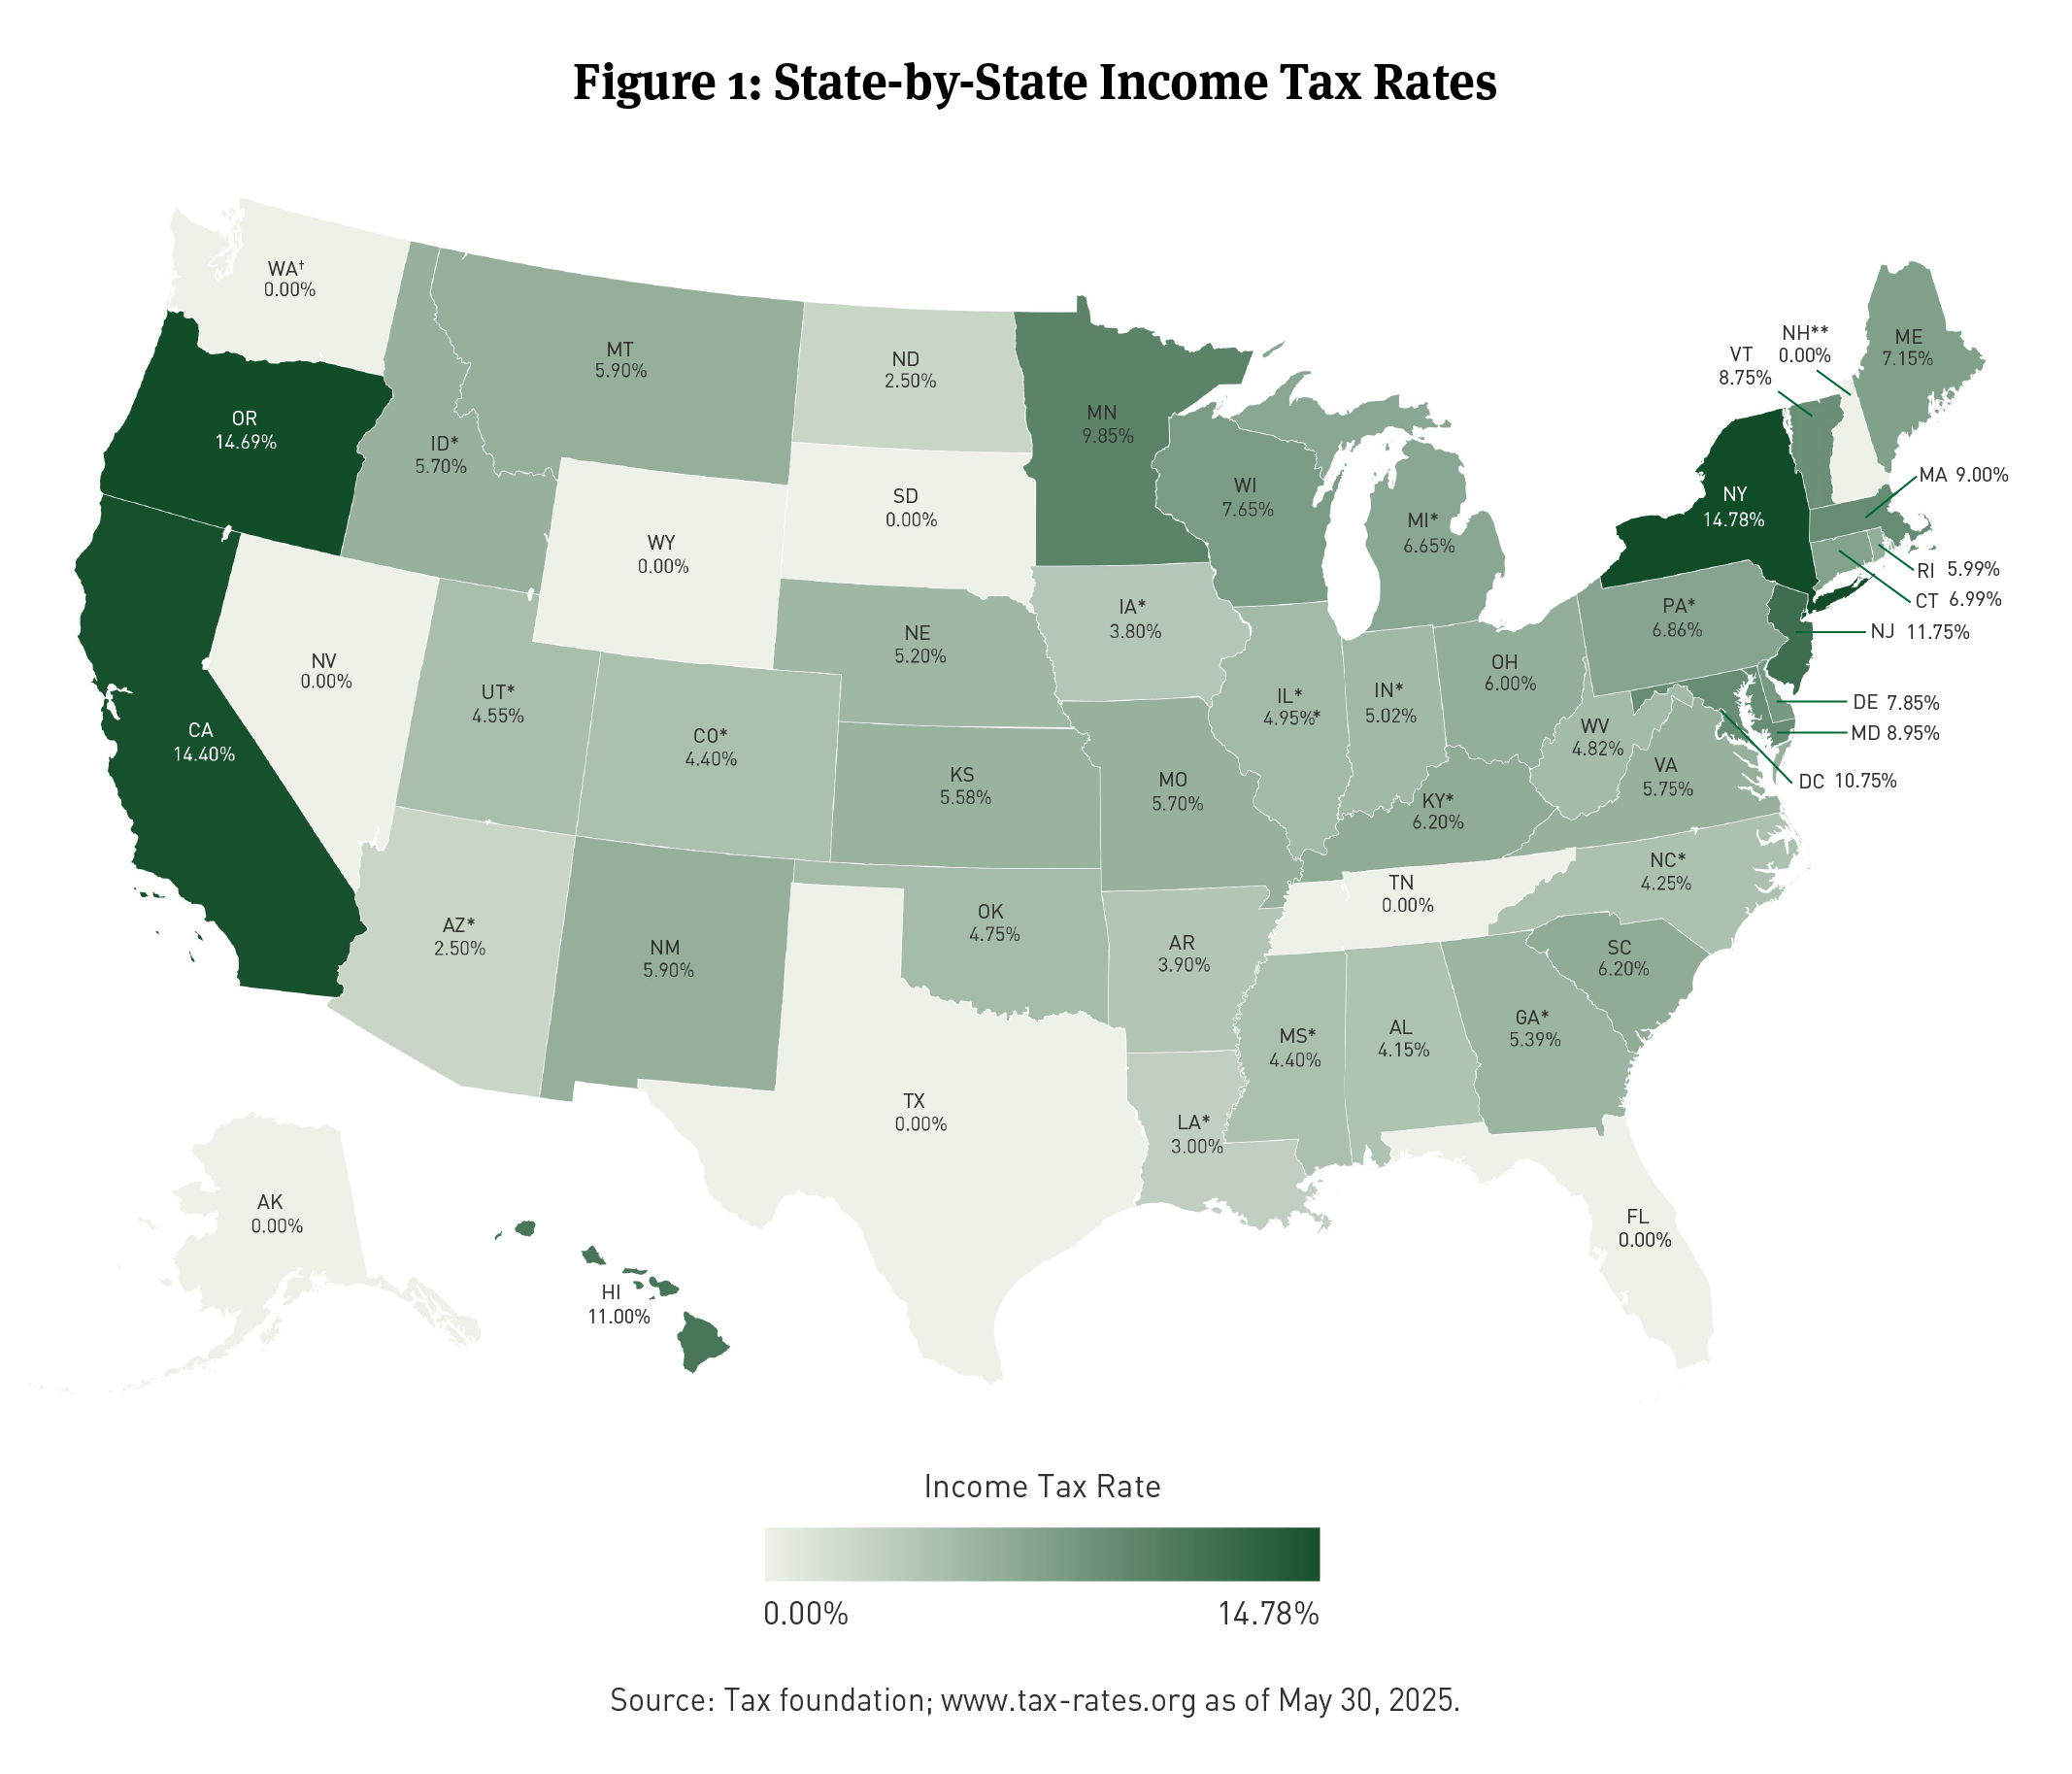
Note: Map shows top marginal rates: the maximum statutory rate in each state, as of May 2025. These rates reflect changes in state tax policies since our last update on this topic, with some states reducing their rates while others have increased them. This map does not show effective marginal tax rates, which would include the effects of phase-outs of various tax preferences. Local income taxes are not included. Missouri’s top marginal rate will be reduced to 5.3 percent if certain revenue triggers are met. (*) State has a flat income tax. (**) State only taxes interest and dividends income. (†) State only taxes capital gains income.
The interest payments from municipal bonds are typically exempt from state income tax if that income is from a bond issued within the state where the investor resides. Interest from bonds outside of the state of residence will usually be subject to the income tax of the state where the resident resides.
It is (mostly) about income: Where you live affects allocations to in-state vs out-of-state mix
California residents, subject to a 13.3 percent state income tax rate, who are considering an out-of-state bond yielding 4 percent, for example, should adjust the after-tax yield down on the out-of-state bond to 3.47 percent (4 percent x (1-0.133)) in order to account for the state income tax they will pay on that bond.
Looking at it another way, and assuming a 4 percent yield on an in-state California bond, the tax-equivalent yield needed for an out-of-state bond would have to be at least 4.61 percent (4 percent/(1-0.133)) in order to yield an equal amount after taxes as the tax-exempt in-state bond.
In other words, and all else equal, the California investor would need to see at least an additional 0.61 percent on an out-of-state bond for it to make sense to forgo buying the in-state bond.
After-tax yield is only one consideration
Assessing the after-tax yield advantage is a key variable to consider when determining an appropriate mix of in-state and out-of-state bonds but it’s not the only one. Considering the supply and demand dynamics within a state is also quite important.
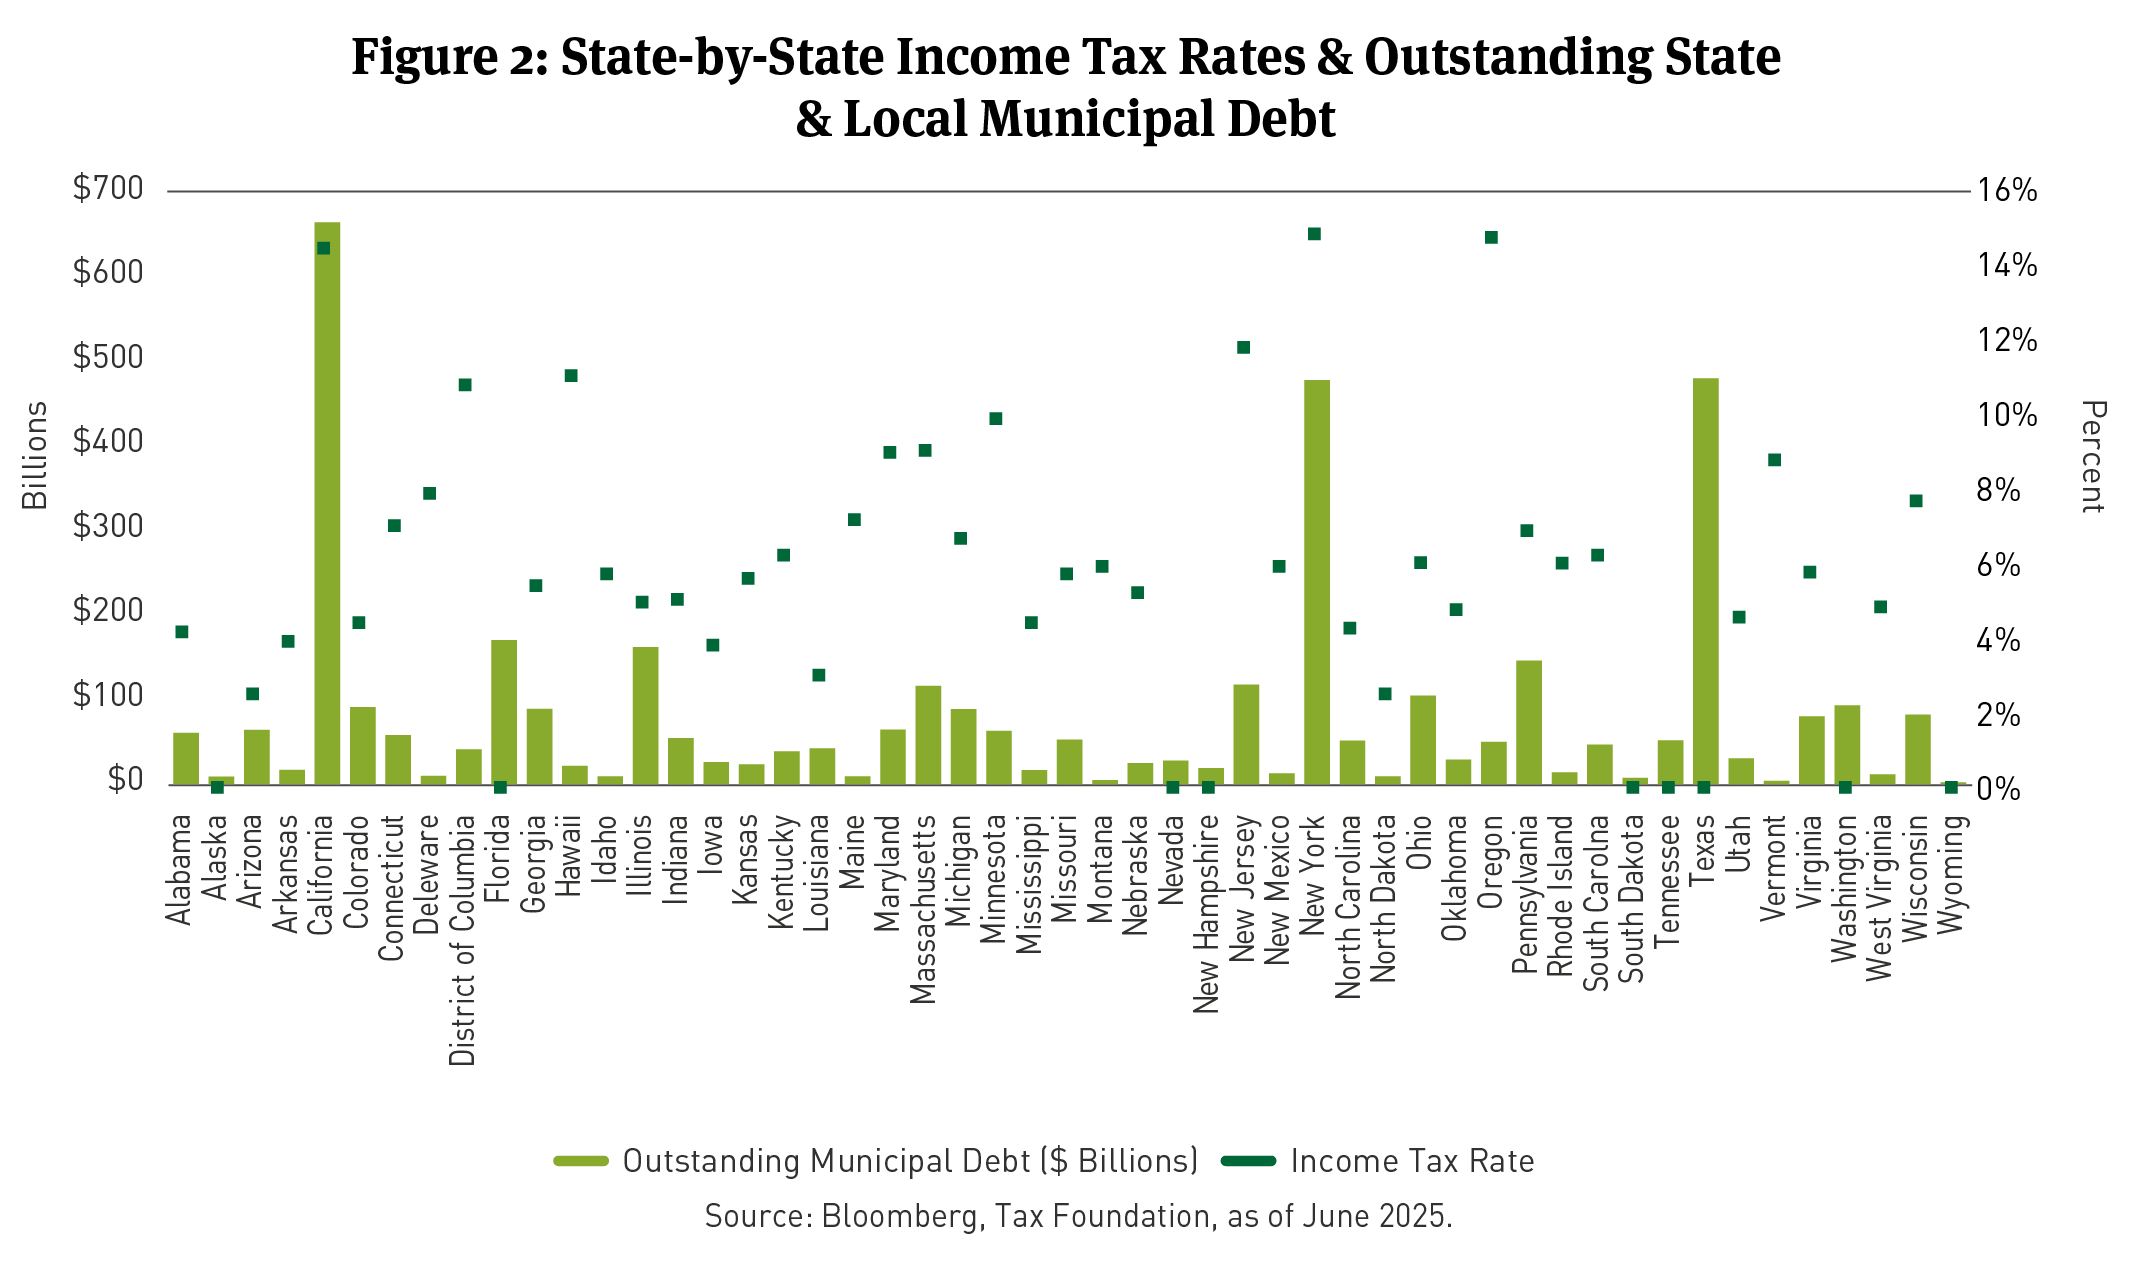
Figure 2 below shows the top state income tax rate along with outstanding debt for each state. A simple rule of thumb to take away from this illustration is that, in most cases, for states where the bar and dot are relatively high, the tax and supply dynamics are such that a meaningful overweight to in-state bonds should be considered.
Conversely, those states with an outstanding debt bar barely off of the x-axis are likely supply constrained. In addition, those with a tax rate dot closest to the X-axis, including on it for 0 percent state income tax, likely provide little after-tax benefit.
Balancing Diversification with In-State Preferences
Striking a balance between 1) building a diversified portfolio with a broad view of the market to find attractive investment opportunities and 2) taking advantage of in-state bonds that usually offer an after-tax advantage at the state and local level, is key to building a balanced state-preference municipal bond portfolio.
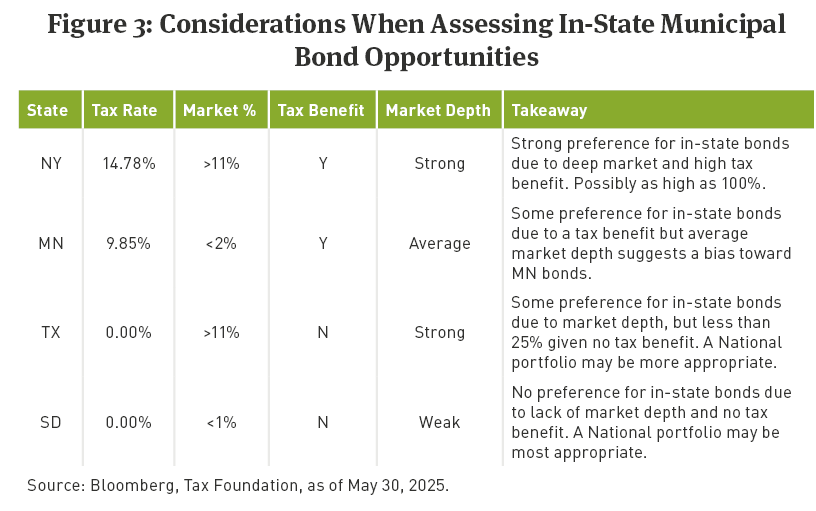
The depth of a state’s bond market will greatly influence the opportunity set in that market—from yield curve positioning to sector and credit exposure to varying call and coupon structures. Figure 3 below provides a quick review of four states that fall into four different general categories.
While the state income tax rate and the availability of a state’s outstanding bonds are primary inputs into an analysis of the mix of in-state and out-of-state bonds, there are plenty of idiosyncrasies across the country to consider.
For instance, although it is customary for states to tax out-of-state bonds only on the income cash flow after accounting for bond price amortization, a couple of notable exceptions are Connecticut and New York, which tax the entirety of the coupon cash flow.
This tax policy bolsters the case for increased in-state allocations as well as attentiveness to coupon structure when buying out-of-state bonds for Connecticut or New York portfolios.
Additionally, for New York City residents who are subject to the city income tax, which can be as high as 3.876 percent, the hurdle for going out-of-state becomes higher.
On the other end of the spectrum is a state like Illinois, which taxes most in-state bonds like out-of-state bonds. Since the 4.95 percent state income tax for Illinois residents applies to the vast majority of both in-state and out-of-state bonds, there is not a compelling case for a meaningful overweight to in-state bonds for Illinois residents. As such, a nationally diversified portfolio, with a preference for zero-tax states such as Texas, Florida, and Washington, may be appropriate.
Bonds issued by zero-tax states are generally preferred in this scenario because, all else equal, the bonds will typically trade a bit cheaper (i.e. higher yields) than bonds of states with higher state income tax rates. Bonds from zero-tax states tend to trade at higher yields than bonds from high-tax states due to the demand, or lack thereof, from in-state residents trying to avoid - state tax liability. State bonds with higher demand tend to have yields pushed lower, but oftentimes not low enough to negate the tax advantage for those residents subject to it.
As mentioned at the beginning of this piece, the inputs for assessing in-state vs out-of-state allocations in a state-preference portfolio often change. In addition to evolving credit fundamentals for any state and its issuers, there are constantly shifting market technicals—supply and demand—that can impact relative value from week-to-week.
An Ever-Evolving Landscape
As a recent example of the impact of market technicals, there is a growing influence of increased buying activity driven by exchange traded funds (ETF) and where that capital is largely deployed. In short, to mimic the broad market, large passive ETFs frequently steer their capital toward the biggest issuers in the market, and many of those are states like California and New York.
A consequence of this demand dynamic is that certain high-tax states have at times become overly expensive, particularly larger issuers within those state markets, making the relative value for out-of-state bonds more attractive at times, despite higher tax hurdles.
Whether at the state or federal level, tax policy is always a key attribute for tax-exempt bond investors to monitor. Recent examples of state level changes include an increase of the top rate from 5 percent to 9 percent in Massachusetts and a reduction in the top rate in Arizona from 8 percent to 4.5 percent. In a vacuum, this would make in-state bonds more attractive for Massachusetts residents and less attractive for Arizona residents.
State and Local Tax (SALT) Deductions
The biggest impact from federal policy in recent years has been the cap on state and local tax (SALT) deductions. Enacted through the passage of the 2017 Tax Cuts and Jobs Act and currently being negotiated in Senate and House tax bill deliberations, individuals that could previously deduct SALT now can only deduct up to a $10,000 cap (current negotiations are whether to raise that cap).
The impact of the SALT limit may most acutely be felt by those residing in higher income tax states who are also in higher tax brackets. This cohort is also generally perceived to be a meaningful buyer of municipal bonds, particularly from their home states. The market impact of the SALT cap has increased demand for in-state bonds among buyers in high income tax states (for example, California, New York, and New Jersey), as residents seek to minimize the impact from higher federal taxes due to the SALT cap. This increased demand has, at times, resulted in more expensive valuations for some bonds issued in high-tax states.
Lastly, the overall level of interest rates always affects the calculus for determining the in-state vs. out-of-state mix of bonds. Simply stated, higher interest rates make tax-exempt yield mathematically more meaningful than lower interest rates. The significant interest rate increases in 2022 certainly were large enough to have an impact in this way.
For example, the Bloomberg Managed Money California Index1 yield-to-worst was 1.12 percent at January 3, 2022, and 3.72 percent on May 30, 2025. Using the tax-equivalent yield calculation from earlier in this piece, the hurdle level (i.e. how much additional yield for an out-of-state bond would be needed to make sense after-tax) at the beginning of 2022 was 1.29 percent (1.12 percent/(1-.133)) and at the end of May 2025 was 4.29 percent (3.72 percent/(1-.133))—a delta of 17 basis points and 57 basis points, respectively. At first glance, that may not seem a huge difference but, if you hold other factors constant such as credit quality, duration, structure, for example, the likelihood of a similar out-of-state bond out-yielding the in-state bond is far less likely at 57bps than at 17bps.
The fundamental point of these anecdotes is to underscore the importance of heightened and ongoing attention to an appropriate mix of in-state and out-of-state municipal bonds in individual portfolios. A cookie cutter approach may be easier to implement when managing a large number of municipal bond accounts but, in our view, that can miss the mark when seeking to optimize after-tax income in a thoughtful way, while maintaining diversification and integrity within portfolio construction.
During 30-plus years of managing municipal bond separate accounts, customization has long been a hallmark at Breckinridge. One of the essential ways we customize a municipal bond portfolio is to align it with a client’s state of residence and invest accordingly.
Over the years, we’ve made significant investments in people, processes, and technology to push forward our capabilities in managing state preference portfolios. We’ve built a deep, experienced credit team with the goal of achieving broad coverage that aids in building diversified in-state preference portfolios. We’ve developed technology and trading systems intended to source bonds efficiently across many different state markets.
A good bond investor is always hesitant to convey too much certitude, but we do feel confident that continued changes to tax policy, supply and demand dynamics, and interest rate movements are certain to keep a thoughtful attention to state preference investing quite important for the foreseeable future.
[1] The Bloomberg Managed Money California Index is a rules-based, market-value weighted index designed to measure the performance of publicly traded tax-exempt municipal bonds issued by the State of California and its municipalities. You cannot invest directly in and index.
BCAI-07082025-4nwzi2zt (7/14/2025)
DISCLAIMERS:
The content is intended for investment professionals and institutional investors.
This material provides general and/or educational information and should not be construed as a solicitation or offer of Breckinridge services or products or as legal, tax or investment advice. The content is current as of the time of writing or as designated within the material. All information, including the opinions and views of Breckinridge, is subject to change without notice.
There is no assurance that any estimate, target, projection or forward-looking statement (collectively, “estimates”) included in this material will be accurate or prove to be profitable; actual results may differ substantially. Breckinridge estimates are based on Breckinridge’s research, analysis and assumptions. Other events that were not considered in formulating such projections could occur and may significantly affect the outcome, returns or performance.
Not all securities or issuers mentioned represent holdings in client portfolios. Some securities have been provided for illustrative purposes only and should not be construed as investment recommendations. Any illustrative engagement or ESG analysis examples are intended to demonstrate Breckinridge’s research and investment process.
Past performance is not a guarantee of future results. Breckinridge makes no assurances, warranties or representations that any strategies described herein will meet their investment objectives or incur any profits. Any index results shown are for illustrative purposes and do not represent the performance of any specific investment. Indices are unmanaged and investors cannot directly invest in them. They do not reflect any management, custody, transaction or other expenses, and generally assume reinvestment of dividends, income and capital gains. Performance of indices may be more or less volatile than any investment strategy.
Performance results for Breckinridge’s investment strategies include the reinvestment of interest and any other earnings, but do not reflect any brokerage or trading costs a client would have paid. Results may not reflect the impact that any material market or economic factors would have had on the accounts during the time period. Due to differences in client restrictions, objectives, cash flows, and other such factors, individual client account performance may differ substantially from the performance presented.
All investments involve risk, including loss of principal. Diversification cannot assure a profit or protect against loss. Fixed income investments have varying degrees of credit risk, interest rate risk, default risk, and prepayment and extension risk. In general, bond prices rise when interest rates fall and vice versa.
This effect is usually more pronounced for longer-term securities. Income from municipal bonds can be declared taxable because of unfavorable changes in tax laws, adverse interpretations by the IRS or state tax authorities, or noncompliant conduct of a bond issuer.
Breckinridge believes that the assessment of ESG risks, including those associated with climate change, can improve overall risk analysis. When integrating ESG analysis with traditional financial analysis, Breckinridge’s investment team will consider ESG factors but may conclude that other attributes outweigh the ESG considerations when making investment decisions.
There is no guarantee that integrating ESG analysis will improve risk-adjusted returns, lower portfolio volatility over any specific time period, or outperform the broader market or other strategies that do not utilize ESG analysis when selecting investments. The consideration of ESG factors may limit investment opportunities available to a portfolio. In addition, ESG data often lacks standardization, consistency and transparency and for certain companies such data may not be available, complete or accurate.
The effectiveness of any tax management strategy is largely dependent on each investor’s entire tax and investment profile, including investments made outside of Breckinridge’s advisory services. As such, there is a risk that the strategy used to reduce the tax liability of the investor is not the most effective for that investor. Breckinridge is not a tax advisor and does not provide personal tax advice. Investors should consult with their tax professionals regarding tax strategies and associated consequences.
Federal and local tax laws can change at any time. These changes can impact tax consequences for investors, who should consult with a tax professional before making any decisions.
Separate accounts may not be suitable for all investors.
The content may contain information taken from unaffiliated third-party sources. Breckinridge believes the data provided by unaffiliated third parties to be reliable but investors should conduct their own independent verification prior to use. Some economic and market conditions contained herein have been obtained from published sources and/or prepared by third parties, and in certain cases have not been updated through the date hereof. All information contained herein is subject to revision. Any third-party websites included in the content has been provided for reference only.
Certain third parties require us to include the following language when using their information:
BLOOMBERG® is a trademark and service mark of Bloomberg Finance L.P. and its affiliates (collectively “Bloomberg”). Bloomberg does not approve or endorse this material or guarantees the accuracy or completeness of any information herein, or makes any warranty, express or implied, as to the results to be obtained therefrom and, to the maximum extent allowed by law, neither shall have any liability or responsibility for injury or damages arising in connection therewith.