Equities
Perspective published on March 12, 2026
High Quality Dividend Equity Strategy Targets Income and Growth Potential with Defensive Characteristic in Changing Markets
Summary
- Evolving secular trends combined with maturing business cycle dynamics and elevated valuation multiples would suggest investors take a more defensive stance in their equity portfolios.
- Not all dividend-focused strategies are created equal, and we believe that overemphasis on dividend yield can lead to underperformance over the long run because elevated payout ratios can prove unsustainable.
- Stocks with strong balance sheets, stable earnings, and higher margins tend to exhibit attributes that investors may find attractive when seeking more resilient equity exposure.
- We believe that balancing measures of operational quality and dividend policy with an assessment of companies’ credit quality offers a more comprehensive approach to identifying dividend payers with financial strength.
- Our fixed income heritage underpins our disciplined approach to building and managing equity portfolios of high quality companies that we believe to be resilient with a goal of generating reliable income streams while preserving the opportunity for long-term capital appreciation.
Changing Landscape in Dividend Equity Investing
The current secular market backdrop is shaped by declining, but still above target inflation with expectations of solid gross domestic product (GDP) growth. The labor market has shown some signs of stabilization, although unemployment remains above pre-COVID-19 levels and the Federal Reserve (Fed) interest-rate policy is leaning slightly dovish. This creates an interesting backdrop that should be supportive of equities over the near-term, however investors should be mindful of stretched equity valuations and market concentration that is at record highs. Diversification into dividend paying equities has the potential to offer strong relative outperformance in periods of market rotation or drawdowns.
Since the 1990s, dividend focused equity strategies have had discernable and prolonged periods of out- and under-performance relative to broad markets, as measured by the S&P 500 Index1 (See Figure 1). Over the last 15 years, large-cap dividend payers have mostly underperformed the broad market, however the majority of that period was characterized by exceptionally easy monetary conditions. Post COVID-19, the Fed began to aggressively tighten monetary policy which, for a short period, resulted in large-cap dividend payer outperformance. More recently, we’ve seen an easing of monetary policy with a backdrop of solid GDP growth, however the extreme market concentration in terms of both companies and around the artificial intelligence investment theme more broadly has started to result in a market rotation. We believe that this backdrop marks an inflection point and should fuel a more favorable environment for dividend-paying equities in 2026 and beyond.
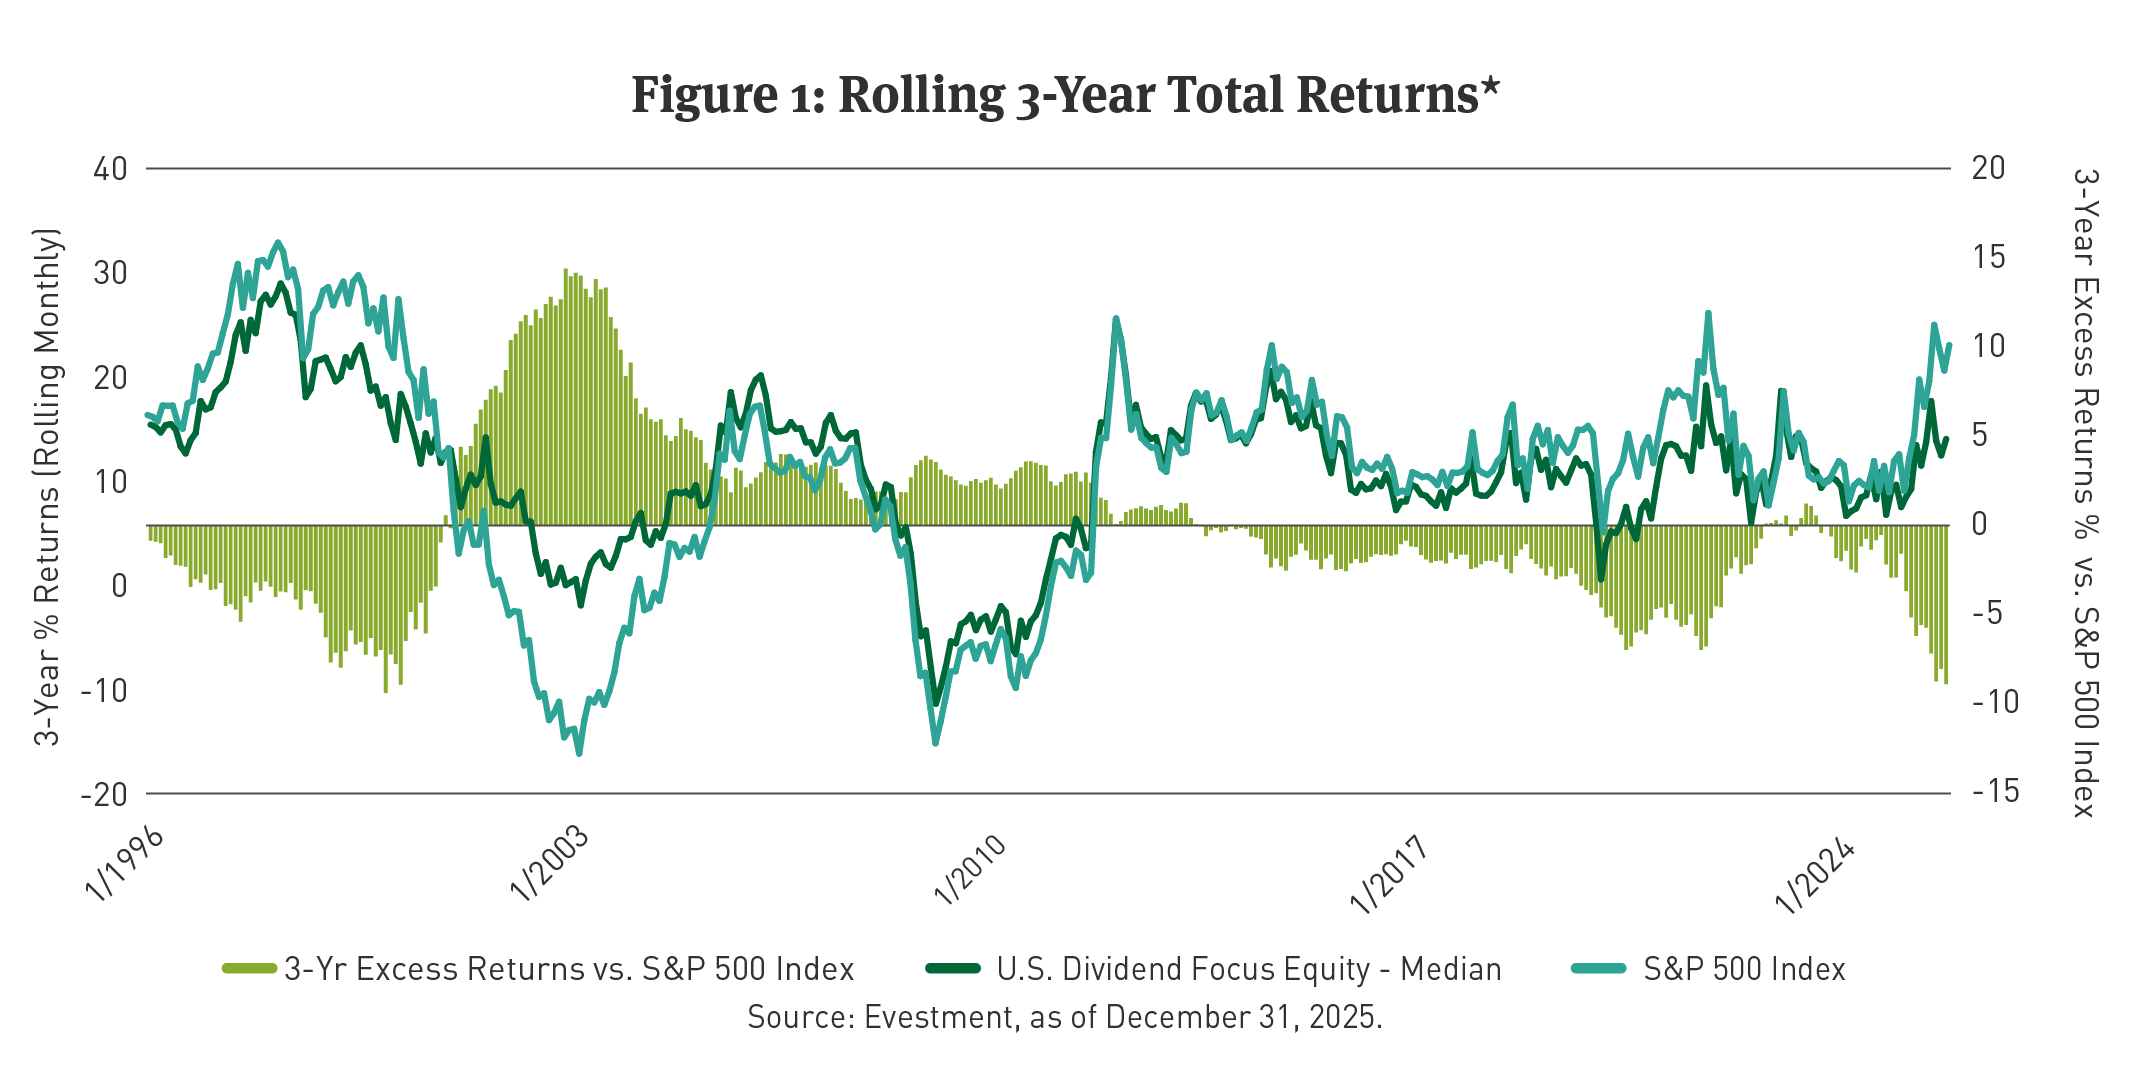
*Past performance is not indicative of future results. For illustrative purposes only. The Evestment U.S. Dividend Focus peer group is defined as “U.S. Equity products that weight their portfolios toward securities with dividend yields at or above the broad market average. REIT and MLP products are excluded from this categorization.” This includes SMAs, mutual funds, co-mingled pools and ETFs. While Breckinridge’s High Quality Dividend strategy is a member of this peer group, the illustration is not intended to represent the performance of any Breckinridge strategy and is presented here to demonstrate the performance of dividend focused equity strategies generally. The blue line represents the median return, gross of fee, for the peer group. The green line represents the median return of the peer group less the index return. The index is unmanaged and investors cannot invest directly in it. Index results do not reflect any fees or expenses and generally assumes reinvestment of dividends, income and gains.
In addition to rewarding investors with attractive risk-adjusted returns, dividend-focused strategies have tended to exhibit positive relative performance in down markets, particularly during more severe economic events and periods of longer drawdowns, outperforming the broader market (See Figure 2).
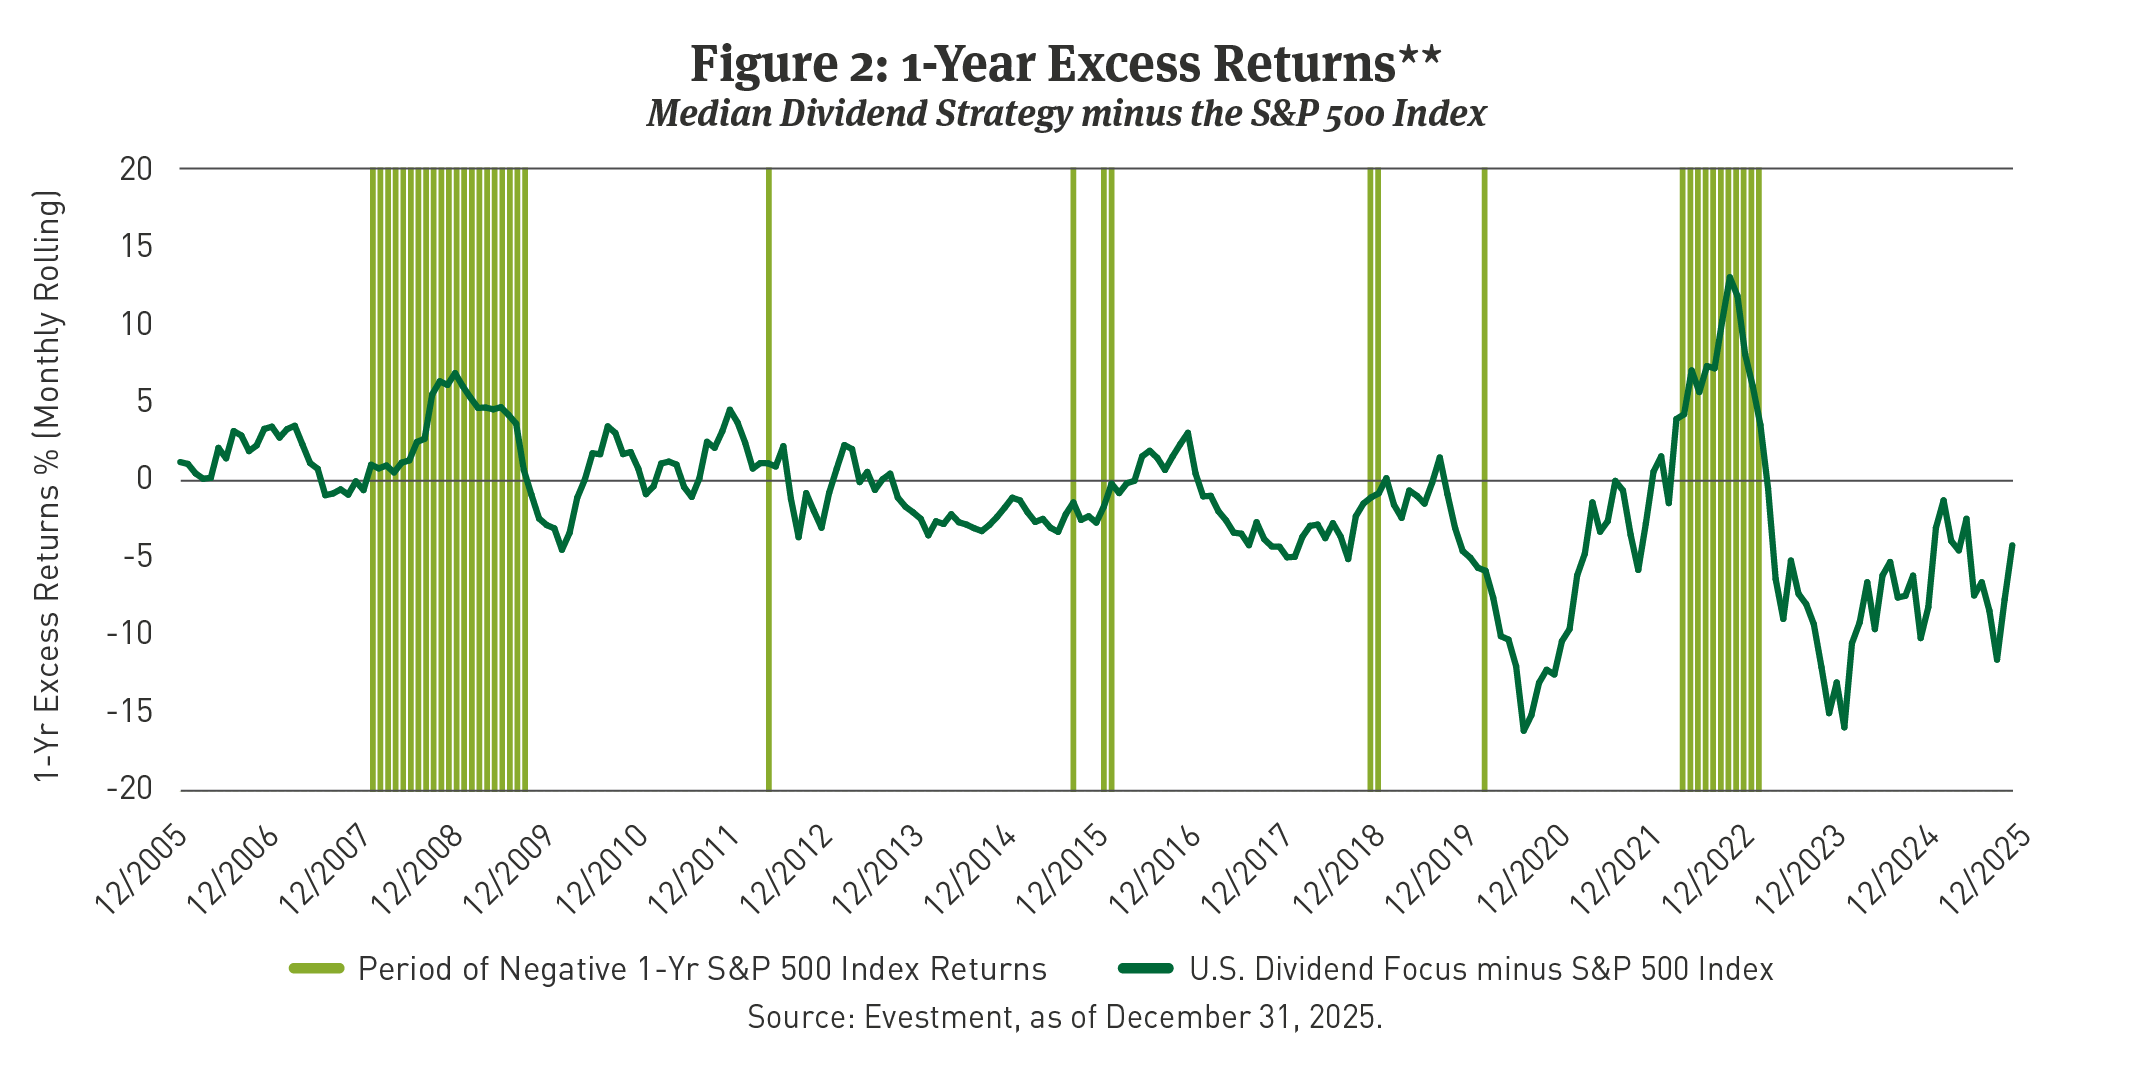
**Past performance is not indicative of future results. For illustrative purposes only. The Evestment U.S. Dividend Focus peer group is defined as “U.S. Equity products that weight their portfolios toward securities with dividend yields at or above the broad market average. REIT and MLP products are excluded from this categorization.” This includes SMAs, mutual funds, co-mingled pools and ETFs. While Breckinridge’s High Quality Dividend strategy is a member of this peer group, the illustration is not intended to represent the performance of any Breckinridge strategy and is presented here to demonstrate the performance of dividend focused equity strategies generally. The blue line represents the median return of the peer group less the index return. The index is unmanaged and investors cannot invest directly in it. Index results do not reflect any fees or expenses and generally assumes reinvestment of dividends, income and gains.
The 2023 Dividend Playbook2 reported, “Dividend-paying stocks outperform non-payers over time based on two empirical analyses. Stocks that initiate dividends tend to outperform peers after three years.” Further, the analysis showed, “These equities show relative resilience through uncertain market environments.” The authors further concluded that dividends have historically made an outsized contribution to total returns over the medium to long-term and are a key consideration for investors looking for stability and/or income within their portfolios. Specifically, the report noted, “While high yielding stocks can look attractive in the short-term, our work suggests that they tend to offer more volatile, mean-reverting return profiles.”
As investors consider their equity allocations, 2026 may be a time to assess both the cyclical as well as the structural benefits of investing in dividend-paying stocks.
Not All Equities Are Created Equal: Emphasis on High Quality
Evolving secular trends combined with maturing business cycle dynamics would suggest that equity investors take a more cautious stance and evaluate the role of high quality equities as a part of the broader asset allocation decision. In the analysis Quality Minus Junk,3 researchers found that, “Quality stocks—those of companies that are profitable, growing and well managed—command higher prices on average than those of unprofitable, stagnant or poorly managed companies” and, further, “have consistently delivered high risk-adjusted returns.” This is evidenced through our own analysis that showed higher Sharpe and Sortino ratios over the last 20 years.
In equity factor investing,4 quality tends to outperform across various phases of the business cycle, as reported in Prime Time for Bonds.5 Earnings stability, balance sheet strength, and higher margins typically define companies that are high quality. Other metrics suggesting high quality are gross profitability, return on invested capital, high dividend growth rates, low volatility, and low fundamental risk.
Though definitions of quality vary, strategies targeting quality factors have historically outperformed the market in part because they exhibited greater resilience in periods of adverse economic conditions. Over long time periods, stratified equity returns of companies considered to be of high quality have tended to outperform companies considered to be of lower quality (See Figure 3 and Figure 4).
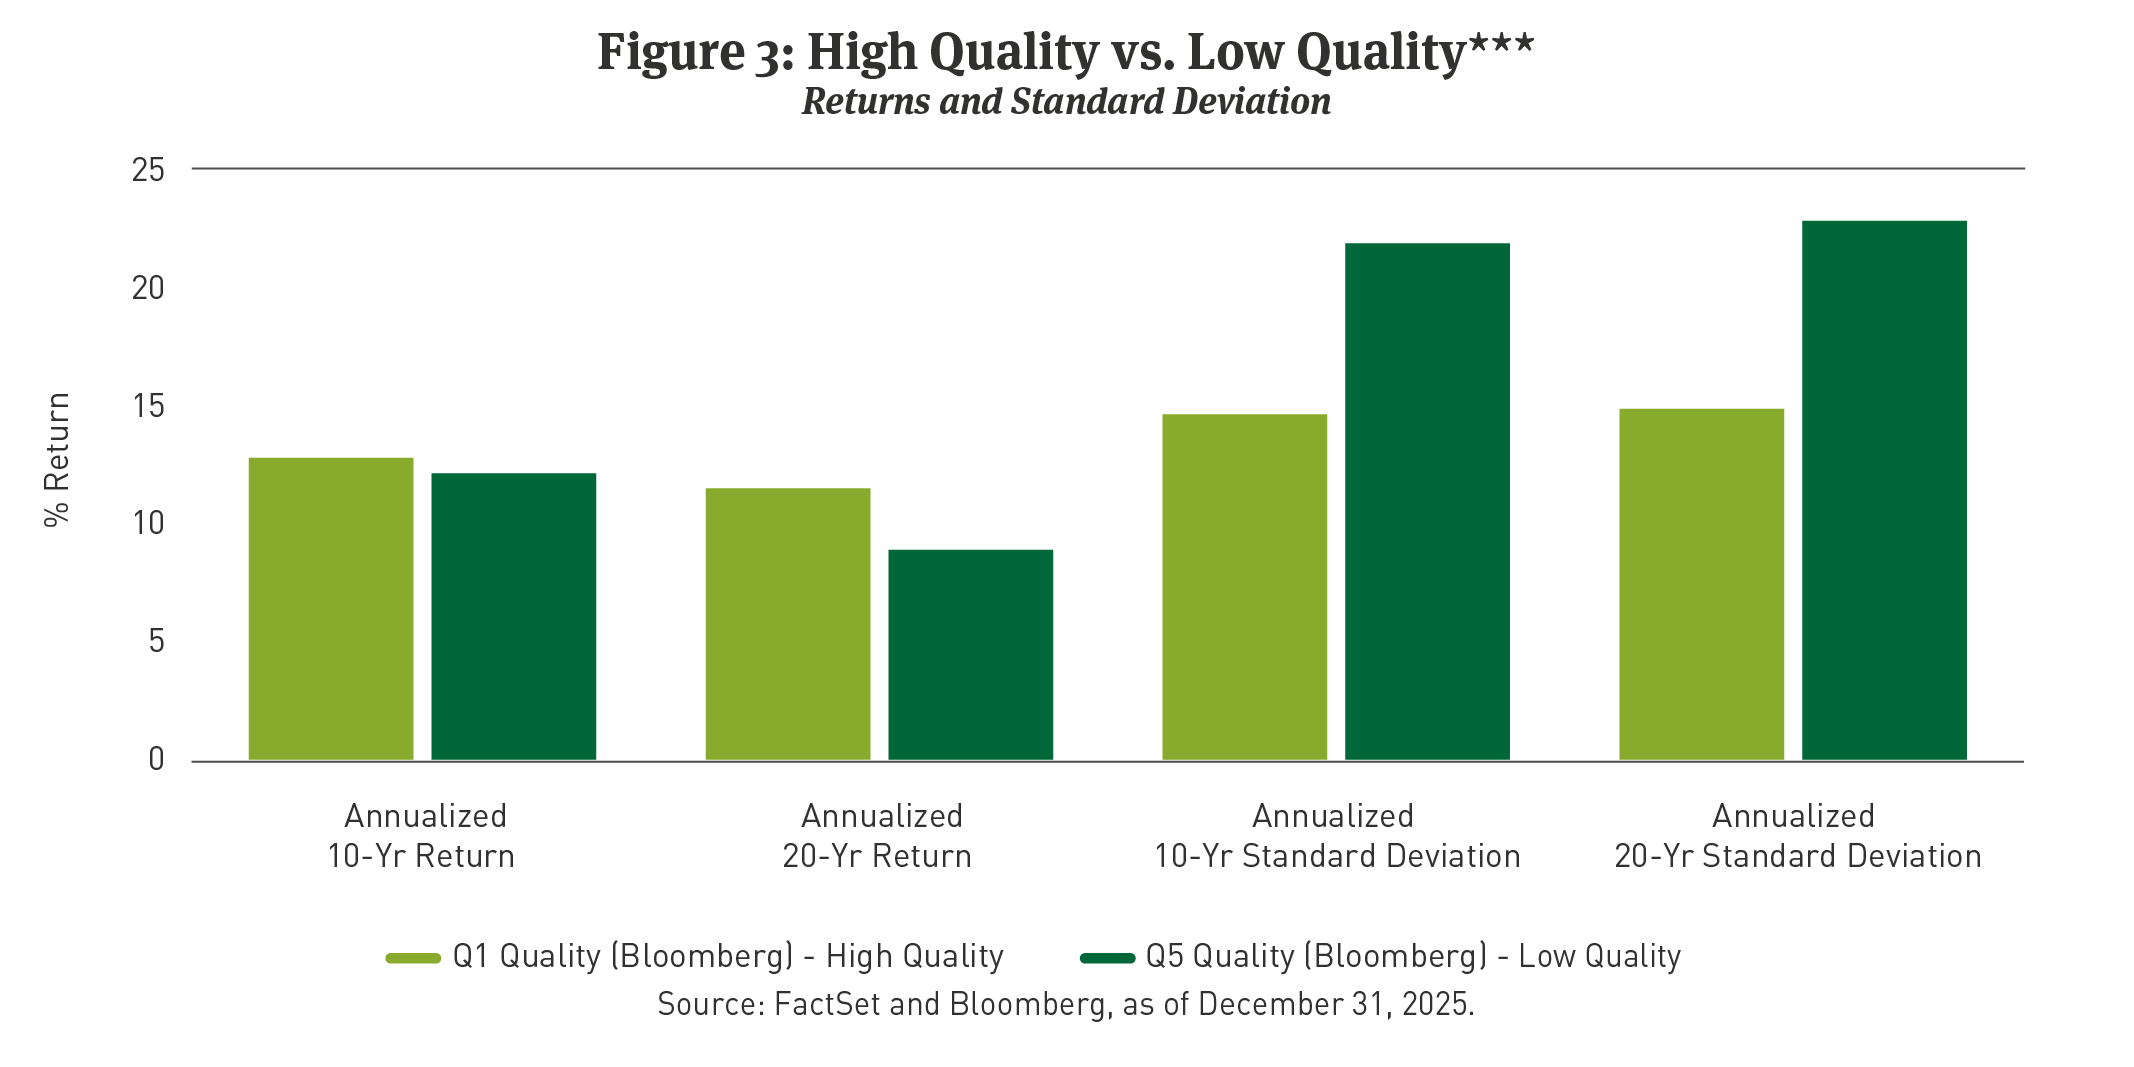
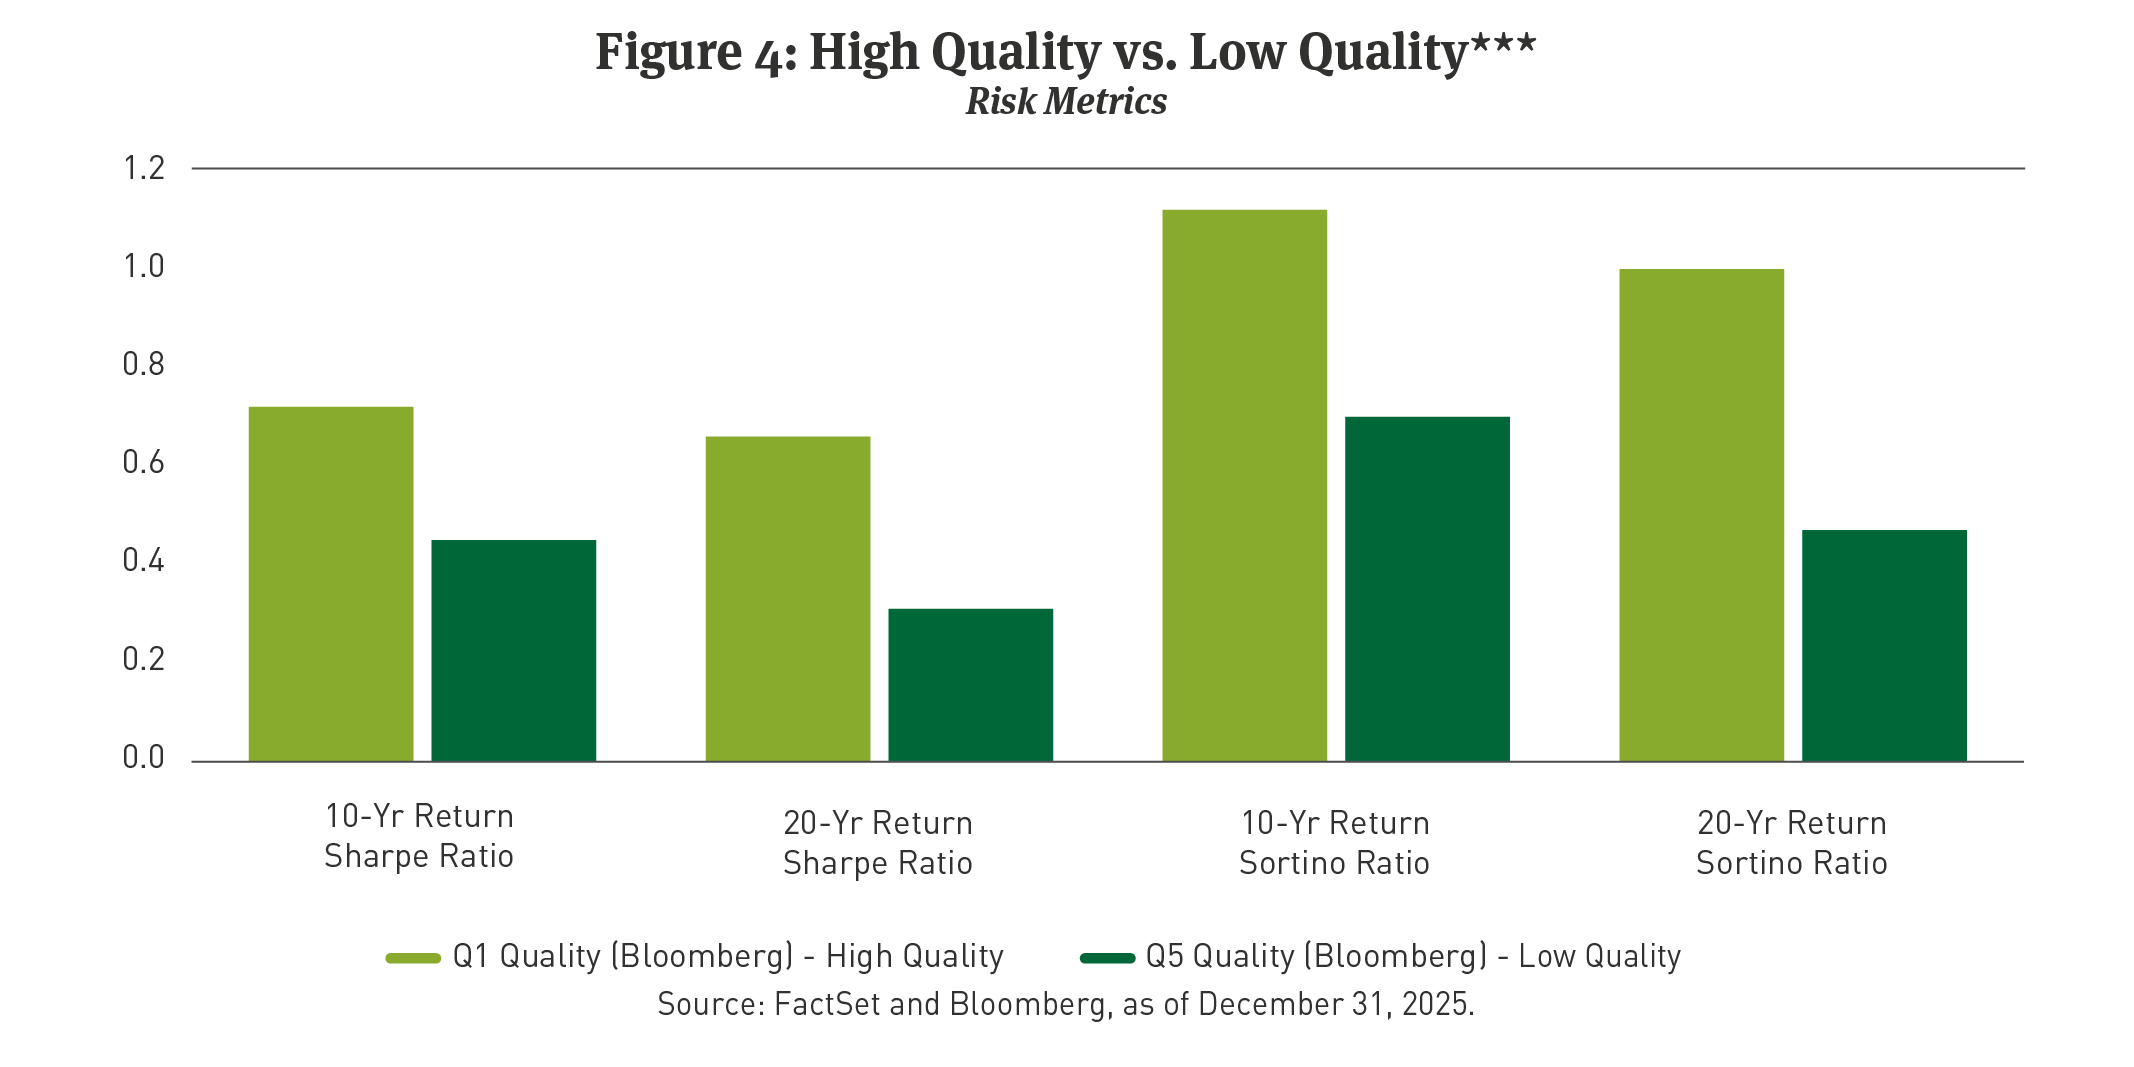
*** Past performance is not indicative of future results. Calculations for Figure 3 and Figure 4 were conducted on Evestment using Bloomberg Monthly Returns data (price return only). High Quality is defined as the top quintile of S&P 500 Index companies that have the following characteristics: strong profitability, low leverage, and low variability in sales/earnings and cash flows. Low quality is defined as companies that are bottom quintile when screened on the same characteristics.
The Sharpe ratio measures risk-adjusted returns to indicate a security’s overall level of volatility.6 A November 2023 Asset Allocation Outlook7 analyzed structural, long-term exposure to improved risk-adjusted returns across various phases of the business cycle. Based on the findings, since 1984, across three phases of economic expansions and three phases of economic contractions, the average Sharpe ratios for the quality factor were higher when compared to Sharpe ratios for value, momentum, size, low volatility, and low beta. Similarly, Sortino ratio8 measures downside-risk-adjusted returns and can been seen as a useful metric when comparing factor performance. It is of note that the outperformance of quality stocks has historically persisted across various phases of the business cycle, particularly during economic contractions.
It Is Good To Be a Dividend Payer, but It Is Great To Be a High Quality Dividend Payer
The contention that some dividend payers are also high quality stocks dates back at least 60 years, when Benjamin Graham and his co-authors wrote, “for the vast majority of common stocks, the dividend record and prospects have always been the most important factor controlling investment quality and value.” In the CFAI article titled Analysis of Dividends and Share Repurchases,9 the authors write, “Some institutional and individual shareholders see regular cash dividend payments as a measure of investment quality.” While the debate continues about the relationship between dividend-paying stocks and investment quality, largely due to varying definitions of quality, we believe that earnings retention and dividend policy are imperative to investor perceptions of stock value.
In fact, more than 40 percent of the cumulative total return of the S&P 500 for the period from 1930 through 2022 stems from the reinvestment of dividends, exhibiting the power of the compounding effect and the benefits of a structural allocation towards dividend paying equities, according to The Power of Dividends, Past, Present and Future.10 In addition, the same report finds that over time, stocks offering the highest level of dividend payouts underperformed those that pay high, but not the very highest, levels of dividends. While the highest dividend payers had higher payout ratios, dividend payments were not sustainable at those levels, and were followed by dividend cuts and negative stock price response in downturns. Our analysis shows that the highest dividend yielding companies have elevated payout ratios and these companies have underperformed companies in the 3rd and 4th highest dividend yield cohorts while also underperforming all other dividend paying cohorts on a risk adjusted basis (Figure 5).11
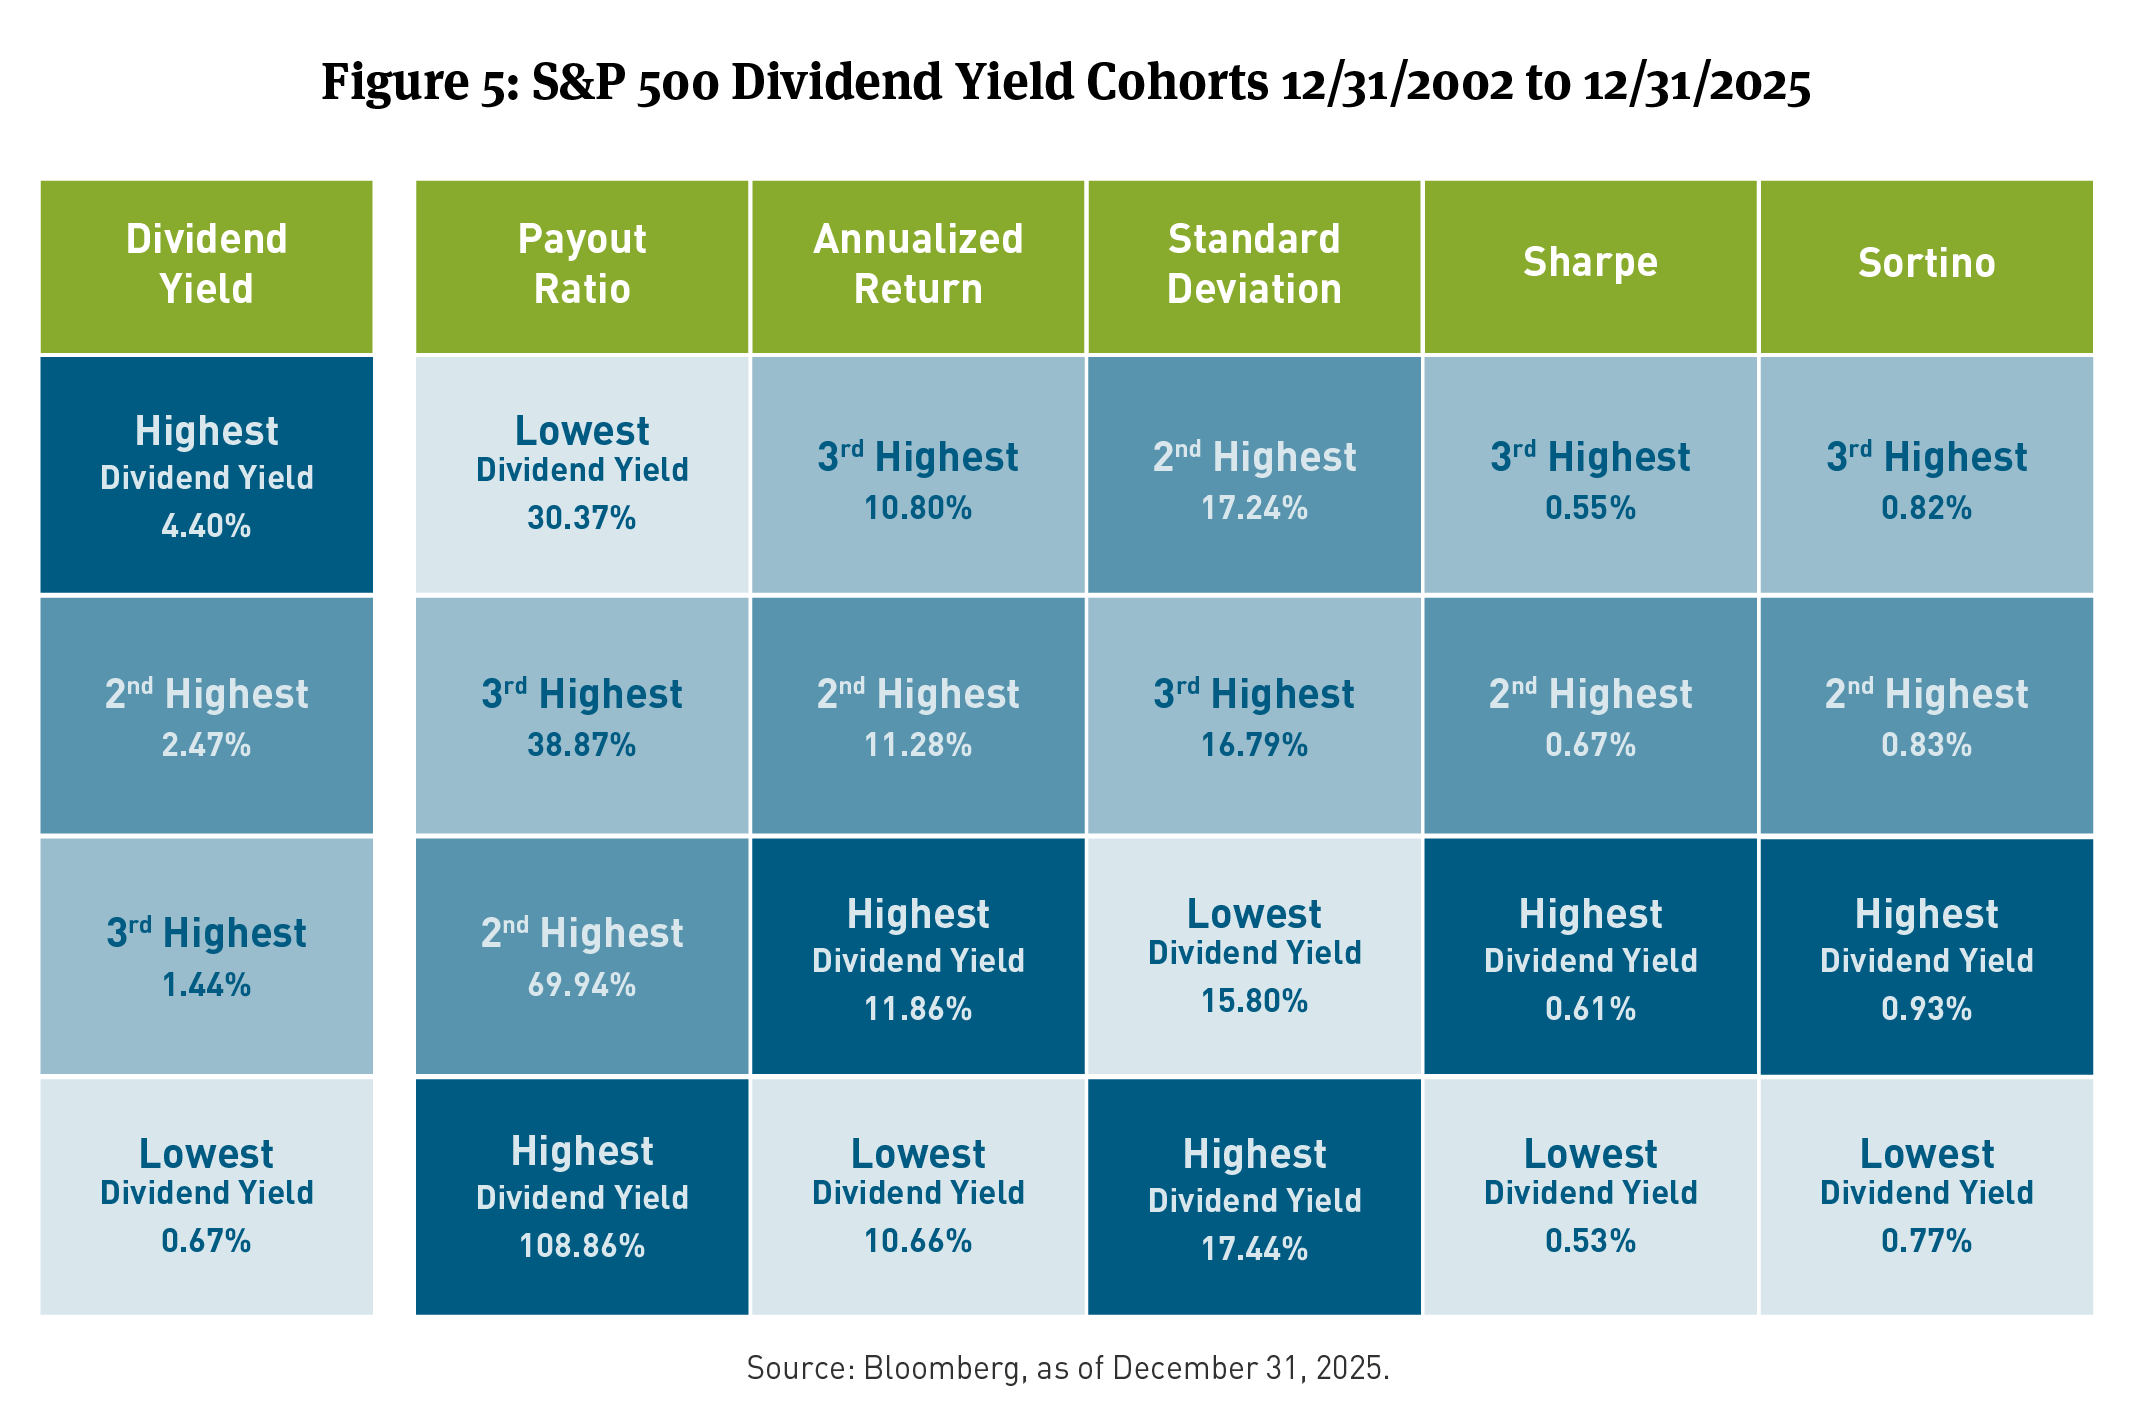
The cohorts were created by grouping the constituents of the S&P 500 into quartiles based on dividend yield (highest to lowest). The yield shown for each cohort is the average of that cohort’s dividend yield. The time series of returns and risk statistics are based on monthly returns.
Dividend stability and/or growth is generally indicative of companies that have increased free cash flow and prudently managed balance sheet strength over time. Companies paying dividends, historically, have exhibited less volatility than their non-paying counterparts.
Leveraging Our Fixed Income Heritage in Building Equity Portfolios
Our strategy focuses on a subset of U.S. large-cap equities with established dividend payment track records, which we believe are high quality companies. Overemphasis on dividend yield can lead to underperformance over the long run because elevated payout ratios can prove unsustainable, thus balancing dividend yield and payout ratios with strong Return on Equity (ROE) and dividend growth histories become important in our security selection process.
Additionally, to deliver exposure to companies that exhibit high dividend quality attributes, it is imperative to integrate a measure of financial robustness. We accomplish that with the addition of our proprietary credit rating, which includes a comprehensive forward-looking assessment of the financial strength and management of companies being considered for inclusion in the strategy (Figure 6).
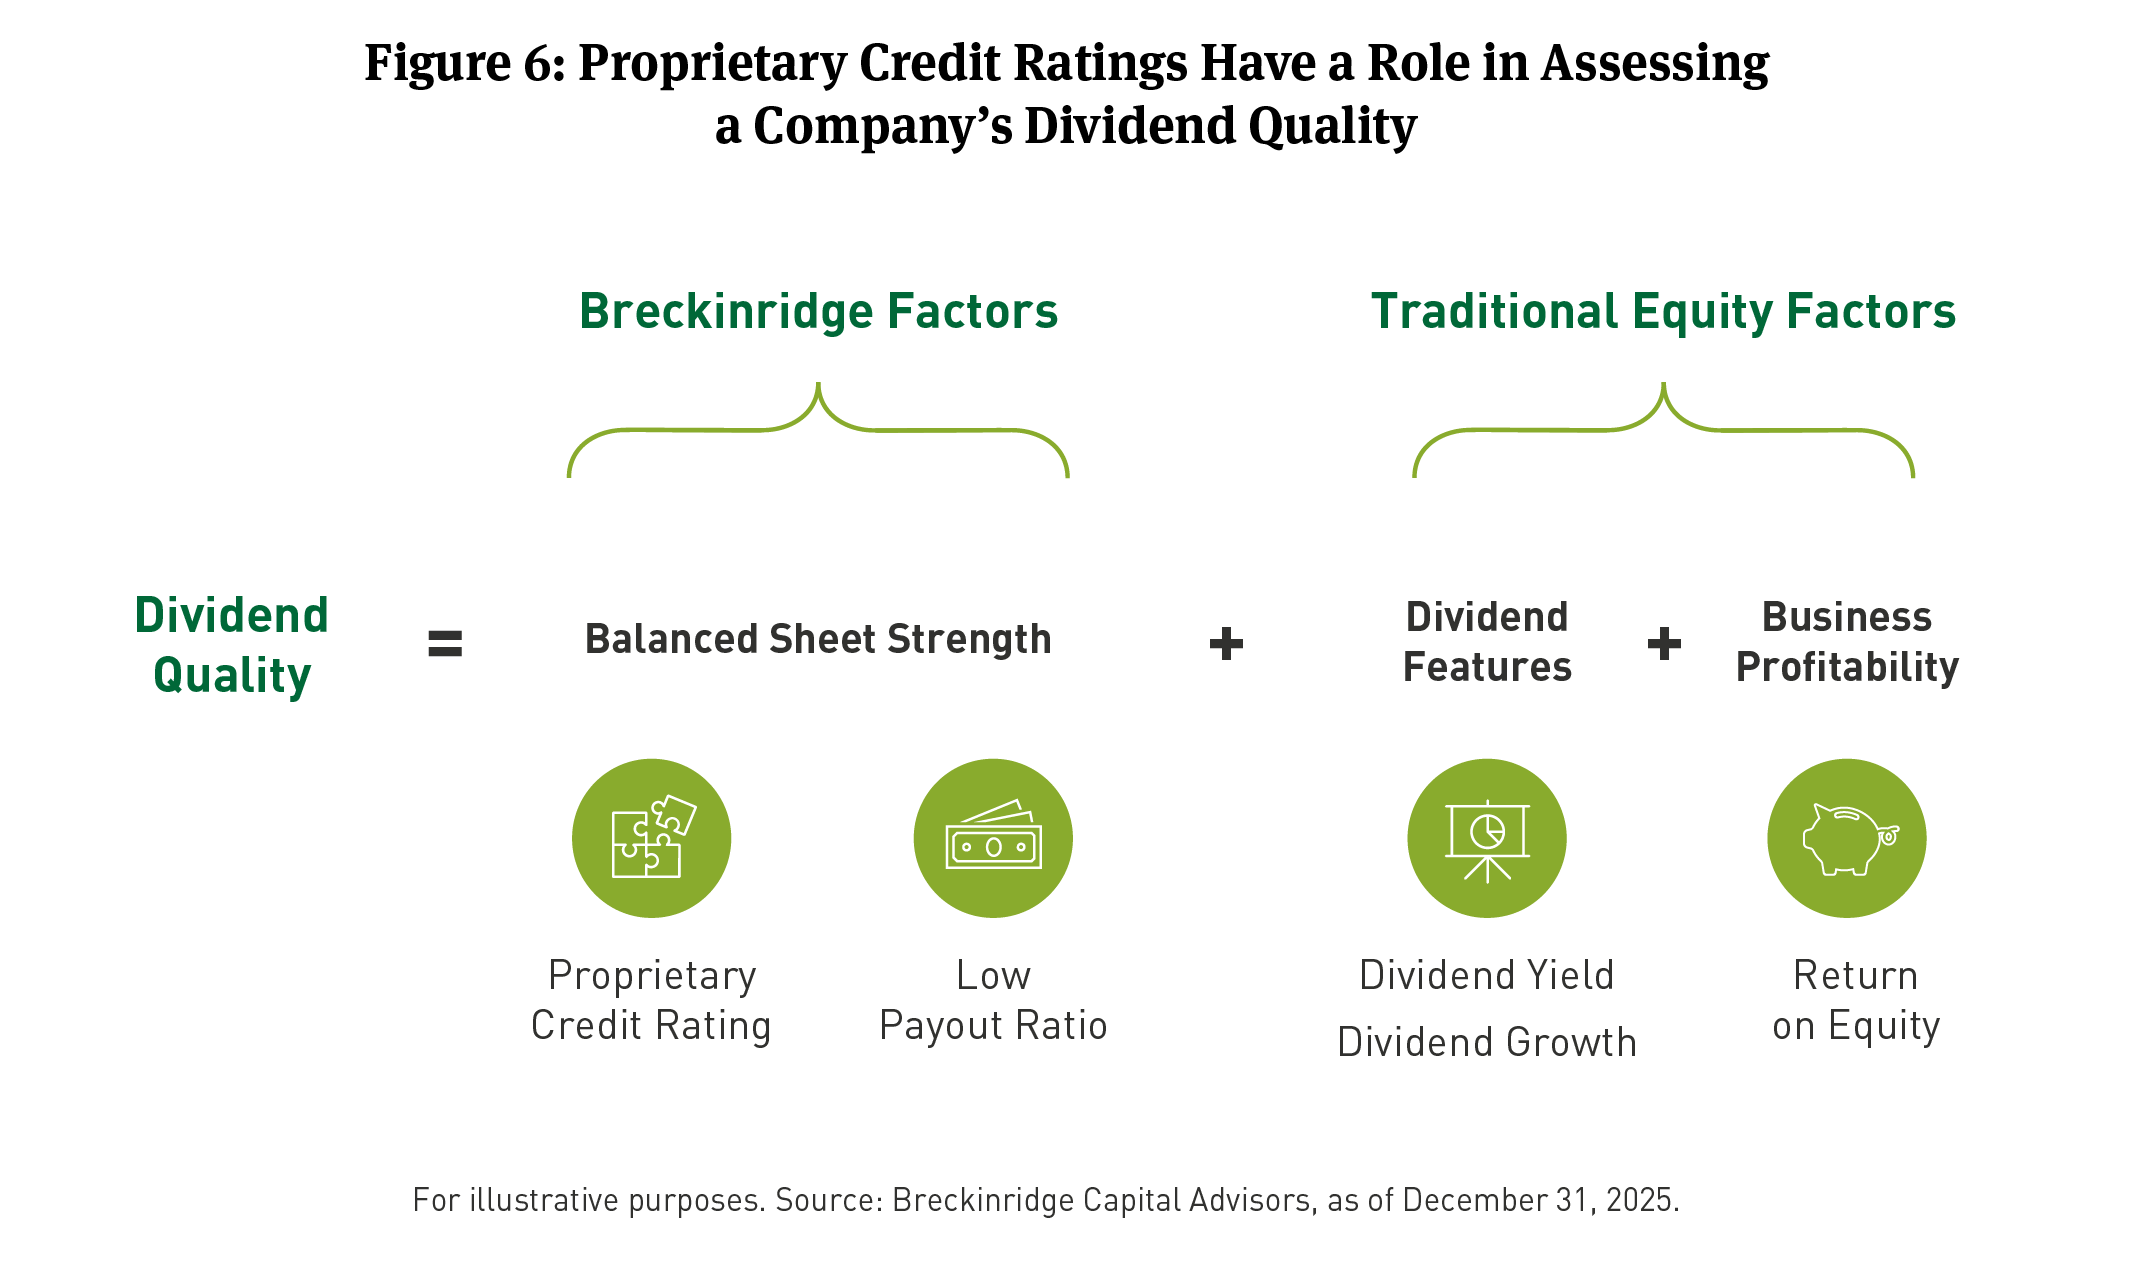
The proprietary credit rating is determined by our internal team of credit analysts who regularly review company filings and other key metrics to assess the financial strength and creditworthiness of corporate issuers relative to sector peers. Credit analysts evaluate the ability of a company to make interest and principal payments on its debt obligations, which we view as indicative of a company’s capacity to sustain its dividend payments.
Breckinridge’s High Quality Dividend strategies are built using a disciplined investment process that seeks to uncover high quality companies with a track record of reliably delivering dividend income. While some dividend equity strategies may factor in a quality component derived from financial ratios, our strategies integrate the views of our credit analyst team based on their qualitative and quantitative credit quality assessments. Balancing their views with key measures of operational quality and dividend policy underpins our ability to build and manage portfolios of high quality dividend paying stocks that we believe are resilient with a goal of generating reliable income streams while preserving the opportunity for long-term capital appreciation.
[1] The S&P 500 Index consists of 500 stocks chosen for market size, liquidity, and industry group representation. Itis a market-value-weighted index with each stock’s weight in the index proportionate to its market value. You cannot invest directly in an index.
[2] 2023 Dividend Playbook, Nicholas Lentini, CFA, et al., Morgan Stanley & Co. LLC, September 27, 2023. The two empirical analyses were based on Compustat data from 1990 through 2022 and Morgan Stanley research. The first showed that stocks that have consecutively grown their dividend for 25 years have consistently outperformed the Standard & Poor’s 500 Index. The second analysis showed that stocks with a high dividend growth factor outperformed stocks with a high dividend yield factor persistently since 2010.
[3] Quality Minus Junk: 10 Quality-Sorted Portfolios, Monthly, AQR Capital Management, January 31, 2024.
[4] Equity factor investing is the strategy of targeting securities with specific characteristics that help explain differences in security returns such as value, quality, momentum, size, and volatility. Approaches to defining factors vary, but are generally supported with evidence of historical outperformance or reduction in risk.
[5] Prime Time for Bonds, Erin Browne, Geraldine Sundstrom, Emmanuel Sharef, PIMCO. November 2023.
[6] The Sharpe ratio uses the following comparison: the return of an investment less the risk-free rate is the numerator. The denominator is the standard deviation of returns.
[7] Asset Allocation Outlook: Prime Time for Bonds, Erin Browne, Geraldine Sundstrom, and Emmanuel Sharef, PIMCO LLC, November 2023.
[8] The Sortino ratio is a variation of the Sharpe ratio that only considers the standard deviation of the downside risk instead of the total standard deviation of portfolio returns.
[9] Analysis of Dividends and Share Repurchases, Gregory Noronha, PhD, CFA, and George H. Troughton, PhD, CFA, 2020.
[10] The Power of Dividends: Past, Present, and Future, Hartford Funds, December 2022. The analysis divided dividend-paying stocks into quintiles based on dividend-payout levels. The first quintile (top 20 percent) consisted of the highest dividend payers, while the fifth quintile (bottom 20 percent) consisted of the lowest dividend payers. The second-quintile stocks outperformed the S&P 500 Index 80 percent of the time during the period from 1930 to 2022, while first- and third-quintile stocks tied for second, beating the S&P 500 Index 67 percent of the time. Fourth- and fifth-quintile stocks lagged significantly, per the study’s results. The analysis assumed the reinvestment of dividends. Not all investors reinvest dividends back into underlying investments and index returns will differ if dividends are retained.
[11] Over shorter periods there may be times when the highest dividend yielding stocks outperform lower dividend yielding stocks. However, over the long-term, our analysis suggests that lower dividend yielding stocks outperform the highest dividend yielding stocks.
BCAI-02112026-lfteyyli (3/11/2026)
DISCLAIMER:
The content is intended for investment professionals and institutional investors.
This material provides general information and should not be construed as a solicitation or offer of Breckinridge services or products or as legal, tax or investment advice. The content is current as of February 10, 2026, or as designated within the material. All information, including the opinions and views of Breckinridge, is subject to change without notice.
The charts contained herein have been provided to illustrate the history of dividend payments and should not be construed as a representation of any client account or Breckinridge strategy. No assurance can be made that any Breckinridge strategy will deliver similar or better results.
This material provides general information and should not be construed as a solicitation or offer of services or products or as legal, tax or investment advice. Nothing contained herein should be considered a guide to security selection, asset allocation or portfolio construction.
All information and opinions are current as of the dates indicated and are subject to change. Breckinridge believes the data provided by unaffiliated third parties to be reliable but investors should conduct their own independent verification prior to use. Some economic and market conditions contained herein have been obtained from published sources and/or prepared by third parties, and in certain cases have not been updated through the date hereof.
There is no assurance that any estimate, target, projection or forward-looking statement (collectively, “estimates”) included in this material will be accurate or prove to be profitable; actual results may differ substantially. Breckinridge estimates are based on Breckinridge’s research, analysis and assumptions. Other events that were not considered in formulating such projections could occur and may significantly affect the outcome, returns or performance.
Not all securities or issuers mentioned represent holdings in client portfolios. Some securities have been provided for illustrative purposes only and should not be construed as investment recommendations. Any illustrative engagement or sustainability analysis examples are intended to demonstrate Breckinridge’s research and investment process.
Yields and other characteristics are metrics that can help investors in valuing a security, portfolio or composite. Yields do not represent performance results but they are one of several components that contribute to the return of a security, portfolio or composite. Yields and other characteristics are presented gross of advisory fees.
All investments involve risk, including loss of principal. No investment or risk management strategy, including diversification, can guarantee positive results or risk elimination in any market. Periods of elevated market volatility can significantly impact the value of securities. Investors should consult with their advisors to understand how these risks may affect their portfolios and to develop a strategy that aligns with their financial goals and risk tolerances.
Past performance is not indicative of future results. Breckinridge makes no assurances, warranties or representations that any strategies described herein will meet their investment objectives or incur any profits. Performance results for Breckinridge’s investment strategies include the reinvestment of interest and any other earnings, but do not reflect any brokerage or trading costs a client would have paid. Results may not reflect the impact that any material market or economic factors would have had on the accounts during the time period. Due to differences in client restrictions, objectives, cash flows, and other such factors, individual client account performance may differ substantially from the performance presented.
Actual client advisory fees may differ from the advisory fee used to calculate net performance results. Client returns will be reduced by the advisory fees and any other expenses incurred in the management of their accounts. For example, an advisory fee of 1 percent compounded over a 10-year period would reduce a 10 percent return to a 9 percent annual return. Additional information on fees can be found in Breckinridge’s Form ADV Part 2A.
Index results are shown for illustrative purposes and do not represent the performance of any specific investment. Indices are unmanaged and investors cannot directly invest in them. They do not reflect any management, custody, transaction or other expenses, and generally assume reinvestment of dividends, income and capital gains. Performance of indices may be more or less volatile than any investment strategy.
There is no guarantee that the strategies or approaches discussed will achieve their objectives, lower volatility or be profitable. All investments involve risk, including loss of principal. Diversification cannot assure a profit or protect against loss. No investment or risk management strategy can guarantee positive results or risk elimination in any market.
Fixed income investments have varying degrees of credit risk, interest rate risk, default risk, and prepayment and extension risk. In general, bond prices rise when interest rates fall and vice versa.
Equity investments are volatile and can decline significantly in response to investor reception of the issuer, market, economic, industry, political, regulatory or other conditions.
When integrating sustainability analysis with traditional financial analysis, Breckinridge’s investment team will consider material sustainability factors but may conclude that other attributes outweigh the sustainability considerations when making investment decisions.
There is no guarantee that integrating sustainability analyses will improve risk-adjusted returns, lower portfolio volatility over any specific time period, or outperform the broader market or other strategies that do not utilize these analyses when selecting investments. The consideration of sustainability factors may limit investment opportunities available to a portfolio. In addition, data for sustainable factors often lacks standardization, consistency and transparency and for certain companies such data may not be available, complete or accurate.
Breckinridge’s sustainability analysis is based on third party data and Breckinridge analysts’ internal analysis. Analysts will review a variety of sources such as corporate sustainability reports, data subscriptions, and research reports to obtain available metrics for internally developed frameworks. A high sustainability rating does not mean it will be included in a portfolio, nor does it mean that a bond will provide profits or avoid losses.
Investments in thematic customizations will subject the portfolio to proportionately higher risk exposure of any sectors or regions in which the investments target. In addition, the investments held in thematic customizations may not meet the desired positive impact or become subject to negative publicity; these types of events may cause the customizations to have poor performance due to the concentration of assets. There is no assurance that the customizations or the strategies will meet their objectives.
BLOOMBERG® is a trademark and service mark of Bloomberg Finance L.P. and its affiliates (collectively “Bloomberg”). Bloomberg does not approve or endorse this material or guarantees the accuracy or completeness of any information herein, or makes any warranty, express or implied, as to the results to be obtained therefrom and, to the maximum extent allowed by law, neither shall have any liability or responsibility for injury or damages arising in connection therewith.
Solactive AG ("Solactive") is the licensor of Breckinridge Sustainable Dividend Income Index and Breckinridge Dividend Income Index (the "Indices"). The financial instruments that are based on the Indices are not sponsored, endorsed, promoted or sold by Solactive in any way and Solactive makes no express or implied representation, guarantee or assurance with regard to: (a) the advisability in investing in the financial instruments; (b) the quality, accuracy and/or completeness of the Indices; and/or (c) the results obtained or to be obtained by any person or entity from the use of the Indices. Solactive reserves the right to change the methods of calculation or publication with respect to the Indices. Solactive shall not be liable for any damages suffered or incurred as a result of the use (or inability to use) of the Indices.
The S&P500 Index (“Index”) and associated data is a product of S&P Dow Jones Indices LLC, its affiliates and/or their licensors and has been licensed for use by Breckinridge. © 2024 S&P Dow Jones Indices LLC, its affiliates and/or their licensors. All rights reserved. Redistribution or reproduction in whole or in part are prohibited without written permission of S&P Dow Jones Indices LLC. For more information on any of S&P Dow Jones Indices LLC’s indices please visit www.spdji.com. S&P® is a registered trademark of Standard & Poor’s Financial Services LLC (“SPFS”) and Dow Jones® is a registered trademark of Dow Jones Trademark Holdings LLC (“Dow Jones”). Neither S&P Dow Jones Indices LLC, SPFS, Dow Jones, their affiliates nor their licensors (“S&P DJI”) make any representation or warranty, express or implied, as to the ability of any index to accurately represent the asset class or market sector that it purports to represent and S&P DJI shall have no liability for any errors, omissions, or interruptions of any index or the data included therein.