Investing
Commentary published on March 11, 2026
February 2026 Market Commentary
Summary
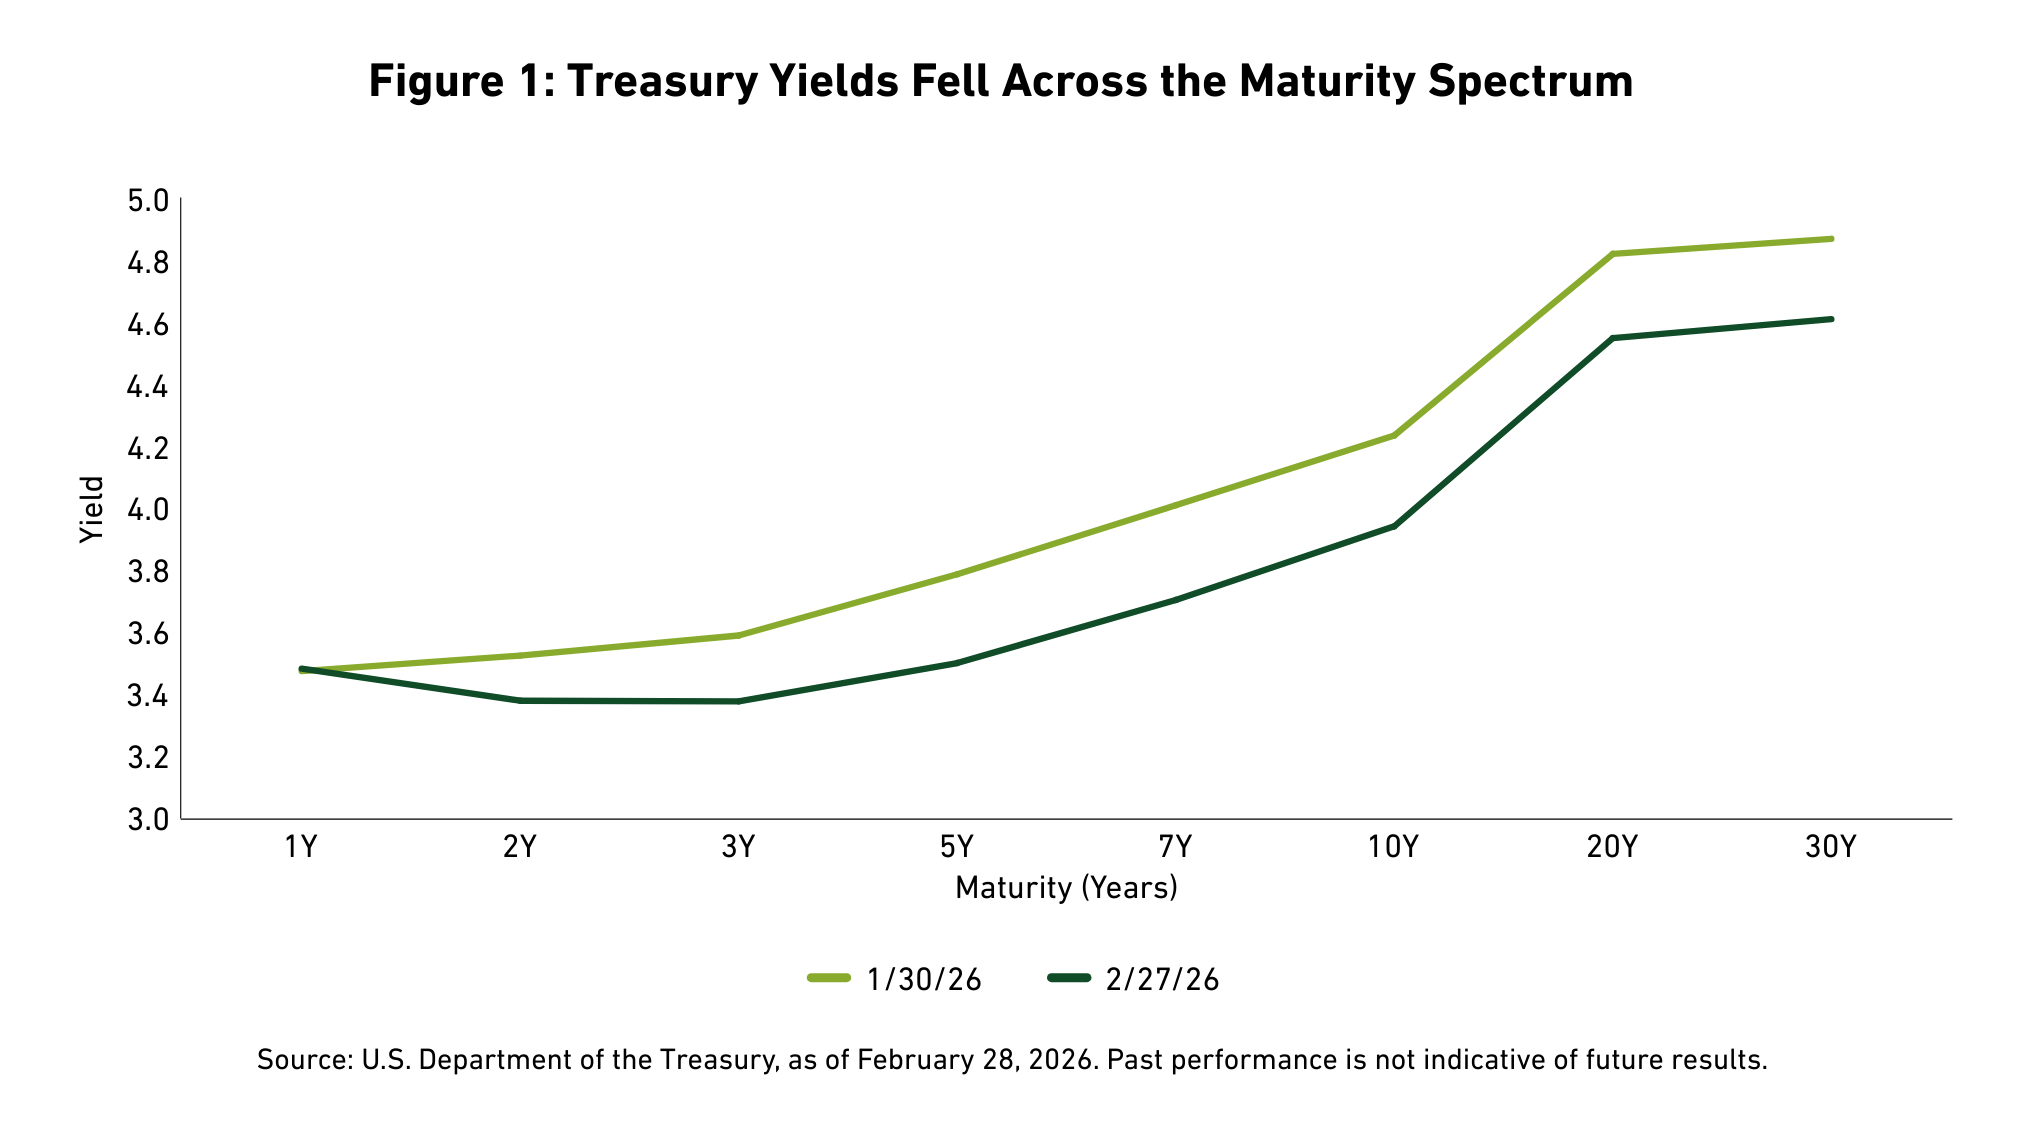
- U.S. Treasury Curve: Treasury yields fell across the curve, and the 10-year yield declined 30 basis points (bps), as buyers turned to Treasuries amidst potential signs of the disinflationary power of AI, rising geopolitical tensions and worries about private credit.
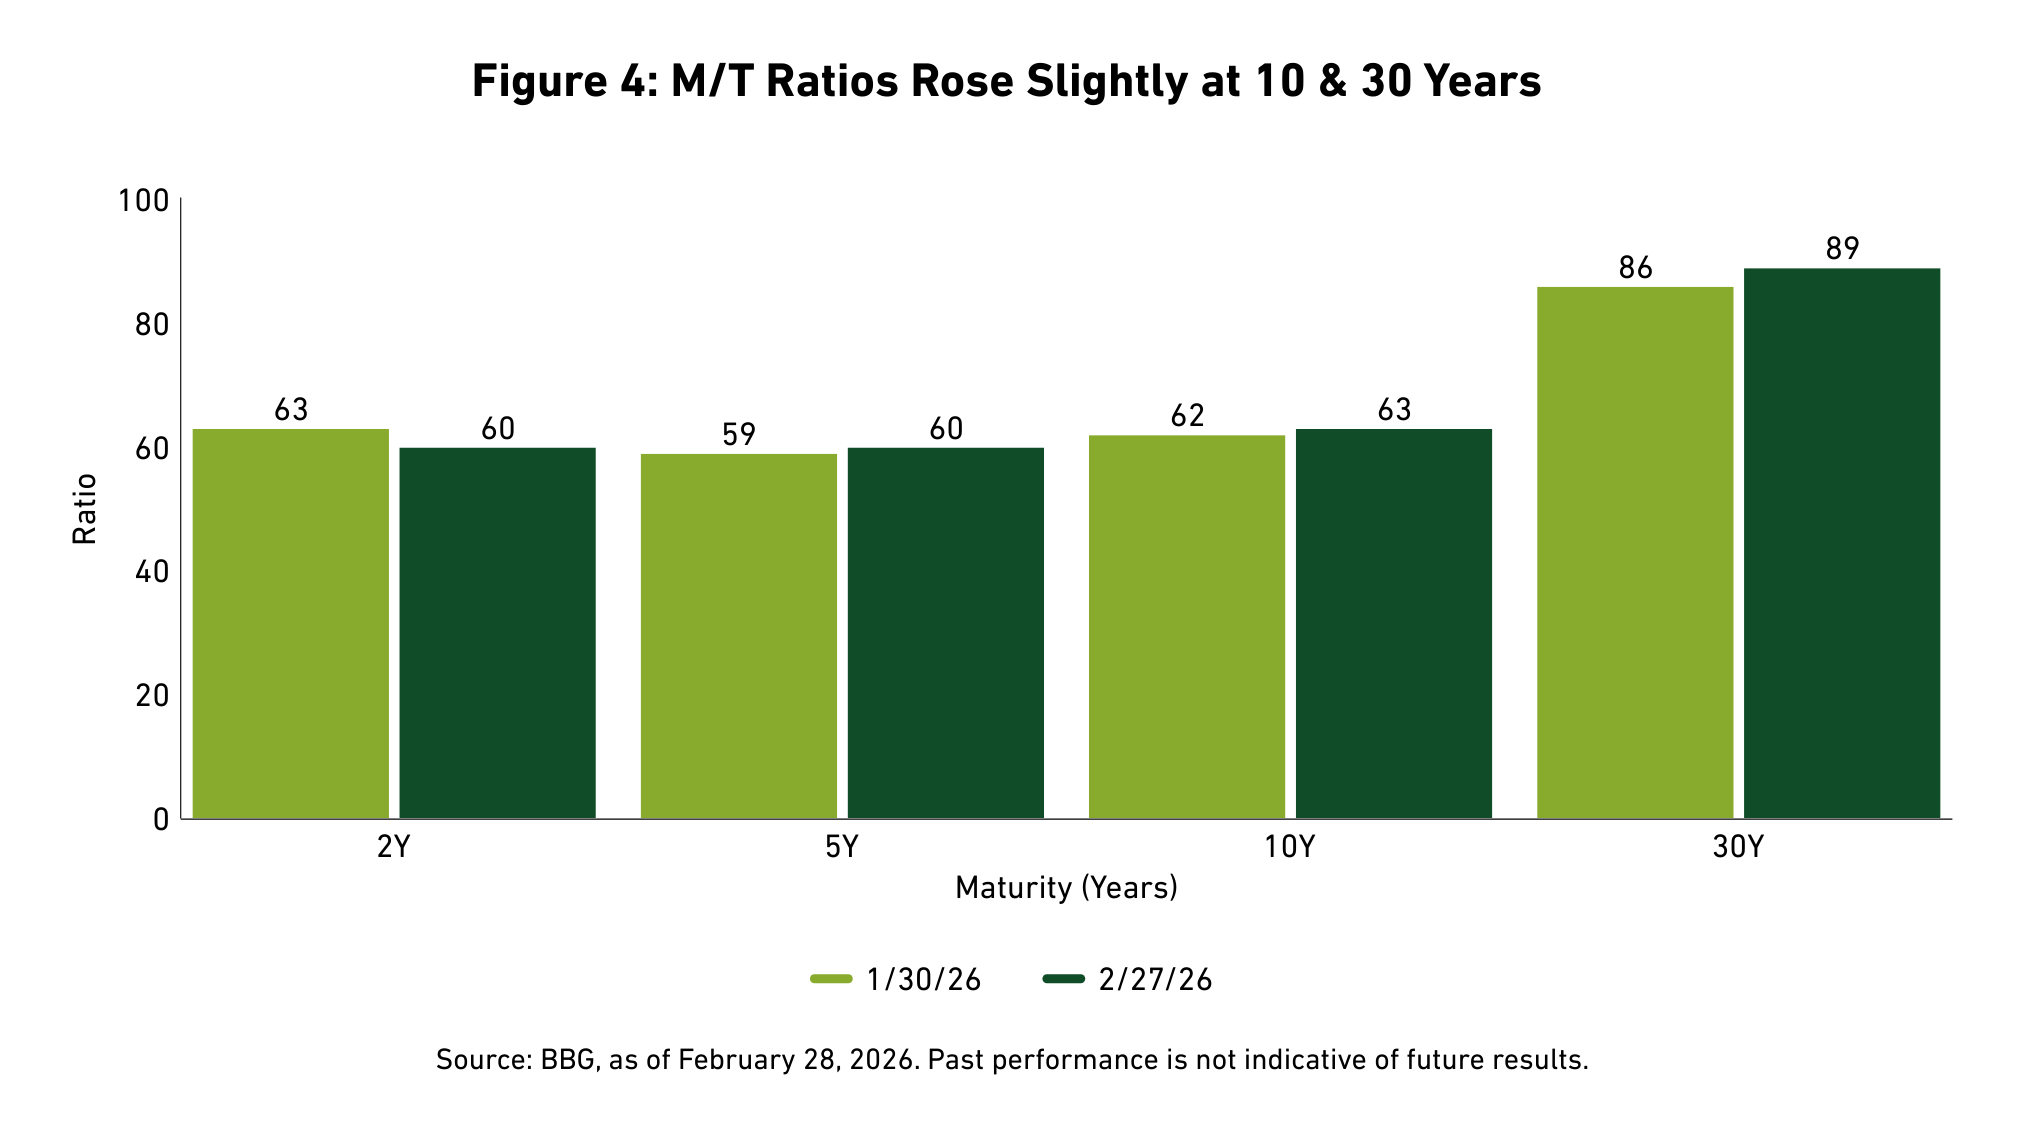
- Municipal Markets: Amid robust demand and nearly $44 billion in issuance, munis remained the top-performing fixed income asset class year-to-date through February, while Municipal/Treasury [1] (M/T) ratios remained compressed.
- Corporate Markets: The Bloomberg (BBG) Corporate Investment Grade Index [2] (the Corporate Bond Index) option-adjusted spread (OAS) widened by 11bps, as the market absorbed $197.9 billion in new supply.
- Securitized Markets: Mortgage-Backed (MBS) and Asset-Backed Securities (ABS) remained resilient, posting positive total returns of 1.67 percent and 0.87 percent, respectively.
- Equity Markets: The S&P 500 Index [3] declined 0.76 percent, driven by a rotation away from mega-cap growth and from AI-related disruption in software and services companies.
The following commentary is a summary of discussions among members of the Breckinridge Capital Advisors Investment Committee as they reviewed monthly activity in the markets and investment returns. The members of the Investment Committee, under the leadership of Co-Chief Investment Officers Matthew Buscone and Jeffrey Glenn, CFA, are Co-Heads of Research, Nicholas Elfner and Adam Stern, J.D., M.P.A.; and Portfolio Manager and Director, Corporate Research, Josh Perez, CFA.
Market Review
Market sentiment turned cautious in February, as the enthusiasm for artificial Intelligence (AI)-linked growth was tempered by concerns over high capital expenditures and potential business-model disruptions. Increasing wariness coincided with data showing a significant deceleration in economic activity; real gross domestic product (GDP) growth slowed to 1.4 percent in the fourth quarter of 2025, a sharp drop from the 4.4 percent recorded in the third quarter. Although private payrolls remained resilient, core personal consumption expenditures (PCE) inflation stayed sticky at 3.0 percent. This combination of slowing growth and above-target inflation suggests that the Federal Reserve (Fed) may delay anticipated rate cuts to ensure price stability.
The Fed’s policy path remains highly sensitive to incoming data, particularly after January Producer Price Index (PPI) increases exceeded market expectations. Geopolitical tensions further dampened risk appetite following a combined U.S. and Israeli attack on Iran in late February. Given continued headwinds, we believe the Fed will likely limit itself to a single rate cut during the first half of 2026.
U.S. Treasury yields declined across the maturity spectrum (See Figure 1). The 10-year Treasury yield fell below the 4.0 percent threshold late in the month, ending with a 30bps decline. Shorter-dated 2-year and 5-year yields fell by 15 and 29bps, respectively, while the 30-year yield dropped 26bps. These movements resulted in a total return of 1.82 percent for the U.S. Treasury Index during the period, according to BBG.
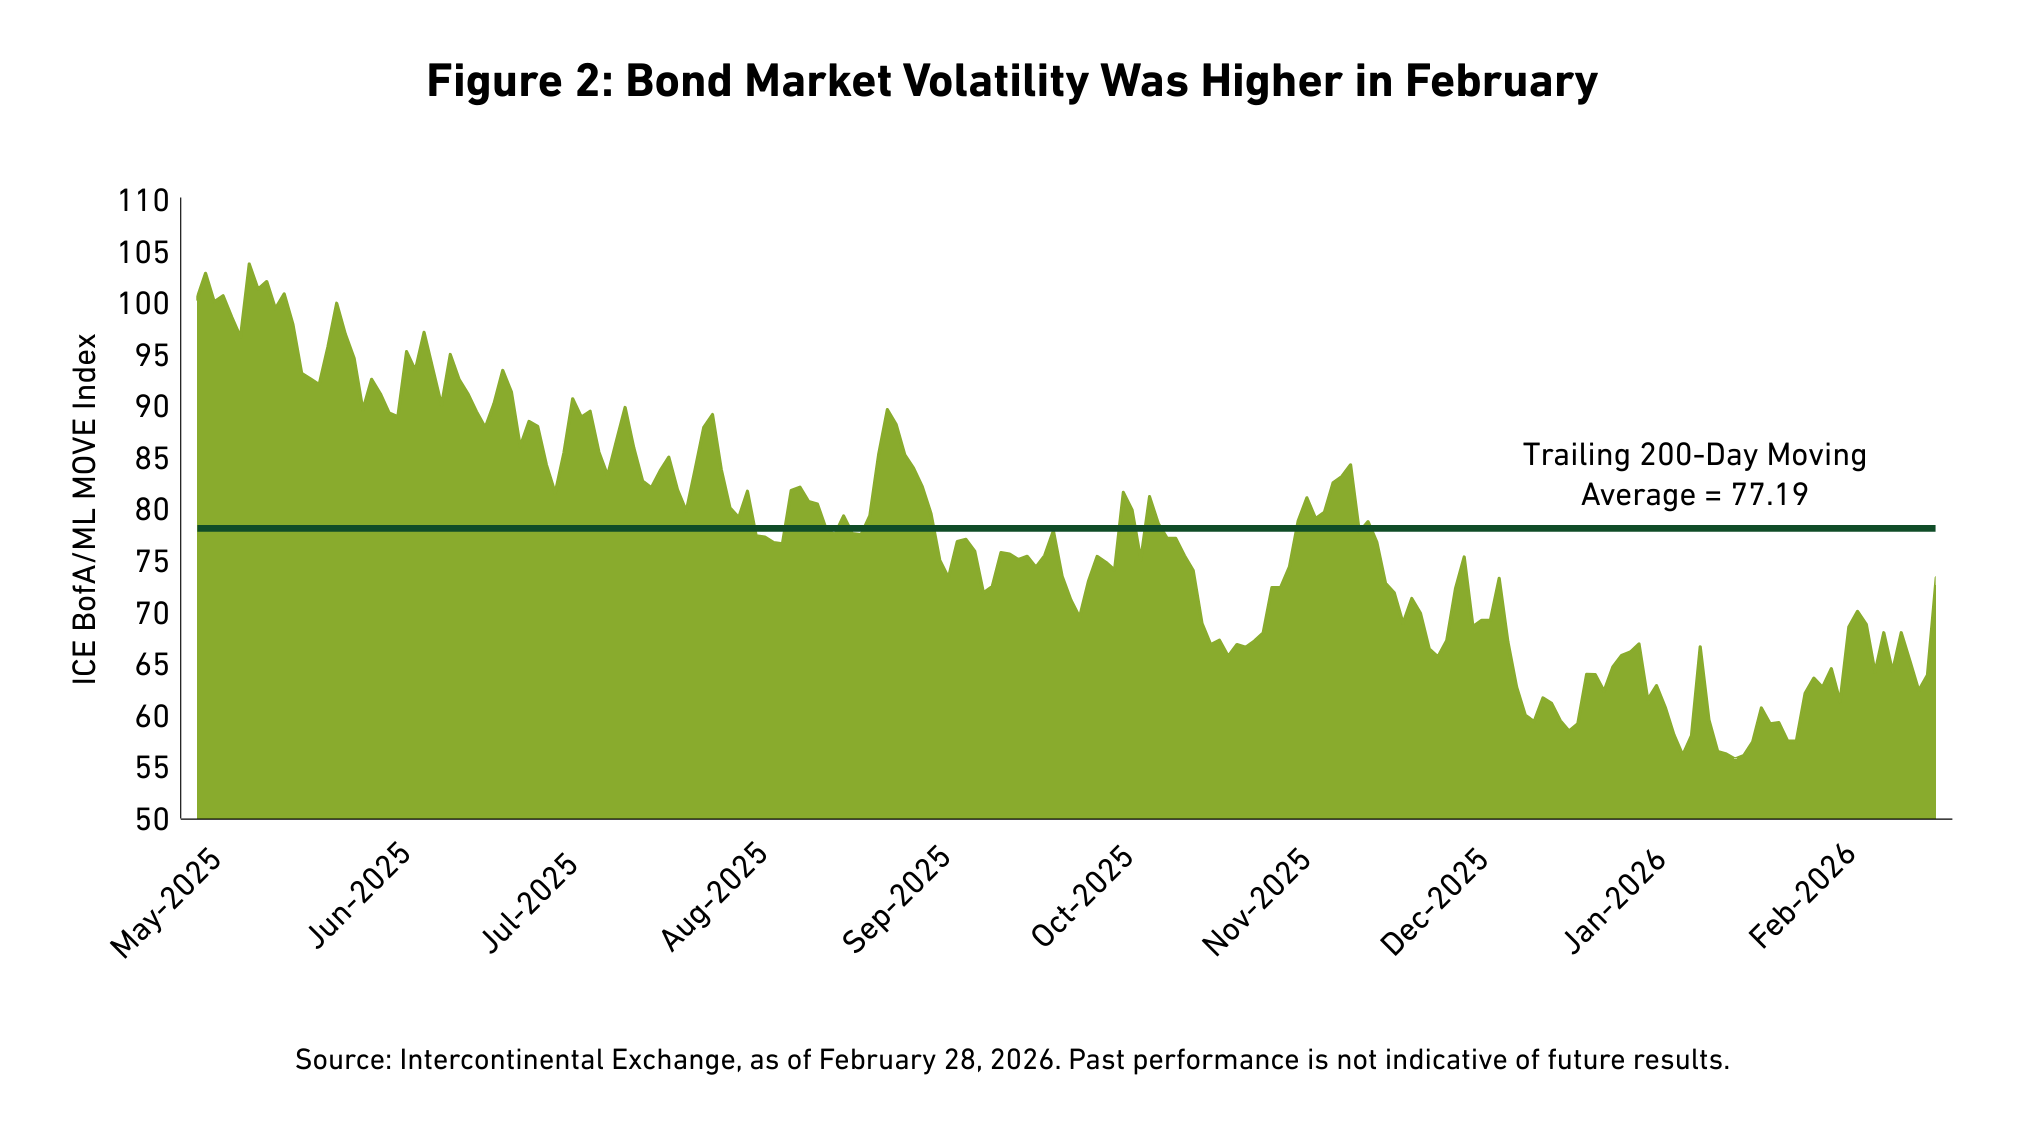
Bond market volatility, as measured by the ICE Bank of America/Merrill Lynch Option Volatility Estimate (MOVE) Index,4 moved higher during February, touching levels not seen since December. After receding somewhat later in the month, volatility spiked once again at month end.
Looking ahead, the Breckinridge Investment Committee (IC) believes the 10-year Treasury yield will remain range-bound between 4.0 percent and 4.5 percent. We are currently maintaining a defensive portfolio posture, as tight valuations across most spread sectors offer little margin for error against rising idiosyncratic risks. While we anticipate moderate real growth, we believe that above-average yields will continue to support steady investment flows into fixed income. We continue to identify selective opportunities in high-quality investment-grade credits, specifically within sectors that have faced recent price pressure but maintain solid fundamentals.
Municipal Market Review
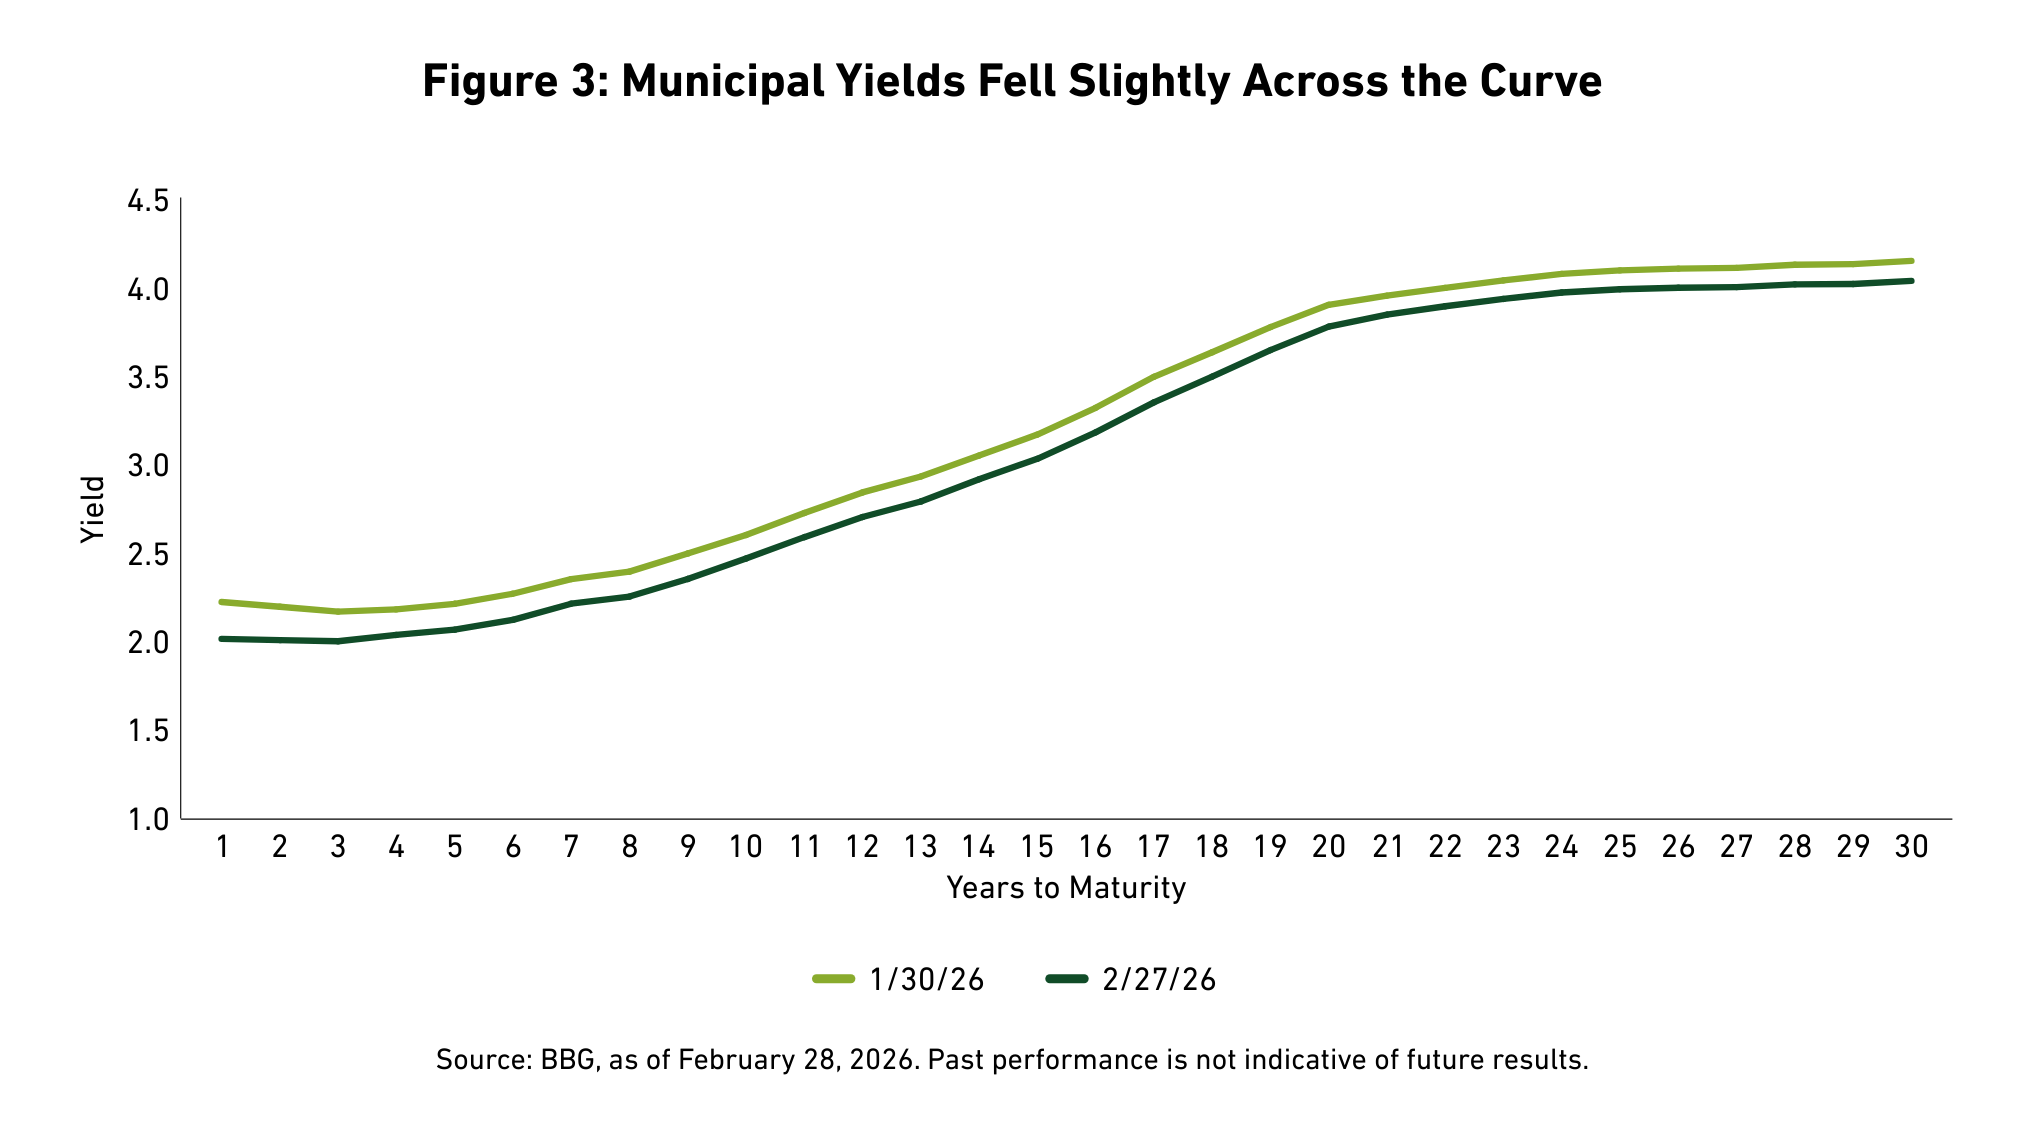
Municipal bond issuance rose to just under $44 billion in February, up from $36 billion in January. The BBG Managed Money Short/Intermediate Index (the Managed Money S/I Index) gained 0.90 percent, as municipal yields fell across the curve. Specifically, 2-, 5-, 10-, and 30-year yields declined by 15, 14, 12, and 12bps, respectively, leading to a slight steepening of the municipal yield curve (See Figure 3). With a second consecutive month of solid total returns, the Managed Money S/I Index is up nearly 2 percent year-to-date through February.
The strong start to the year has been driven by a surge of inflows into open-end mutual Funds, ETFs and SMAs. Data from London Stock Exchange Group (LSEG) showed year-to-date inflows of almost $18 billion. We maintain a defensive posture in this space, balancing these strong technical flows against lower nominal yields and rich valuations. The M/T Ratio curve remains flat with ratios sub 60 percent from 2 to 5 years, 63 percent in 10 years and 89 percent in thirty years, according to BBG data (See Figure 4). Better opportunities may arise in Q2 during tax season and higher levels of new-issue supply.
Corporate Market Review
The U.S. Corporate Bond Index OAS widened by 11bps in February, reflecting a more cautious outlook on credit. While the U.S. Corporate Bond Index managed a total return of 1.29 percent, the excess return for the month was negative 0.77 percent, as spreads failed to keep pace with the rally in Treasuries.
Sector performance was bifurcated. According to BBG, the strongest results came from Foreign Local Government, Supranationals, and Foreign Agencies. Conversely, the Life Insurance, Property & Casualty (P&C), and Media Entertainment sectors lagged the broader market.
Primary market activity was robust, with gross corporate bond issuance reaching $197.9 billion—a 14 percent increase over February of the previous year. After accounting for $106.5 billion in redemptions, BBG reported net issuance for the month at $91.4 billion.
Capital continued to seek out high-quality yields. Total taxable bond inflows reached $94 billion over the last 30 days, as investors took advantage of above-average yields.
Securitized Market Review
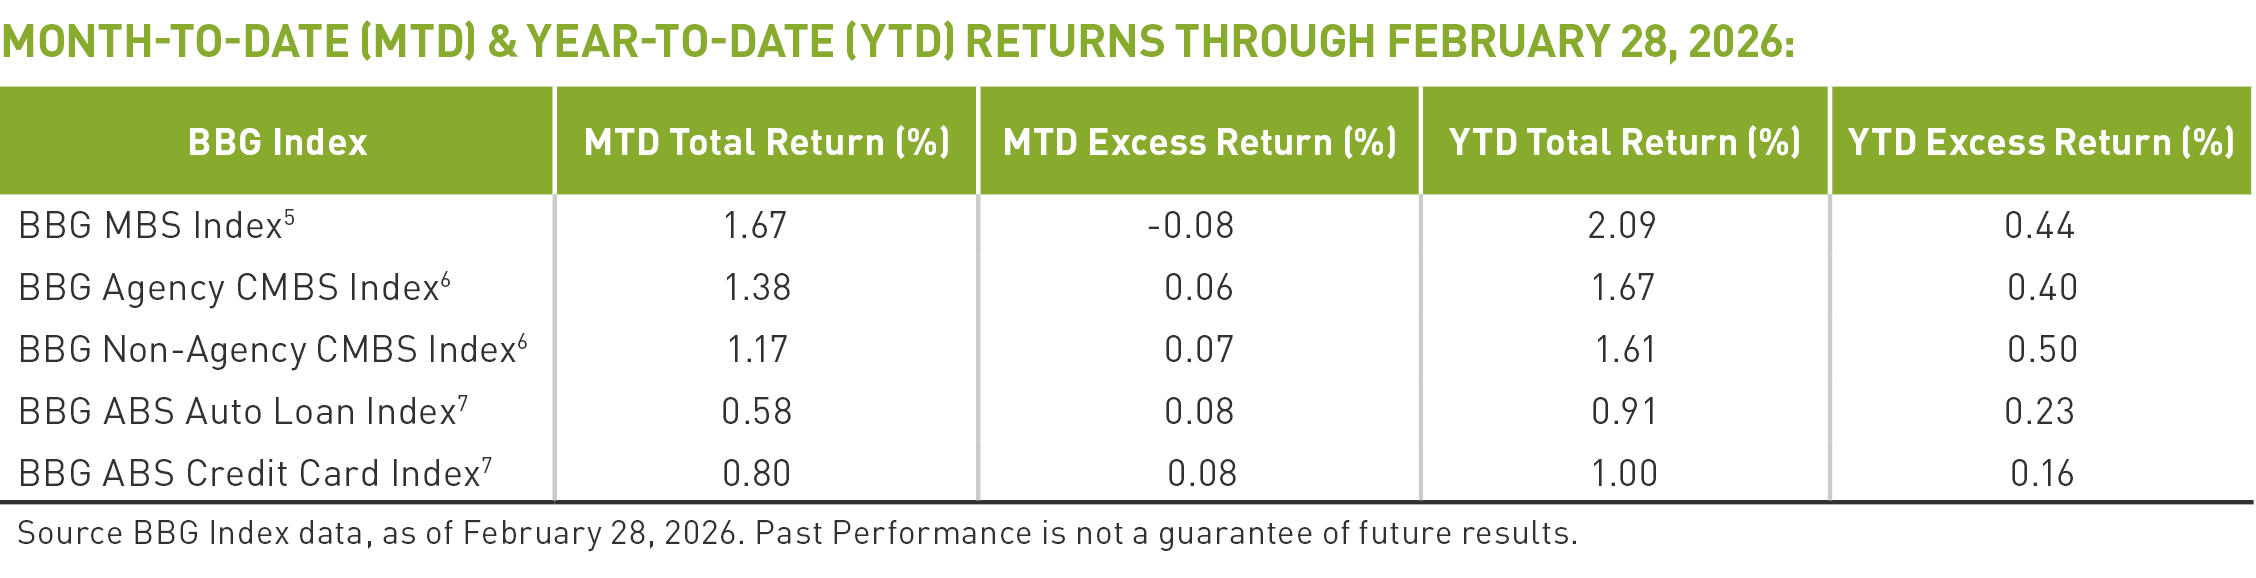
Securitized assets delivered positive total returns in February, though excess returns remained muted. BBG reported that MBS earned 1.67 percent, while excess returns were slightly negative at -0.08 percent. Agency MBS spreads widened by 5bps, though the "belly" of the coupon stack—specifically 3s and 4s—outperformed the rest of the sector. Within the broader sector, Commercial MBS (CMBS) returned 1.28 percent, with Agency and Non-Agency CMBS posting returns of 1.38 percent and 1.17 percent, respectively.
ABS saw a total return of 0.87 percent and a modestly positive excess return of 0.03 percent. Performance varied by collateral type: Credit Card Loans returned 0.80 percent, while Auto Loans returned 0.58 percent. While aggregate ABS spreads remained unchanged, we are closely monitoring the emergence of idiosyncratic risks within sub-prime auto and non-bank lending segments.
Equity Market Review
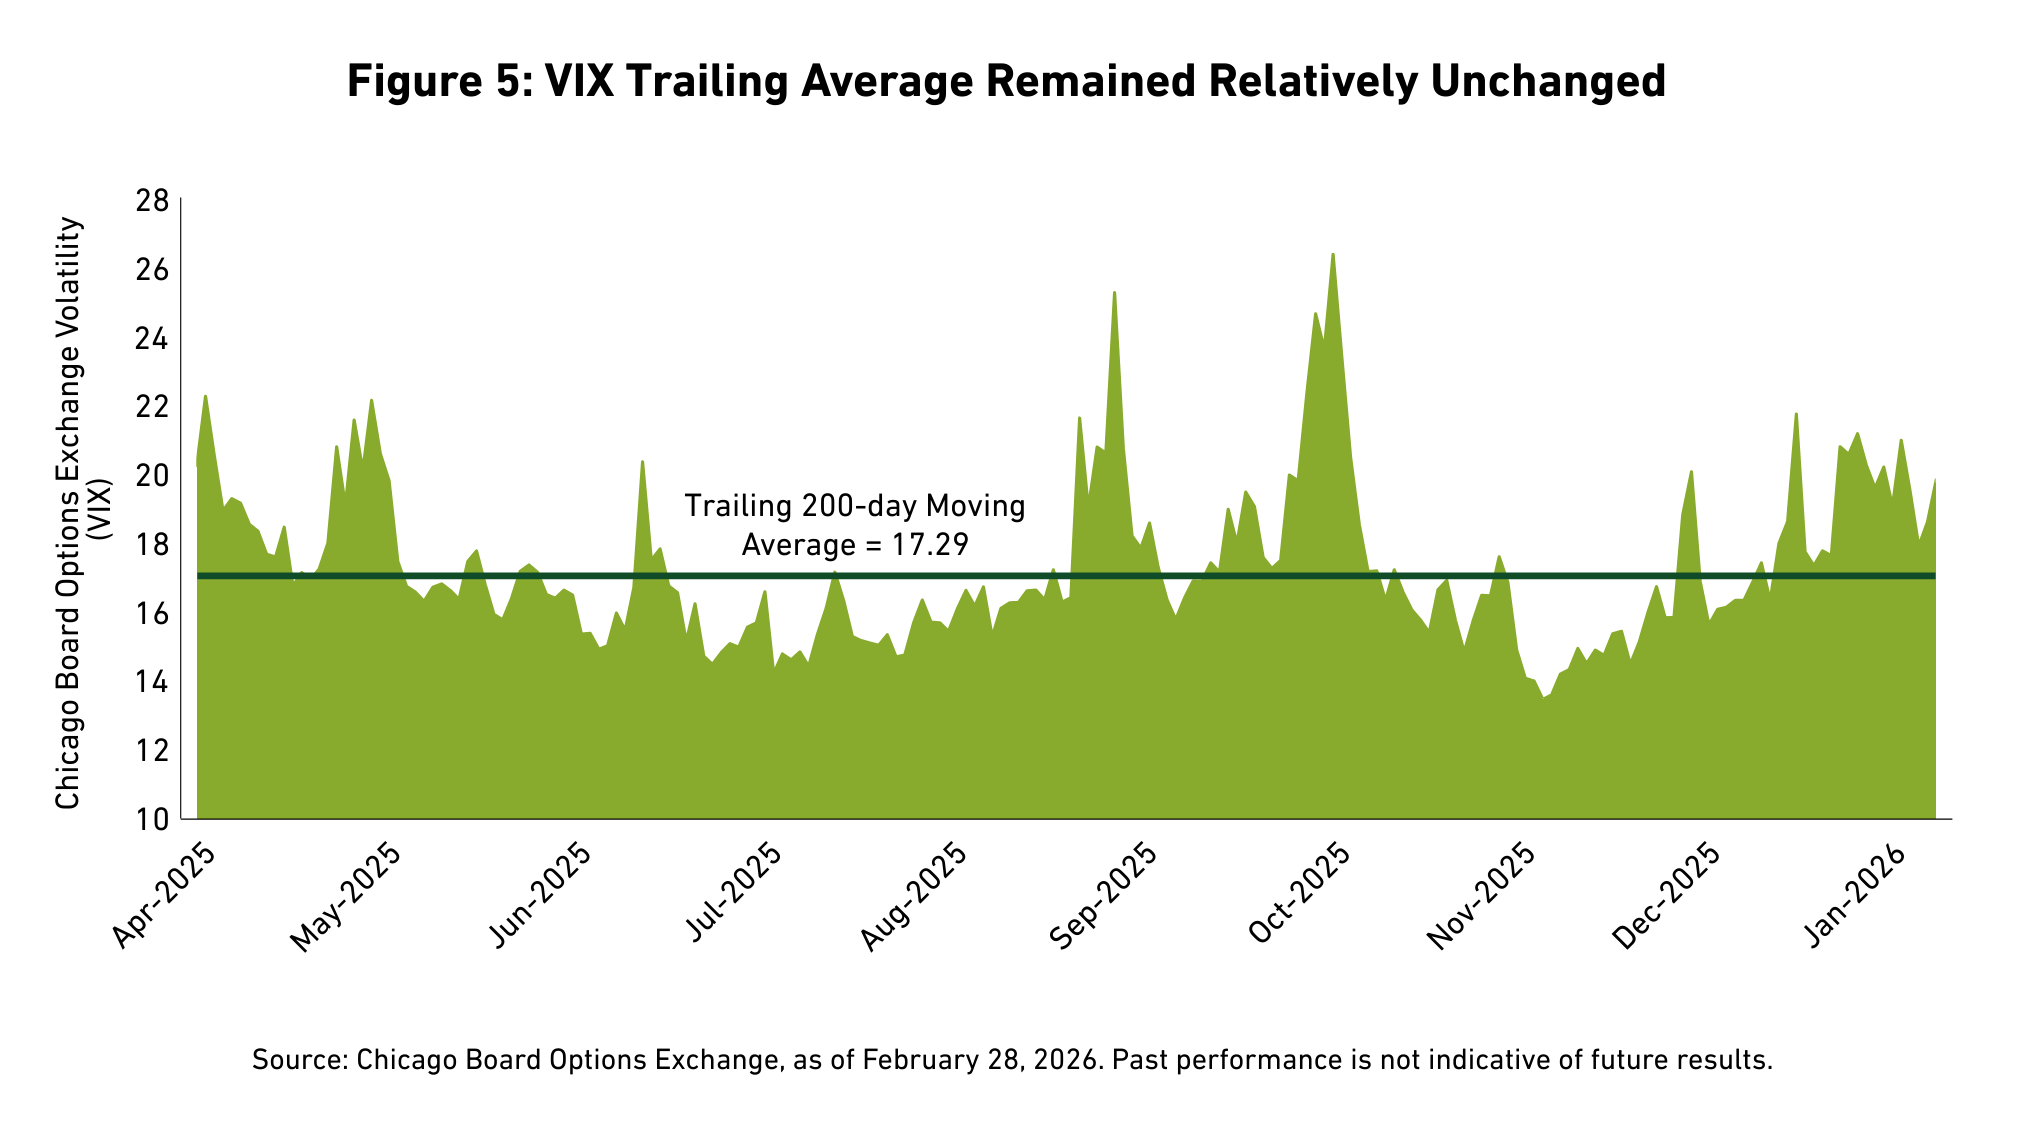
The S&P 500 Index retreated 0.76 percent in February, as investors rotated away from mega-cap technology and companies that may be impacted by AI related disruption and into sectors that face low obsolescence risk. Volatility picked up in February, with the Chicago Board Options Exchange (CBOE) Volatility Index (VIX) ending the month near 20, above the trailing 200-day average of 17.29 (See Figure 5).
Sector performance was led by both defensive and select cyclical sectors where multiples are not as stretched as those in the Information Technology sector. Top performing sectors during the month included Utilities (10.35 percent), Energy (9.43 percent), and Materials (8.38 percent). In contrast, the previous leaders in the growth space faltered; Consumer Discretionary fell 5.38 percent, Communication Services declined 5.13 percent, and Information Technology dropped 3.91 percent.
This rotation was evident in the style indices, as the Russell 1000 Value Index rose 2.59 percent while the Russell 1000 Growth Index fell 3.36 percent. Despite the monthly dip in the broader index, corporate fundamentals remain a point of strength. FactSet reported that with 96 percent of S&P 500 companies reporting, fourth-quarter 2025 earnings grew 14.2 percent year-over-year, marking the fifth consecutive quarter of double-digit earnings growth.
[1] The Municipal/Treasury (M/T) ratio compares yields of municipal bonds with those of U.S. Treasury bonds of the same maturity. M/T ratios can show the relative value of municipal bonds compared with taxable bonds, by indicating when yields for municipal bonds exceed the after-tax yields on taxable bonds.
[2] As of February 28, 2026, as measured by the BBG U.S. Corporate Investment Grade Bond Index, an unmanaged market-value-weighted index of investment grade corporate fixed-rate debt issues with maturities of one year or more. You cannot invest directly in an index.
[3] The S&P 500 Index consists of 500 stocks chosen for market size, liquidity, and industry group representation. Itis a market-value-weighted index with each stock’s weight in the index proportionate to its market value. Performance is as of February 28, 2026. You cannot invest directly in an index.
[4] The ICE BofA/ML Merrill Lynch Option Volatility Estimate (MOVE) Index measures U.S. interest rate volatility by tracking the movement in U.S. Treasury yield volatility implied by current prices of one-month over-the-counter options on 2-year, 5-year, 10-year and 30-year Treasuries. Historically, the index rises as concerns grow that interest rates are moving higher. You cannot invest directly in an index.
[5] The BBG MBS Index tracks agency mortgage-backed pass-through securities (both fixed-rate and hybrid ARM) guaranteed by government-sponsored enterprises (GSEs) Government National Mortgage Association (Ginnie Mae) (GNMA), Federal National Mortgage Association (Fannie Mae) (FNMA), and Federal Home Loan Mortgage Corporation (Freddie Mac) (FHLMC). The index is constructed by grouping individual pools into aggregates or generics based on program, coupon, and vintage. You cannot invest directly in an index.
[6] The BBG U.S. CMBS Investment Grade Index measures the market of U.S. Agency (GNMA, FNMA, and (FHLMC) and U.S. Non-Agency conduit and fusion CMBS deals with a minimum current deal size of $300mn. You cannot invest directly in an index.
[7] BBG U.S. Asset-Backed Securities (ABS) Index is the ABS component of the Bloomberg U.S. Aggregate Bond Index, a flagship measure of the U.S. investment grade, fixed-rate bond market. The ABS index has three subsectors: credit and credit cards, autos, and utility. You cannot invest directly in an index.
BCAI - 03062026-yopiulnk (3/10/2026)
DISCLAIMERS:
This material provides general information and should not be construed as a solicitation or offer of services or products or as legal, tax or investment advice. Nothing contained herein should be considered a guide to security selection, asset allocation or portfolio construction.
All information and opinions are current as of the dates indicated and are subject to change. Breckinridge believes the data provided by unaffiliated third parties to be reliable but investors should conduct their own independent verification prior to use. Some economic and market conditions contained herein have been obtained from published sources and/or prepared by third parties, and in certain cases have not been updated through the date hereof.
There is no assurance that any estimate, target, projection or forward-looking statement (collectively, “estimates”) included in this material will be accurate or prove to be profitable; actual results may differ substantially. Breckinridge estimates are based on Breckinridge’s research, analysis and assumptions. Other events that were not considered in formulating such projections could occur and may significantly affect the outcome, returns or performance.
Not all securities or issuers mentioned represent holdings in client portfolios. Some securities have been provided for illustrative purposes only and should not be construed as investment recommendations. Any illustrative engagement or sustainability analysis examples are intended to demonstrate Breckinridge’s research and investment process.
Yields and other characteristics are metrics that can help investors in valuing a security, portfolio or composite. Yields do not represent performance results but they are one of several components that contribute to the return of a security, portfolio or composite. Yields and other characteristics are presented gross of advisory fees.
All investments involve risk, including loss of principal. No investment or risk management strategy, including diversification, can guarantee positive results or risk elimination in any market. Periods of elevated market volatility can significantly impact the value of securities. Investors should consult with their advisors to understand how these risks may affect their portfolios and to develop a strategy that aligns with their financial goals and risk tolerances.
Past performance is not indicative of future results. Breckinridge makes no assurances, warranties or representations that any strategies described herein will meet their investment objectives or incur any profits. Performance results for Breckinridge’s investment strategies include the reinvestment of interest and any other earnings, but do not reflect any brokerage or trading costs a client would have paid. Results may not reflect the impact that any material market or economic factors would have had on the accounts during the time period. Due to differences in client restrictions, objectives, cash flows, and other such factors, individual client account performance may differ substantially from the performance presented.
Actual client advisory fees may differ from the advisory fee used to calculate net performance results. Client returns will be reduced by the advisory fees and any other expenses incurred in the management of their accounts. For example, an advisory fee of 1 percent compounded over a 10-year period would reduce a 10 percent return to a 9 percent annual return. Additional information on fees can be found in Breckinridge’s Form ADV Part 2A.
Index results are shown for illustrative purposes and do not represent the performance of any specific investment. Indices are unmanaged and investors cannot directly invest in them. They do not reflect any management, custody, transaction or other expenses, and generally assume reinvestment of dividends, income and capital gains. Performance of indices may be more or less volatile than any investment strategy.
Fixed income investments have varying degrees of credit risk, interest rate risk, default risk, and prepayment and extension risk. In general, bond prices rise when interest rates fall and vice versa.
Equity investments are volatile and can decline significantly in response to investor reception of the issuer, market, economic, industry, political, regulatory or other conditions.
BLOOMBERG® is a trademark and service mark of Bloomberg Finance L.P. and its affiliates (collectively “Bloomberg”). Bloomberg does not approve or endorse this material or guarantees the accuracy or completeness of any information herein, or makes any warranty, express or implied, as to the results to be obtained therefrom and, to the maximum extent allowed by law, neither shall have any liability or responsibility for injury or damages arising in connection therewith.
The S&P500 Index (“Index”) and associated data is a product of S&P Dow Jones Indices LLC, its affiliates and/or their licensors and has been licensed for use by Breckinridge. © 2026 S&P Dow Jones Indices LLC, its affiliates and/or their licensors. All rights reserved. Redistribution or reproduction in whole or in part are prohibited without written permission of S&P Dow Jones Indices LLC. For more information on any of S&P Dow Jones Indices LLC’s indices please visit www.spdji.com. S&P® is a registered trademark of Standard & Poor’s Financial Services LLC (“SPFS”) and Dow Jones® is a registered trademark of Dow Jones Trademark Holdings LLC (“Dow Jones”). Neither S&P Dow Jones Indices LLC, SPFS, Dow Jones, their affiliates nor their licensors (“S&P DJI”) make any representation or warranty, express or implied, as to the ability of any index to accurately represent the asset class or market sector that it purports to represent and S&P DJI shall have no liability for any errors, omissions, or interruptions of any index or the data included therein.