Investing
Commentary published on January 13, 2026
December 2025 Market Commentary
Summary
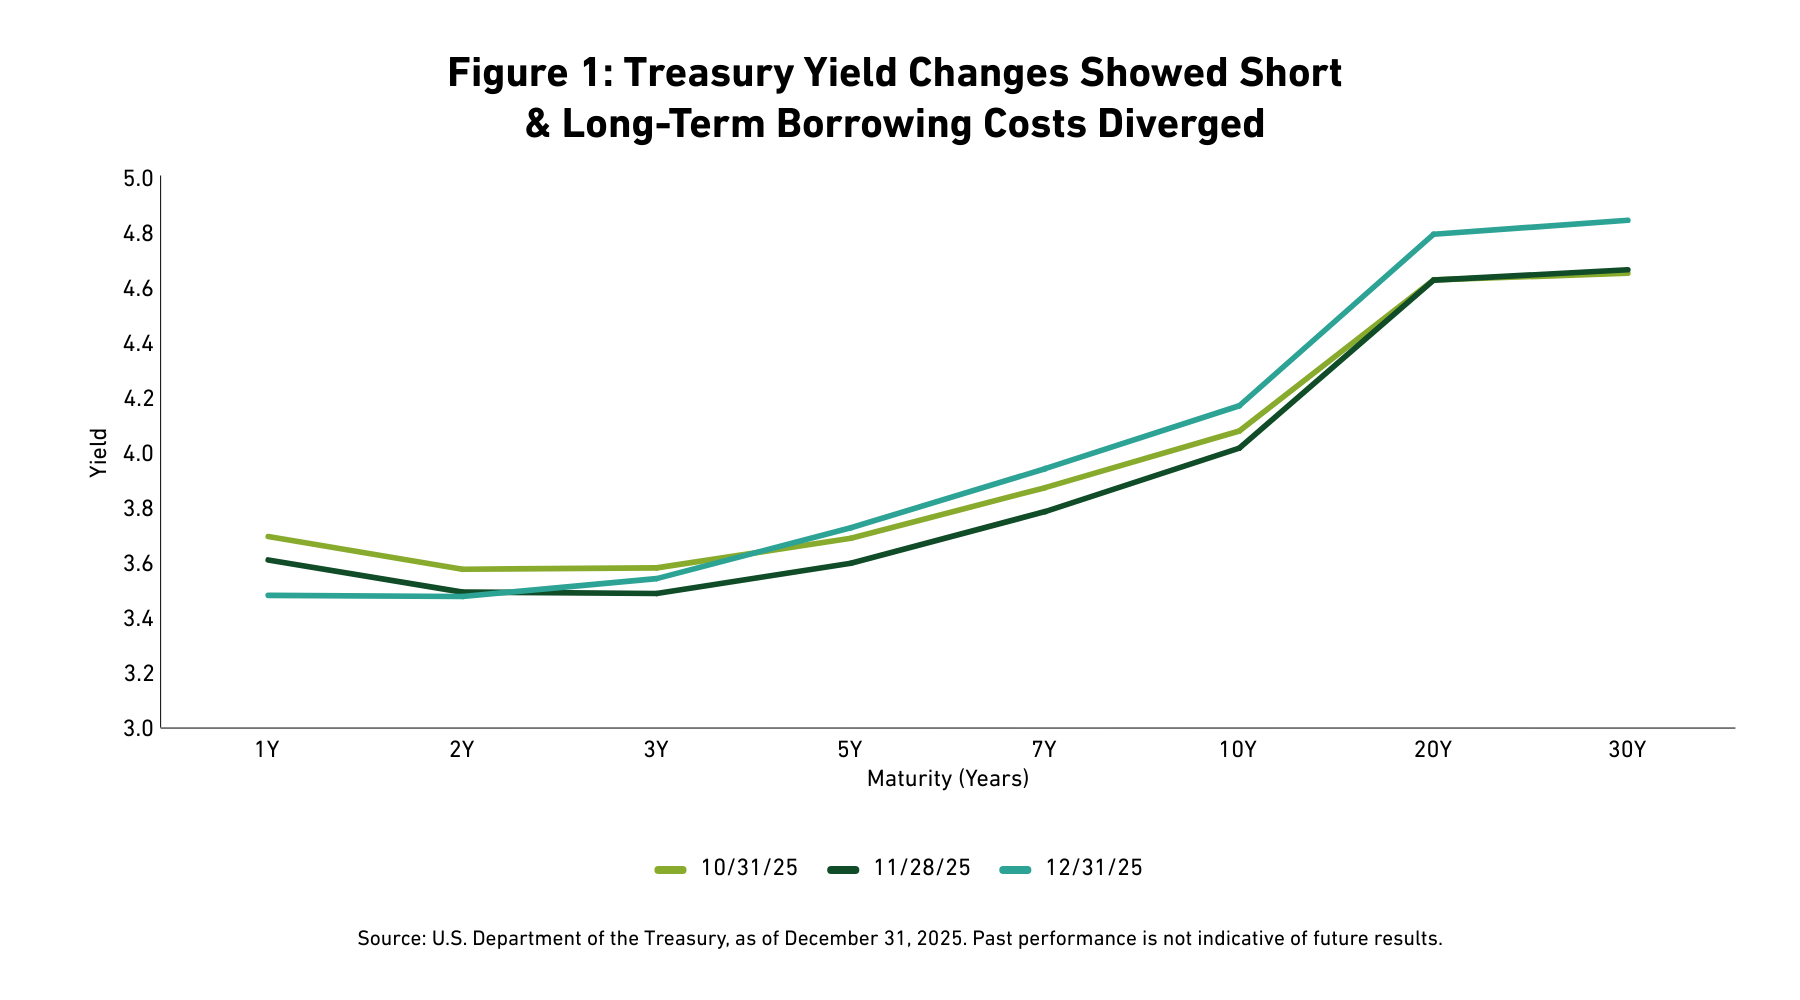
- U.S. Treasury Curve: The U.S. Treasury curve bear steepened, with 2-year yields falling by 2 basis points (bps), while 10-year and 30-year yields rose by 15 and 18bps.
- Municipal Markets: Municipal bond returns were positive amid declining yields and stable Municipal/Treasury (M/T) ratios [1], as issuance fell to $41 billion.
- Corporate Markets: The BBG Investment Grade (IG) Corporate Bond Index [2] (the Corporate Bond Index) option-adjusted spread (OAS) tightened, as corporate bond issuance totaled $28.1 billion, a significant drop from $143.9 billion in the prior month.
- Securitized Markets: Both mortgage-backed (MBS) and asset-backed securities (ABS) delivered positive total returns, capping off the MBS market's best year since 2010.
- Equity Markets: The S&P 500 Index [3] gained a modest 0.06 percent, with Financials, Materials, and Industrials outperforming Utilities, Real Estate and Consumer Staples.
The following commentary summarizes discussions among members of the Breckinridge Capital Advisors Investment Committee as they reviewed monthly market activity and investment returns. The Investment Committee members, led by Co-Chief Investment Officers Matthew Buscone and Jeffrey Glenn, CFA, include Co-Heads of Research Nicholas Elfner and Adam Stern, J.D., M.P.A., and Portfolio Manager and Director, Corporate Research, Josh Perez, CFA.
MARKET REVIEW
Economic growth remained robust in the fourth quarter, fueled by strong spending from high-income households and productivity gains linked to artificial intelligence (AI)-related investments. Third-quarter gross domestic product (GDP) expanded at an annual rate of 4.3 percent, marking the fastest pace in two years and significantly exceeding expectations. However, labor market signals were mixed: October payrolls pushed the unemployment rate to 4.6 percent, while November’s data showed a slight rebound. The core consumer price index (CPI) came in lower than expected in November, though inconsistencies in data collection raised questions about the reliability of this reading.
Treasury yields concluded the month with a bear steepening of the curve. Shorter-term rates declined, while longer-term yields rose, reflecting shifting market expectations. Specifically, the 2-year yield fell by 2bps, while the 10-year and 30-year yields increased by 15 and 18bps, respectively (See Figure 1). This movement widened the 2s/10s spread, indicating a greater divergence between short and long-term borrowing costs.
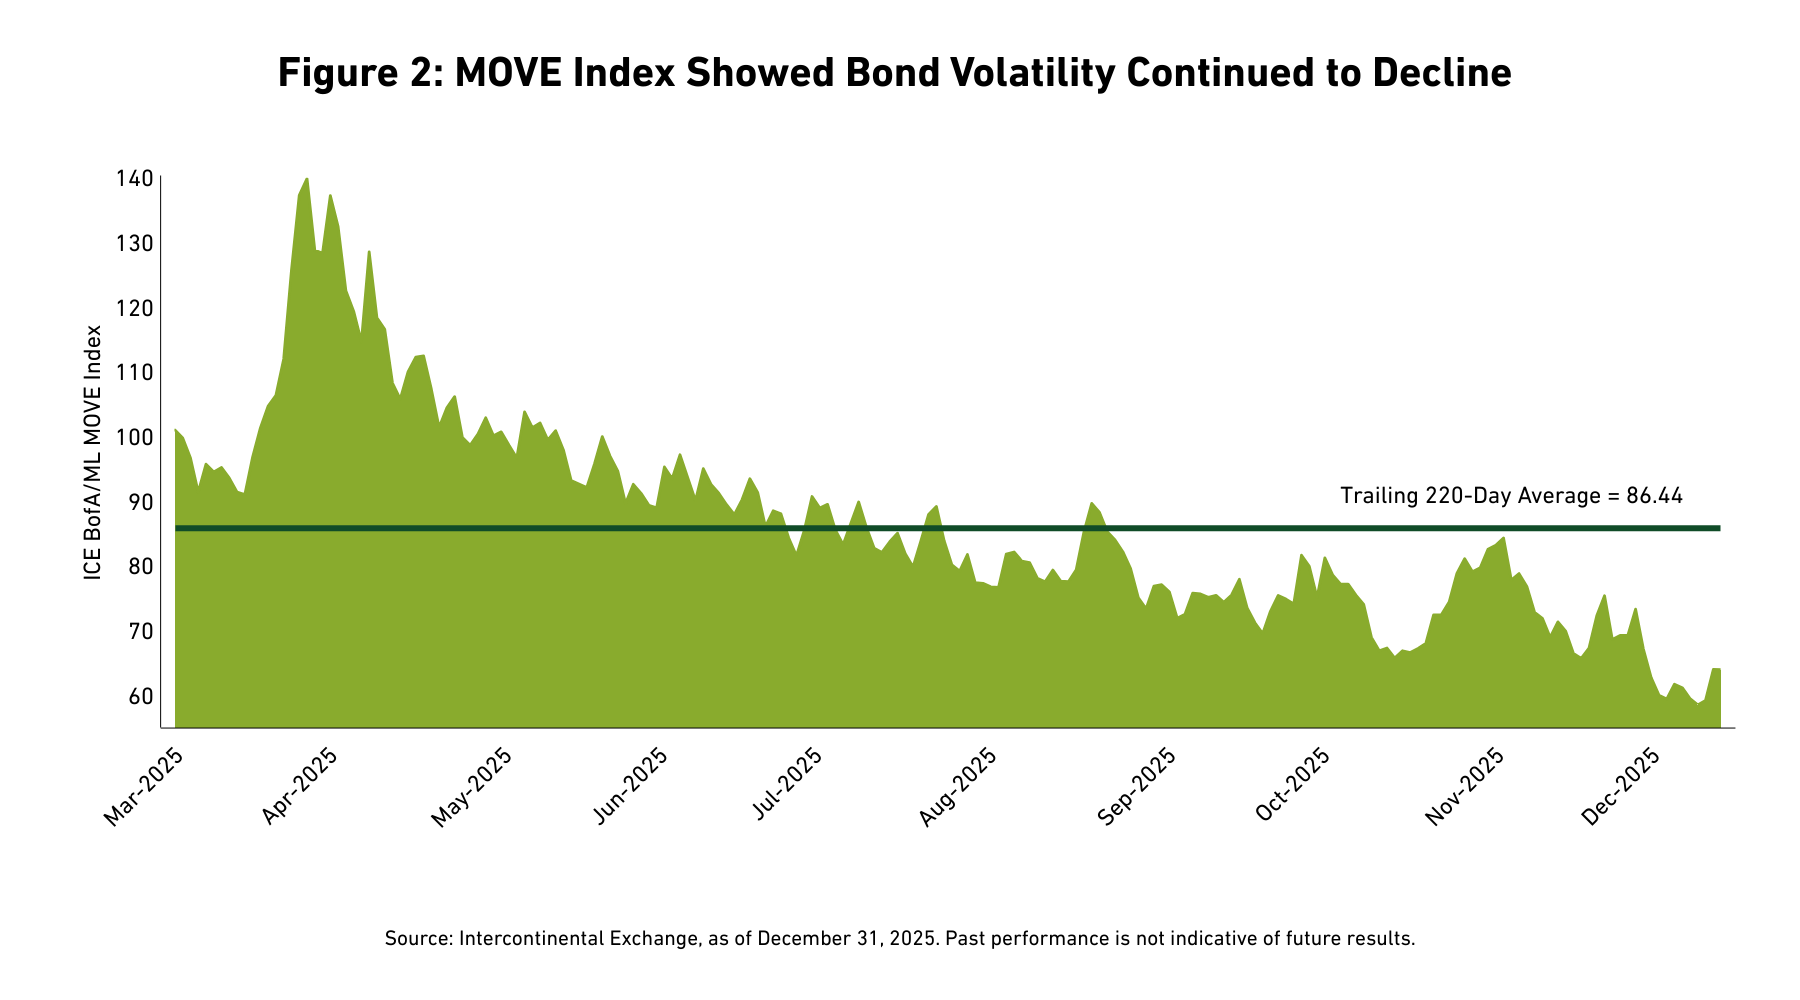
Bond market volatility, as measured by the ICE Bank of America/Merrill Lynch Option Volatility Estimate (MOVE) Index,4 declined (See Figure 2). This suggests calmer conditions prevailed despite ongoing policy uncertainty. The Bloomberg (BBG) U.S. Treasury Index5 posted a total return of negative 0.33 percent for the month, underscoring the challenging environment for Treasury investors.
The Breckinridge Investment Committee (IC) anticipates the 10-year Treasury yield will remain within a range of 4.0 to 4.5 percent in the near term. It also foresees one additional Federal Reserve rate cut by mid-2026. Given expectations for moderate real growth, portfolio positioning remains defensive, favoring spread sectors over Treasuries despite their tight valuations. Above-average yields continue to attract strong investor demand, particularly within corporate and securitized credit markets, highlighting their relative attractiveness in the current landscape.
MUNICIPAL MARKET REVIEW
Municipal bond issuance totaled $41 billion in December, a decline from $44.66 billion in November and notably below the $58.3 billion issued in October. This downward trend in new supply contributed to a more balanced technical backdrop for the municipal market by month-end, helping to support bond prices.
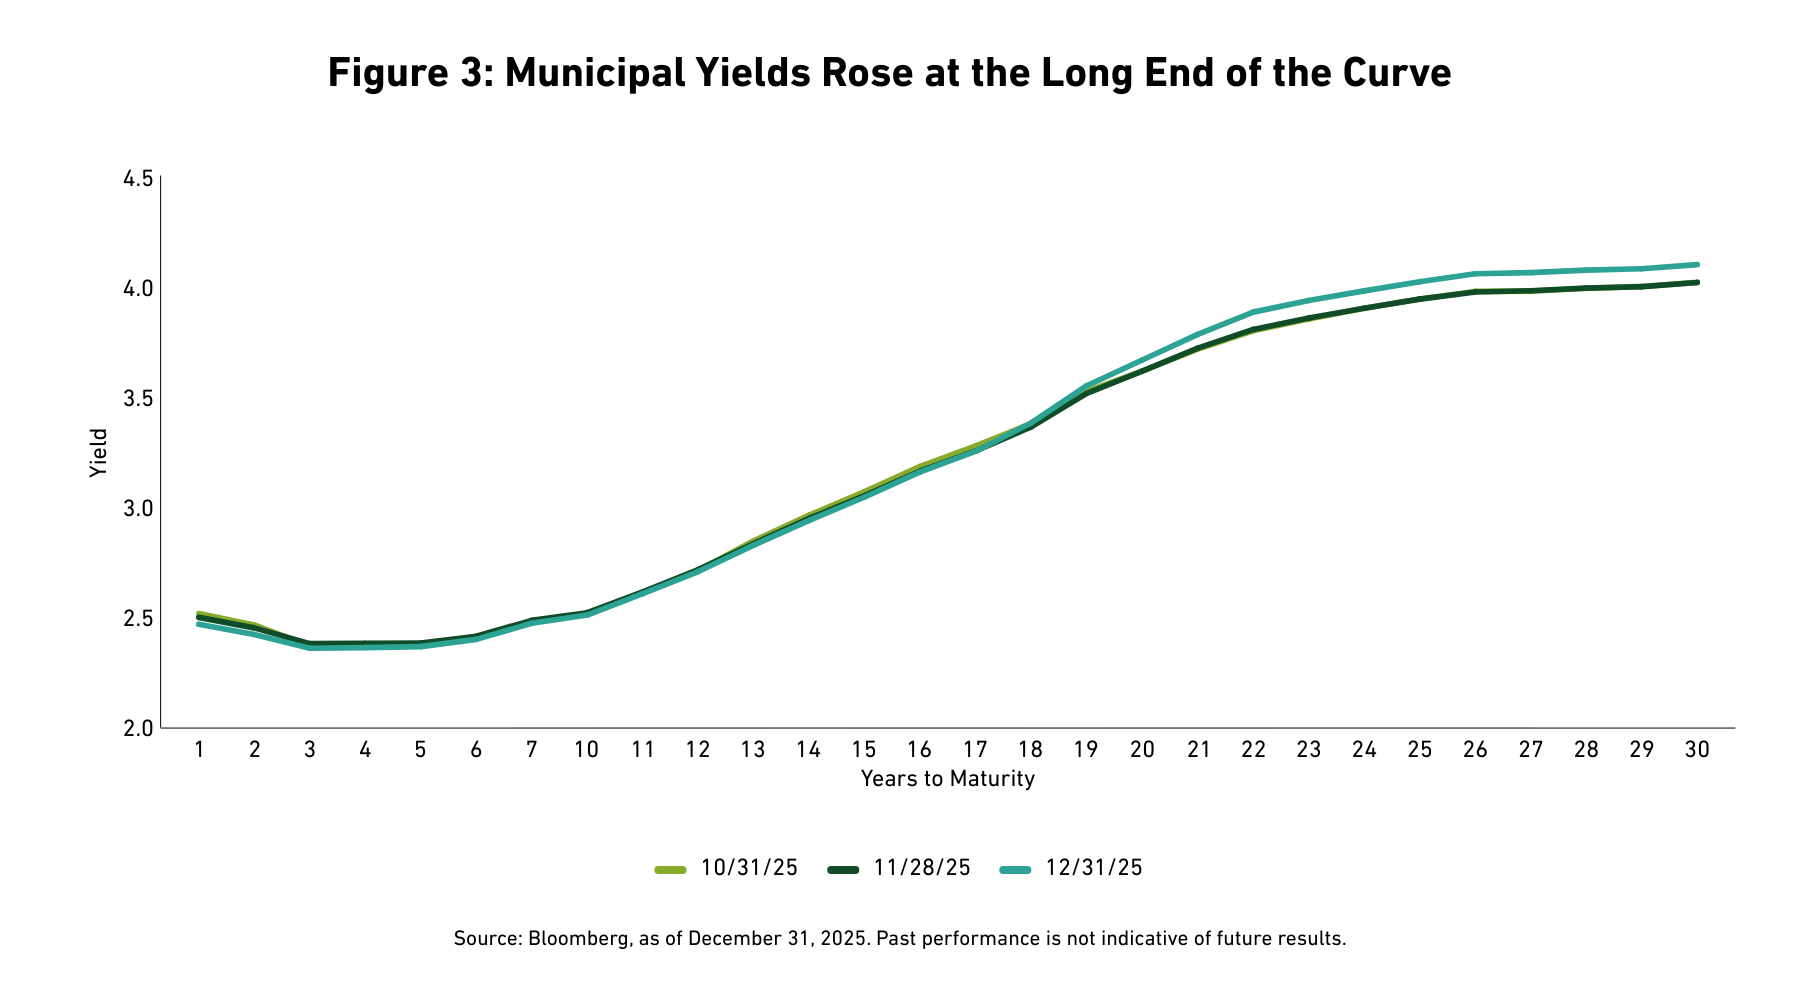
The BBG Short/Intermediate Municipal Bond Index6 posted a total return of 0.31 percent in December, reflecting modest price appreciation and income performance. Municipal yields fell by 3, 2, and 1bp at the 2-, 5-, and 10-year maturities, respectively (See Figure 3). In contrast, the 30-year yield rose by 8bps, indicating a slight bear steepening in the municipal curve.
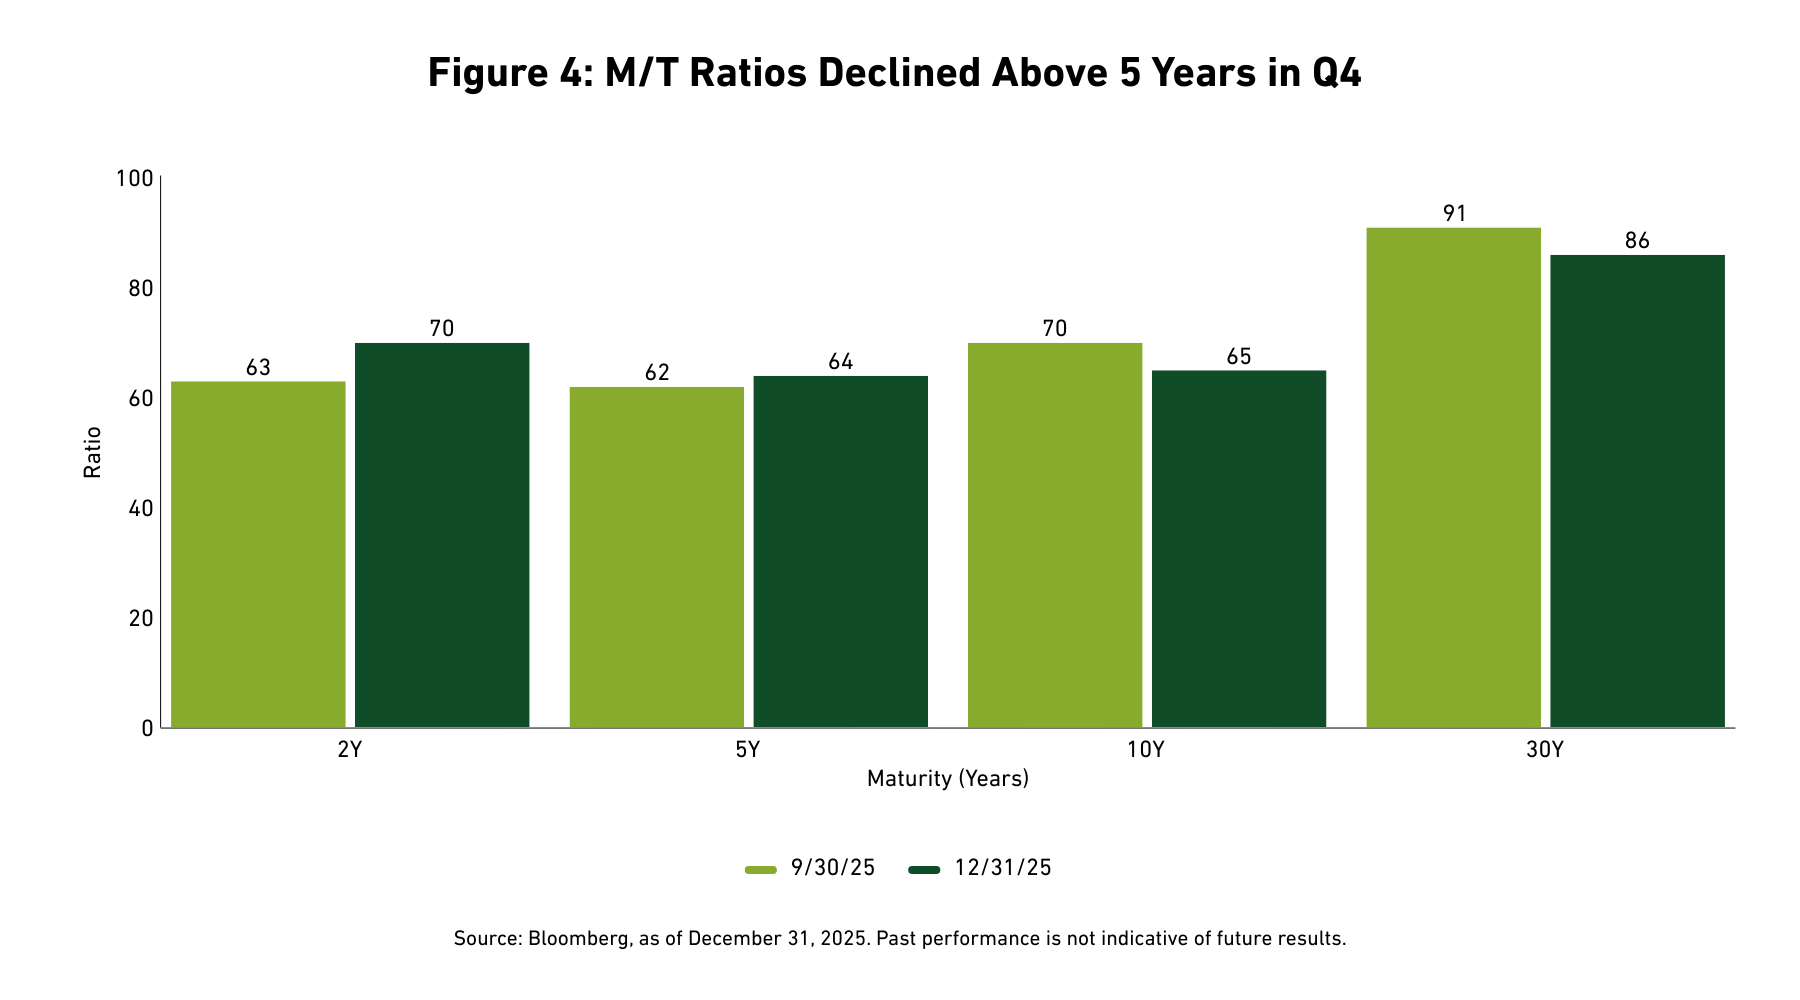
M/T ratios ended the month at 70 percent for 2-year, 64 percent for 5-year, 65 percent for 10-year, and 86 percent for 30-year maturities (See Figure 4). Shorter-dated ratios appeared relatively attractive compared to historical ranges, suggesting continued demand for tax-exempt paper, particularly in the shortest part of the curve.
Investment Company Institute data showed municipal bond funds received $6.58 billion in net inflows during December, signaling sustained retail investor interest. In our view, demand remained supported by favorable after-tax yields and portfolio rebalancing activity, even as new issuance volumes moderated toward year-end.
CORPORATE MARKET REVIEW
The U.S. Corporate Bond Index OAS tightened by 3bps in December to 78bps, indicating improved credit conditions. Corporates posted a total return of negative 0.20 percent, with an excess return of 0.26 percent. Spreads remain tight at just the 2nd percentile when looking at the past 20 years. All-in yields remain attractive at the 66th percentile.
The best-performing corporate sectors were Life Insurance, Metals and Mining, and Gaming, demonstrating resilience and investor confidence. Conversely, the worst-performing sectors were Media Entertainment, Technology, and Supranationals, which faced headwinds during the month. The BBB sector tightened by 4bps in December outperforming AA’s and A’s which tightened by 1bps and 2bps, respectively.
In a typical seasonal pattern, corporate bond gross issuance was a modest $28.1 billion in December, a significant decrease from $143.9 billion in November, but in-line with the prior year’s tally of $34.5 billion. With redemptions of $54.6 billion, net issuance was a negative $26.4 billion in December.
Mutual fund and ETF flows into corporate bond funds totaled $51 billion for the month. This substantial inflow reflects continued investor demand for taxable fixed income assets, underscoring their appeal in the current market.
SECURITIZED MARKET REVIEW
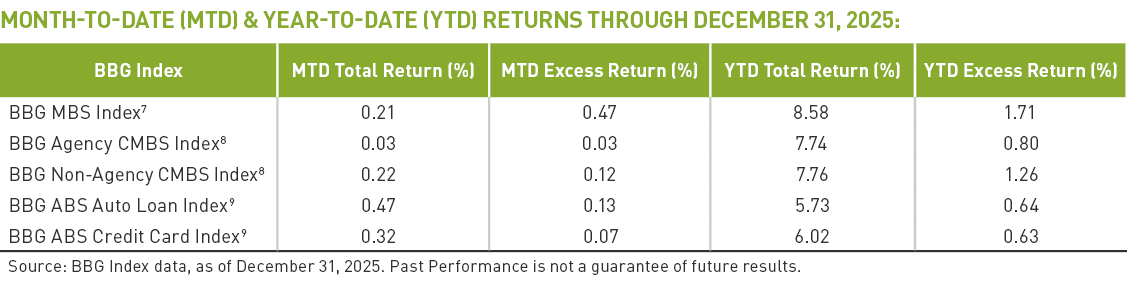
MBS delivered positive total returns and excess returns in December and full-year 2025. Spreads in the Agency MBS sector tightened significantly over the year, supported by lower rate volatility and strong demand across the coupon stack, indicating robust investor appetite. Agency CMBS, however, posted lower returns compared to Non-Agency CMBS, which generated stronger performance on both a total and excess return basis.
Asset-backed securities also recorded positive total returns, led by auto loan ABS, which outperformed credit card ABS in both total and excess return terms. Overall, subsector performance within ABS reflected a continued investor preference for shorter-duration, higher-quality structures, highlighting a cautious yet engaged approach to securitized assets.
EQUITY MARKET REVIEW
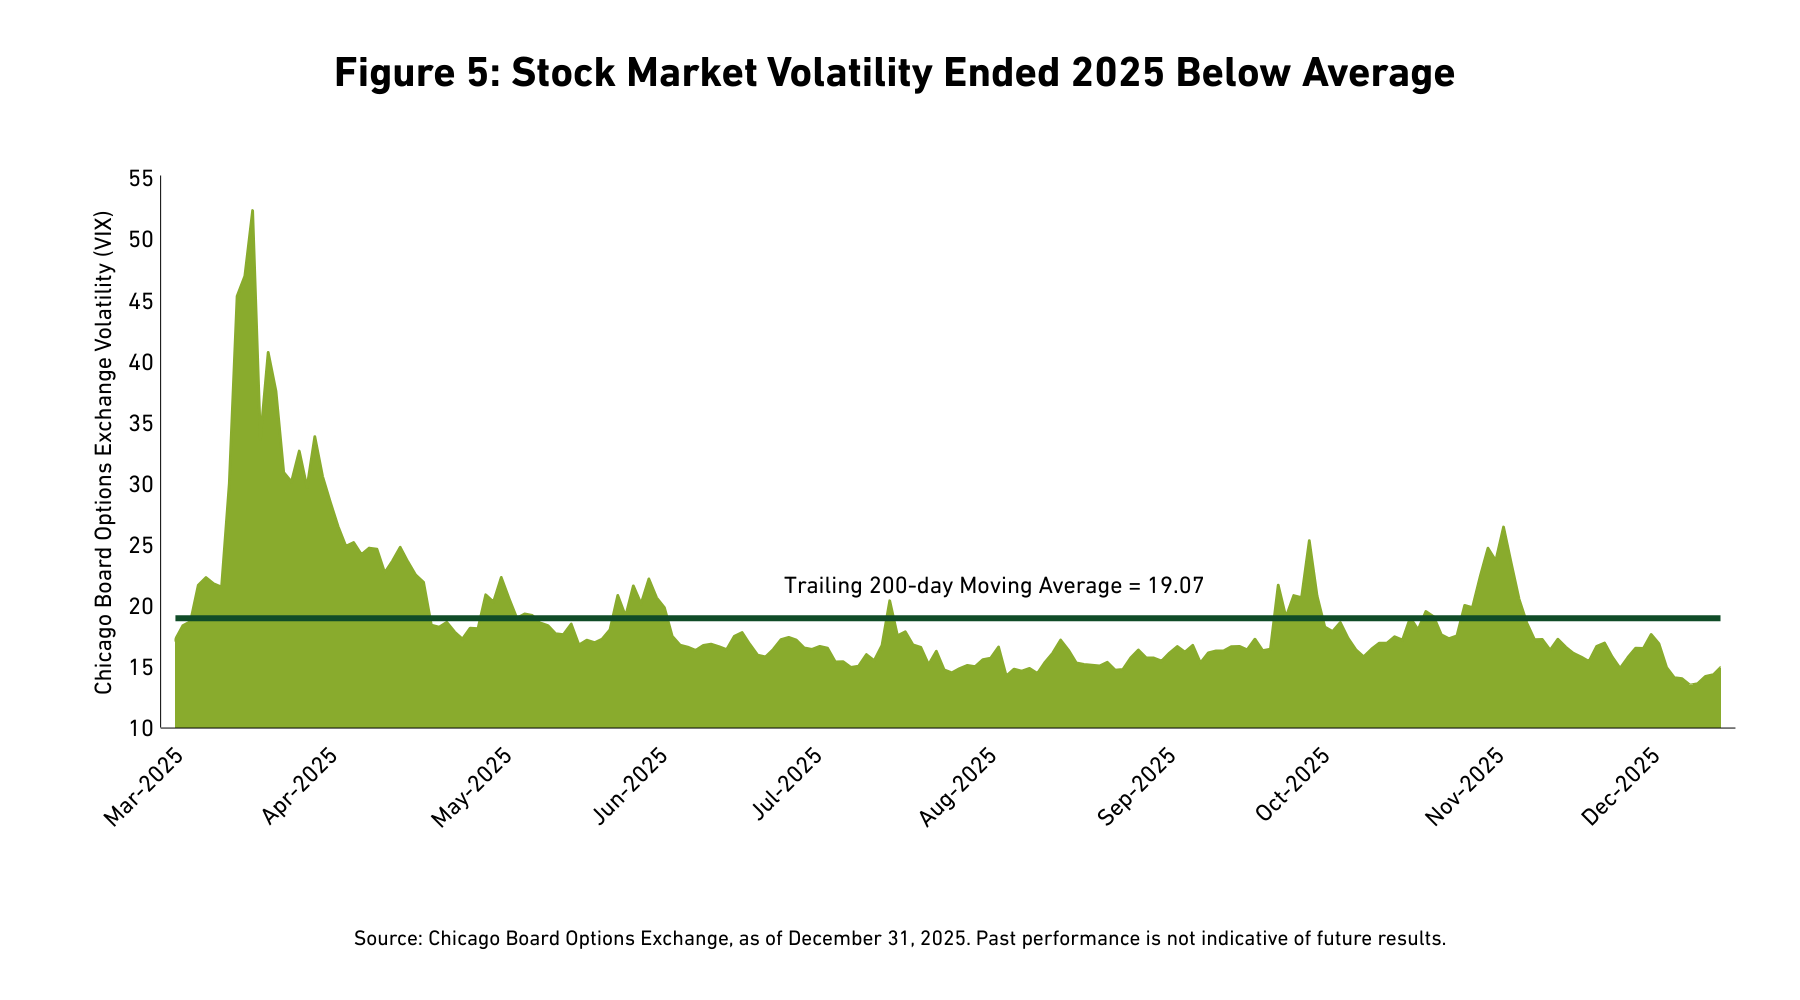
The S&P 500 Index recorded a total return of 0.06 percent for December 2025, indicating a largely flat month for equities. The Chicago Board Options Exchange (CBOE) Volatility Index10 (VIX) had a trailing 200-day moving average of 19.07 at month-end, reflecting moderate volatility levels over the period, suggesting a relatively stable market environment (See Figure 5). In December, the VIX trended lower, averaging 15.6, indicating greater stability.
Financials, Materials, and Industrials were the best-performing sectors, with returns of 3.07 percent, 2.22 percent, and 1.25 percent, respectively, demonstrating strength in cyclical areas. Conversely, Utilities, Real Estate, and Consumer Staples were the worst-performing sectors, declining 5.11 percent, 2.19 percent, and 1.59 percent, respectively.
The Russell 1000 Value Index returned 0.68 percent, outperforming the Russell 1000 Growth Index, which declined 0.62 percent for the month. This suggests a preference for value-oriented stocks during December. High Beta and Value factors outperformed, while Momentum and Leverage underperformed within equity factor returns, further reinforcing the market's inclination towards value and higher-risk assets.
[1] The Municipal/Treasury (M/T) ratio compares yields of municipal bonds with those of U.S. Treasury bonds of the same maturity. M/T ratios can show the relative value of municipal bonds compared with taxable bonds, by indicating when yields for municipal bonds exceed the after-tax yields on taxable bonds.
[2] As of December 31, 2025, as measured by the BBG U.S. Corporate Investment Grade Bond Index, an unmanaged market-value-weighted index of investment grade corporate fixed-rate debt issues with maturities of one year or more. You cannot invest directly in an index.
[3] The S&P 500 Index consists of 500 stocks chosen for market size, liquidity, and industry group representation. Itis a market-value-weighted index with each stock’s weight in the index proportionate to its market value. Performance is as of December 31, 2025. You cannot invest directly in an index.
[4] As of December 31, 2025, based on the Intercontinental Exchange (ICE) Bank of America/Merrill Lynch Option Volatility Estimate (MOVE) Index, which tracks the movement in U.S. Treasury yield volatility implied by current prices of one-month over-the-counter options on 2-year, 5-year, 10-year, and 30-year Treasuries. Historically, the index rises as concerns grow that interest rates may be higher. You cannot invest directly in an index.
[5] The Bloomberg U.S. Treasury Bond Index is an unmanaged index of prices of U.S. Treasury bonds with maturities of 1 to 30 years. You cannot invest directly in an index
[6] Municipal bond performance is as of December 31, 2025, as measured by the BBG Managed Money Short/Intermediate (1-10) Index, which measures the performance of the publicly traded municipal bonds that cover the USD-denominated short/intermediate term tax-exempt bond market, including state and local general obligation bonds, revenue bonds, insured bonds, and pre-refunded bonds. It is rules-based, and market-value weighted. You cannot invest directly in an index.
[7] The Bloomberg MBS Index tracks agency mortgage-backed pass-through securities (both fixed-rate and hybrid ARM) guaranteed by government-sponsored enterprises (GSEs) Government National Mortgage Association (Ginnie Mae) (GNMA), Federal National Mortgage Association (Fannie Mae) (FNMA), and Federal Home Loan Mortgage Corporation (Freddie Mac) (FHLMC). The index is constructed by grouping individual pools into aggregates or generics based on program, coupon, and vintage. You cannot invest directly in an index.
[8] The Bloomberg U.S. CMBS Investment Grade Index measures the market of U.S. Agency (GNMA, FNMA, and (FHLMC) and U.S. Non-Agency conduit and fusion CMBS deals with a minimum current deal size of $300mn. You cannot invest directly in an index.
[9] Bloomberg U.S. Asset-Backed Securities (ABS) Index is the ABS component of the Bloomberg U.S. Aggregate Bond Index, a flagship measure of the U.S. investment grade, fixed-rate bond market. The ABS index has three subsectors: credit and credit cards, autos, and utility. You cannot invest directly in an index.
[10] The Chicago Board Options Exchange (OEX) Volatility (VIX) Index is the ticker symbol and name for the Chicago Board Options Exchange's (CBOE) Volatility Index, a measure of the stock market's expectation of volatility based on S&P 500 index options. You cannot invest directly in an index.
BCAI-01092026-rxod4b9 (1/13/2026)
DISCLAIMERS:
This material provides general information and should not be construed as a solicitation or offer of services or products or as legal, tax or investment advice. Nothing contained herein should be considered a guide to security selection, asset allocation or portfolio construction.
All information and opinions are current as of the dates indicated and are subject to change. Breckinridge believes the data provided by unaffiliated third parties to be reliable but investors should conduct their own independent verification prior to use. Some economic and market conditions contained herein have been obtained from published sources and/or prepared by third parties, and in certain cases have not been updated through the date hereof.
There is no assurance that any estimate, target, projection or forward-looking statement (collectively, “estimates”) included in this material will be accurate or prove to be profitable; actual results may differ substantially. Breckinridge estimates are based on Breckinridge’s research, analysis and assumptions. Other events that were not considered in formulating such projections could occur and may significantly affect the outcome, returns or performance.
Not all securities or issuers mentioned represent holdings in client portfolios. Some securities have been provided for illustrative purposes only and should not be construed as investment recommendations. Any illustrative engagement or sustainability analysis examples are intended to demonstrate Breckinridge’s research and investment process.
Yields and other characteristics are metrics that can help investors in valuing a security, portfolio or composite. Yields do not represent performance results but they are one of several components that contribute to the return of a security, portfolio or composite. Yields and other characteristics are presented gross of advisory fees.
All investments involve risk, including loss of principal. No investment or risk management strategy, including diversification, can guarantee positive results or risk elimination in any market. Periods of elevated market volatility can significantly impact the value of securities. Investors should consult with their advisors to understand how these risks may affect their portfolios and to develop a strategy that aligns with their financial goals and risk tolerances.
Past performance is not indicative of future results. Breckinridge makes no assurances, warranties or representations that any strategies described herein will meet their investment objectives or incur any profits. Performance results for Breckinridge’s investment strategies include the reinvestment of interest and any other earnings, but do not reflect any brokerage or trading costs a client would have paid. Results may not reflect the impact that any material market or economic factors would have had on the accounts during the time period. Due to differences in client restrictions, objectives, cash flows, and other such factors, individual client account performance may differ substantially from the performance presented.
Actual client advisory fees may differ from the advisory fee used to calculate net performance results. Client returns will be reduced by the advisory fees and any other expenses incurred in the management of their accounts. For example, an advisory fee of 1 percent compounded over a 10-year period would reduce a 10 percent return to a 9 percent annual return. Additional information on fees can be found in Breckinridge’s Form ADV Part 2A.
Index results are shown for illustrative purposes and do not represent the performance of any specific investment. Indices are unmanaged and investors cannot directly invest in them. They do not reflect any management, custody, transaction or other expenses, and generally assume reinvestment of dividends, income and capital gains. Performance of indices may be more or less volatile than any investment strategy.
Fixed income investments have varying degrees of credit risk, interest rate risk, default risk, and prepayment and extension risk. In general, bond prices rise when interest rates fall and vice versa.
Equity investments are volatile and can decline significantly in response to investor reception of the issuer, market, economic, industry, political, regulatory or other conditions.
BLOOMBERG® is a trademark and service mark of Bloomberg Finance L.P. and its affiliates (collectively “Bloomberg”). Bloomberg does not approve or endorse this material or guarantees the accuracy or completeness of any information herein, or makes any warranty, express or implied, as to the results to be obtained therefrom and, to the maximum extent allowed by law, neither shall have any liability or responsibility for injury or damages arising in connection therewith.
The S&P500 Index (“Index”) and associated data is a product of S&P Dow Jones Indices LLC, its affiliates and/or their licensors and has been licensed for use by Breckinridge. © 2025 S&P Dow Jones Indices LLC, its affiliates and/or their licensors. All rights reserved. Redistribution or reproduction in whole or in part are prohibited without written permission of S&P Dow Jones Indices LLC. For more information on any of S&P Dow Jones Indices LLC’s indices please visit www.spdji.com. S&P® is a registered trademark of Standard & Poor’s Financial Services LLC (“SPFS”) and Dow Jones® is a registered trademark of Dow Jones Trademark Holdings LLC (“Dow Jones”). Neither S&P Dow Jones Indices LLC, SPFS, Dow Jones, their affiliates nor their licensors (“S&P DJI”) make any representation or warranty, express or implied, as to the ability of any index to accurately represent the asset class or market sector that it purports to represent and S&P DJI shall have no liability for any errors, omissions, or interruptions of any index or the data included therein.