Investing
Commentary published on September 10, 2025
August 2025 Market Commentary
Summary
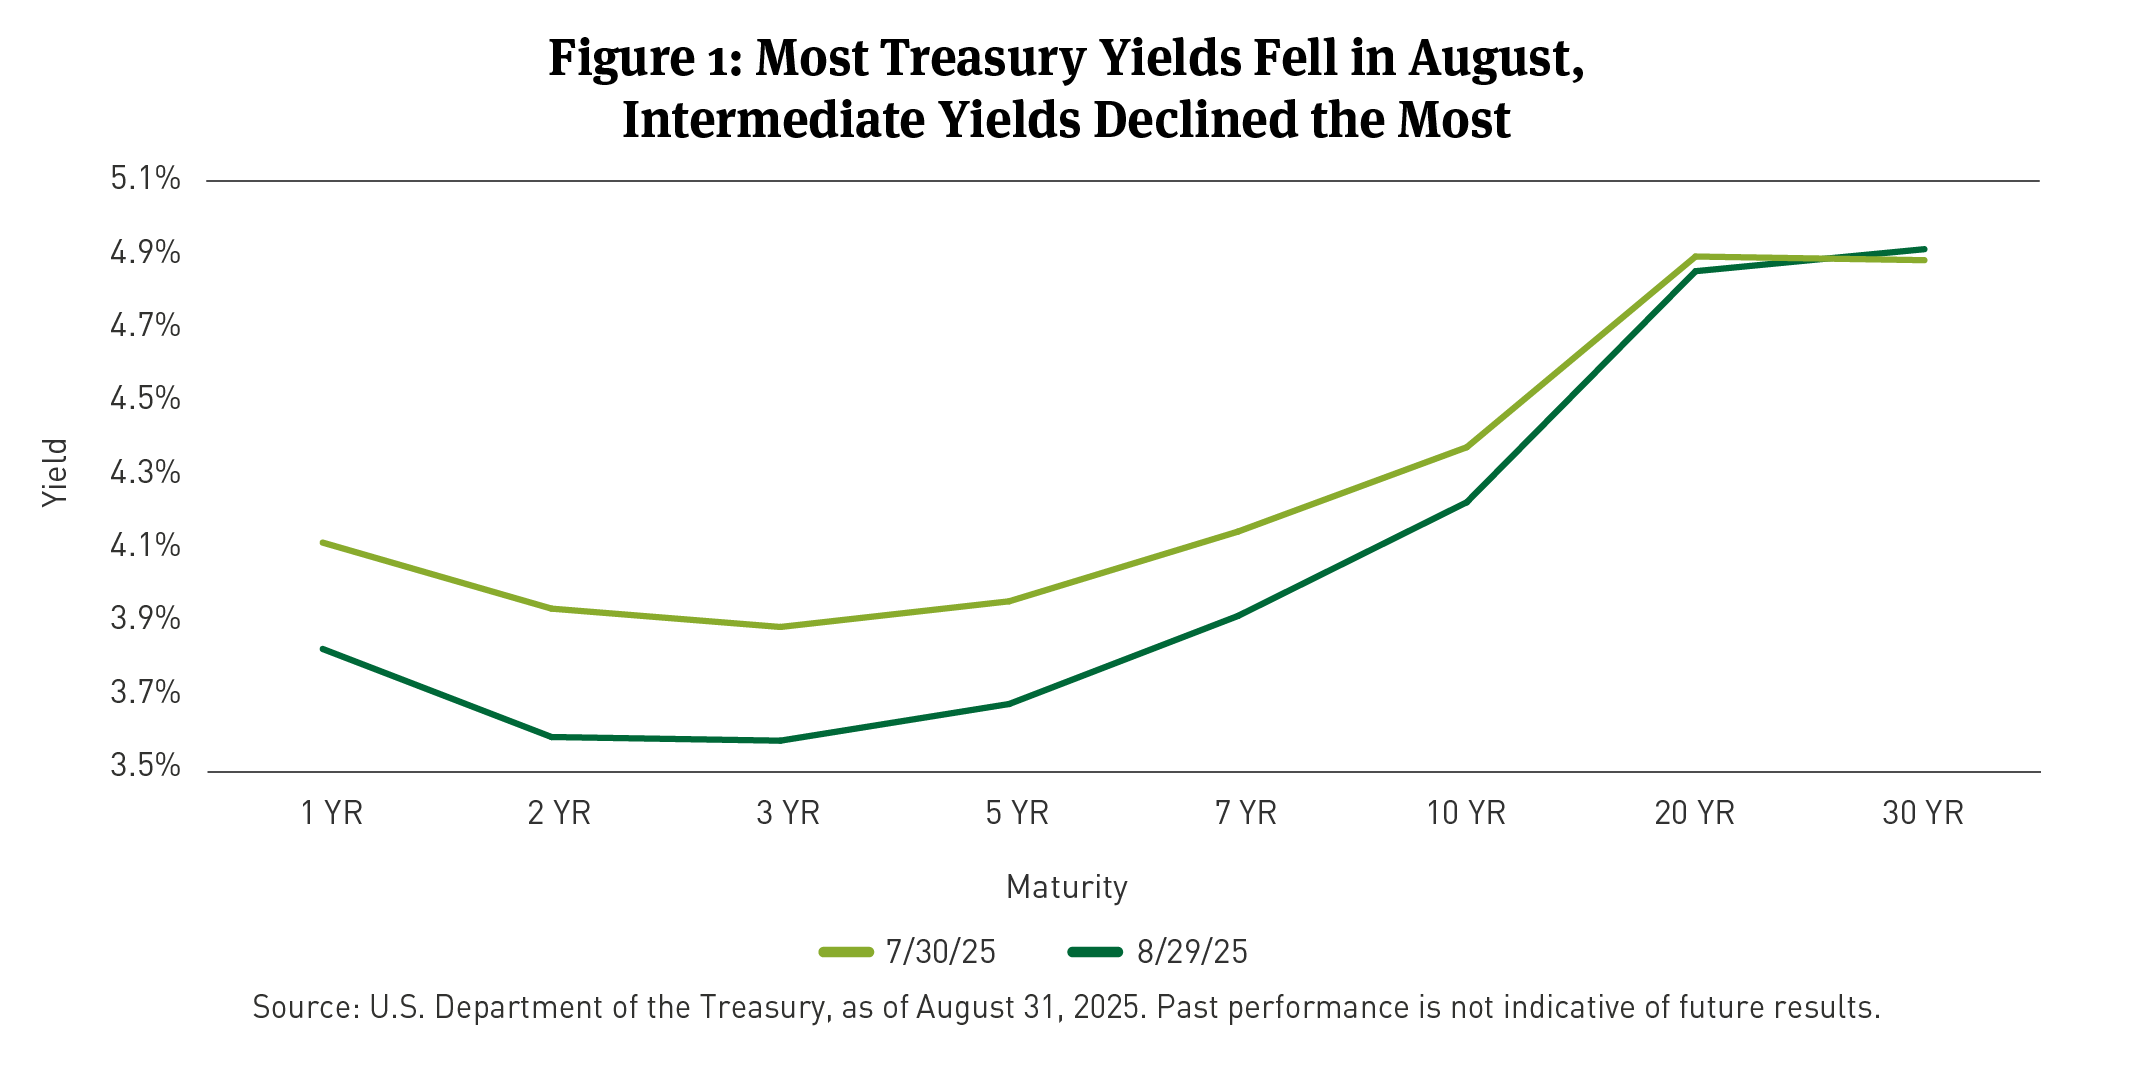
- U.S. Treasury Curve: Treasury yields fell, with the 2-year yield down 34 basis points (bps) and the 10-year yield down 15bps.
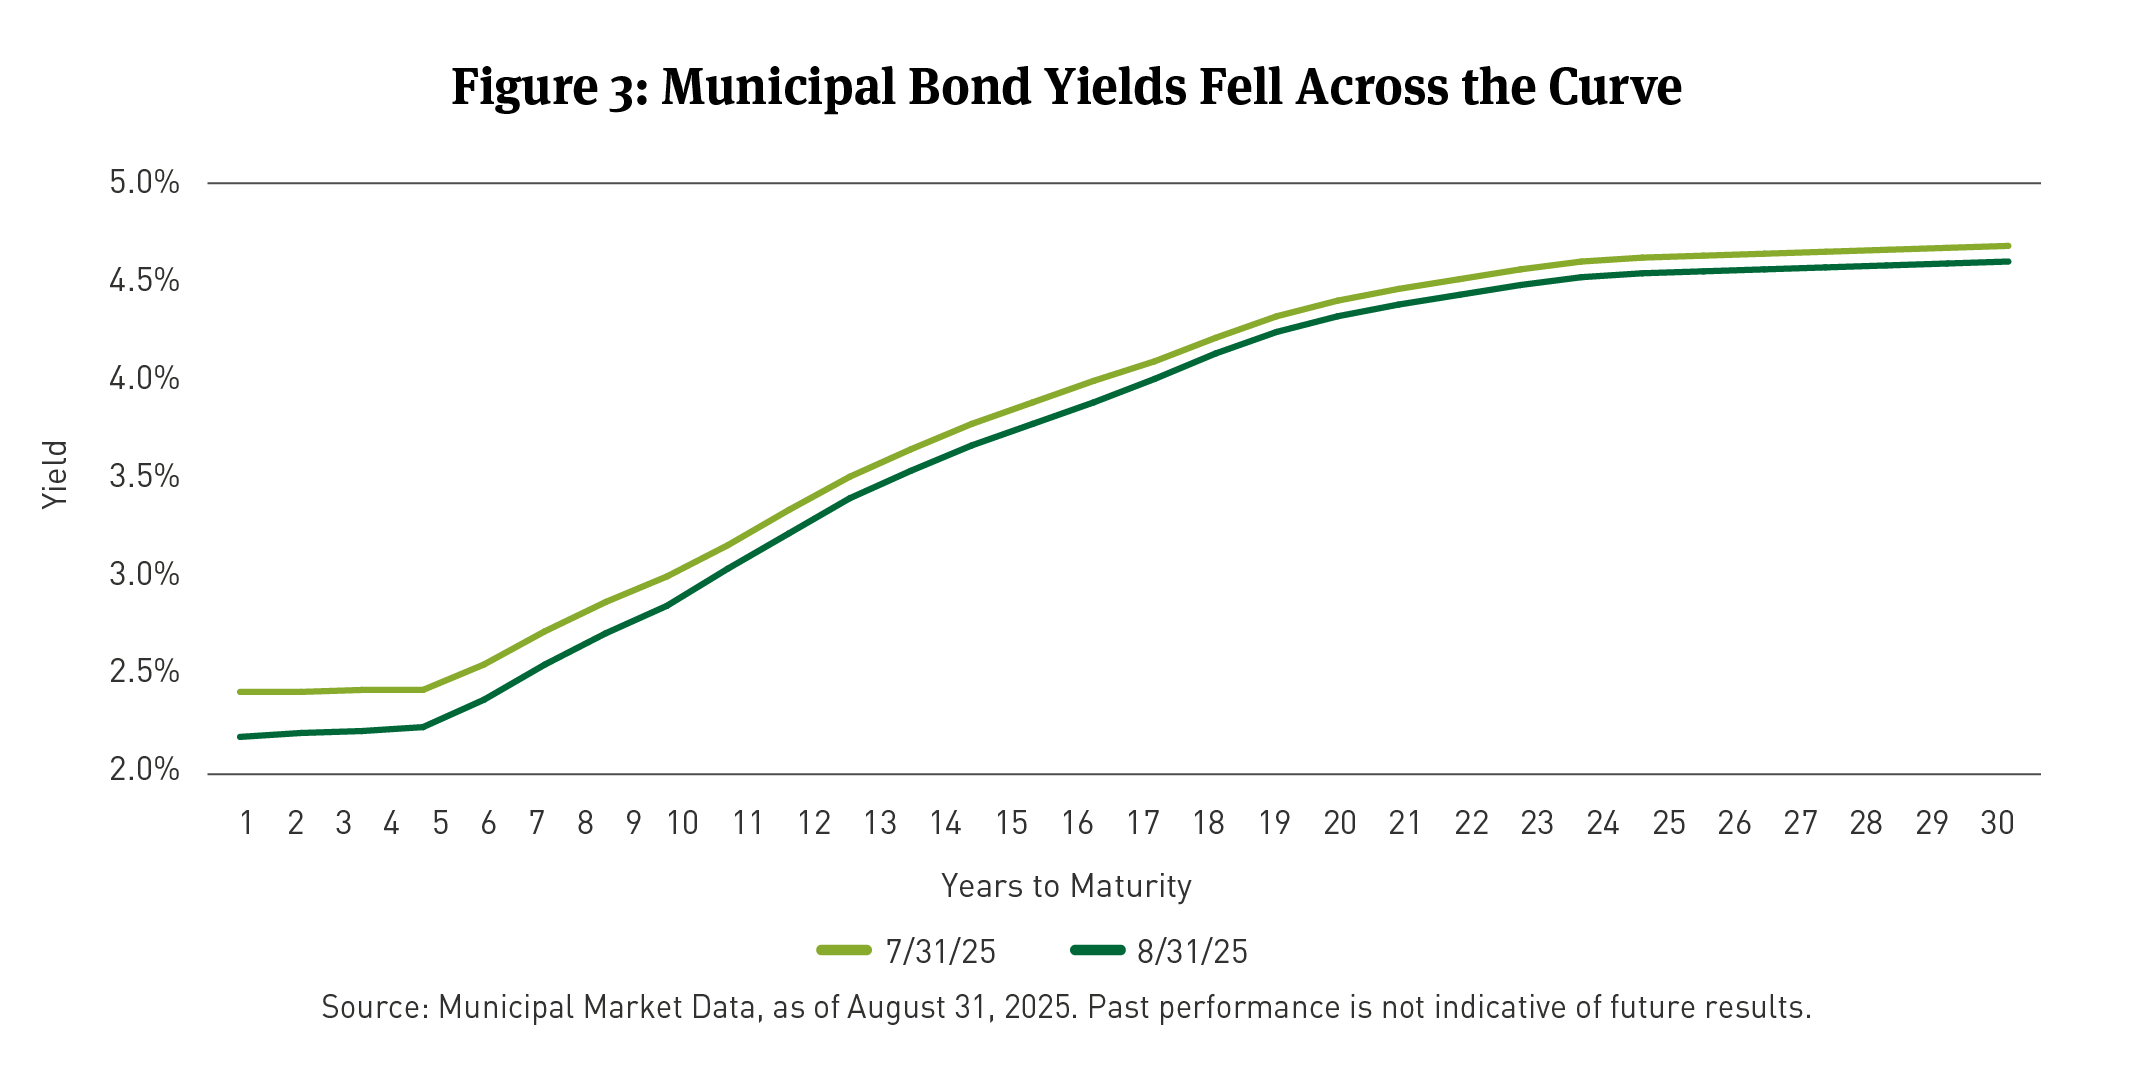
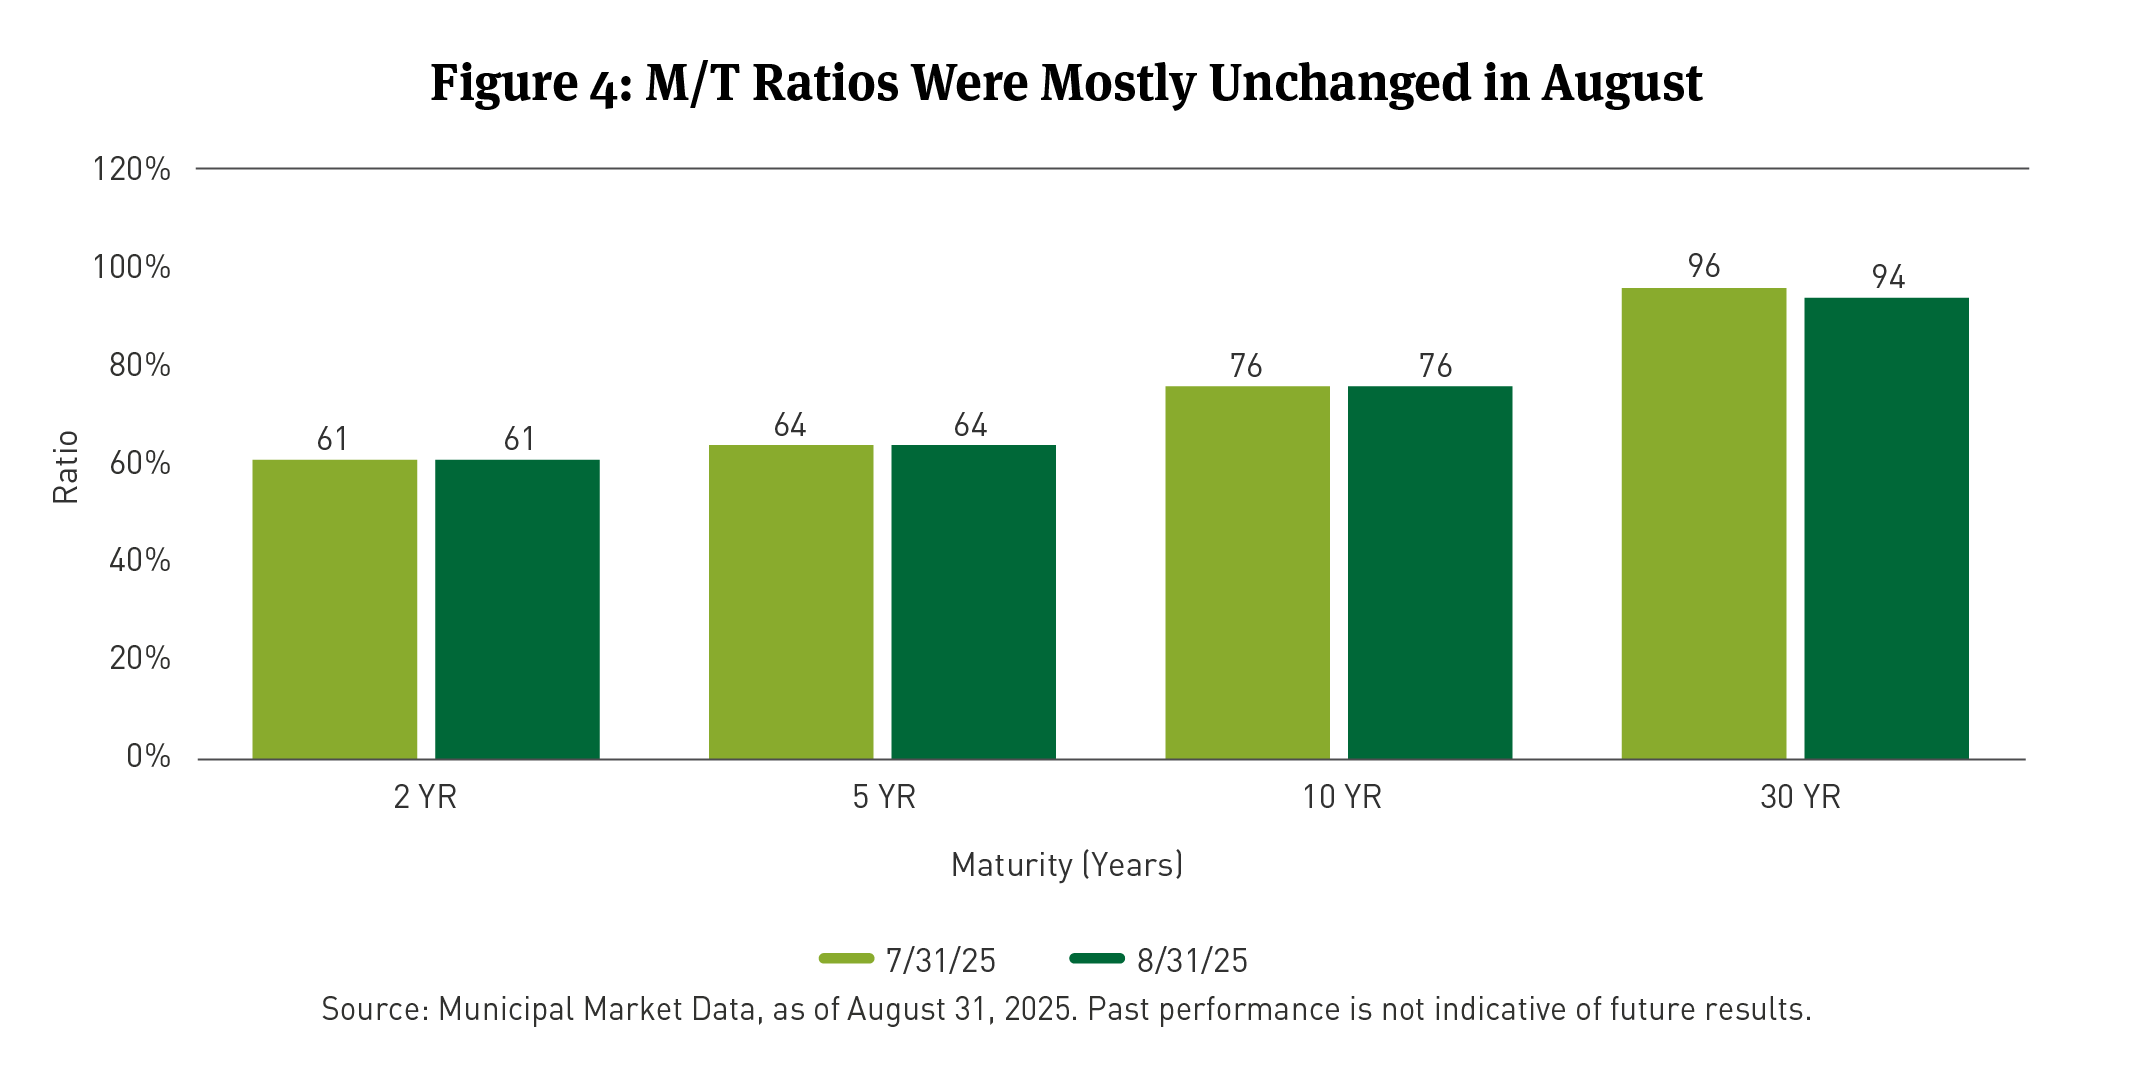
- Municipal Market Rates and Technicals: Municipal yields declined, with the 10-year yield down 7bps and Municipal/Treasury ratios [1] (M/T ratios) holding steady.
- Corporate Market Technicals: The option-adjusted spread (OAS) for the Bloomberg (BBG) Corporate Investment Grade Index [2] widened by 3bps, while corporate issuance was about $119 billion.
- Securitized Trends: Mortgage-backed securities (MBS) returns were strong at 1.61 percent, while Asset-backed securities (ABS) returns were favorable, with Auto Loans at 0.90 percent.
- Equity Market Trends: The S&P 500 Index gained 1.9 percent in August, led by strong performance in Health Care and Materials sectors.
The following commentary is a summary of discussions among members of the Breckinridge Capital Advisors Investment Committee as they reviewed monthly activity in the markets and investment returns. The members of the Investment Committee, under the leadership of Co-Chief Investment Officers Matthew Buscone and Jeffrey Glenn, CFA, are Co-Heads of Research, Nicholas Elfner and Adam Stern, J.D., M.P.A.; and Portfolio Manager and Director, Corporate Research, Josh Perez, CFA.
MARKET REVIEW
In August 2025, the financial markets were marked by a mix of economic resilience and shifting policy expectations. The Jackson Hole Economic Symposium revealed a potential pivot in Federal Reserve (Fed) policy, with Chairman Jerome Powell hinting at a possible easing cycle. This dovish signal, combined with solid quarterly earnings results, powered the S&P 500 to several record highs during the month. Investment grade (IG) bond spreads widened by 3bps.
The Fed’s more dovish policy outlook reflected concerns about slowing job creation and its potential impact on economic growth. Core Personal Consumption Expenditures (PCE) inflation for July came in at 2.9 percent year-over-year, remaining above the Fed's 2 percent target. However, the recent deceleration in job creation, with July payrolls adding only 73,000 jobs, is likely to influence the Fed's decision making. The Breckinridge Investment Committee expects the Fed to cut interest rates twice this year, aligning with the more accommodative rhetoric from Fed officials.
Treasury yields experienced noteworthy declines in August, with the 2-year, 5-year, and 10-year yields falling by 34, 28, and 15bps, respectively (See Figure 1). The 30-year yield, however, saw a slight increase of 3bps. The Bloomberg U.S. Treasury Index3 recorded a total return of 1.06 percent for the month.
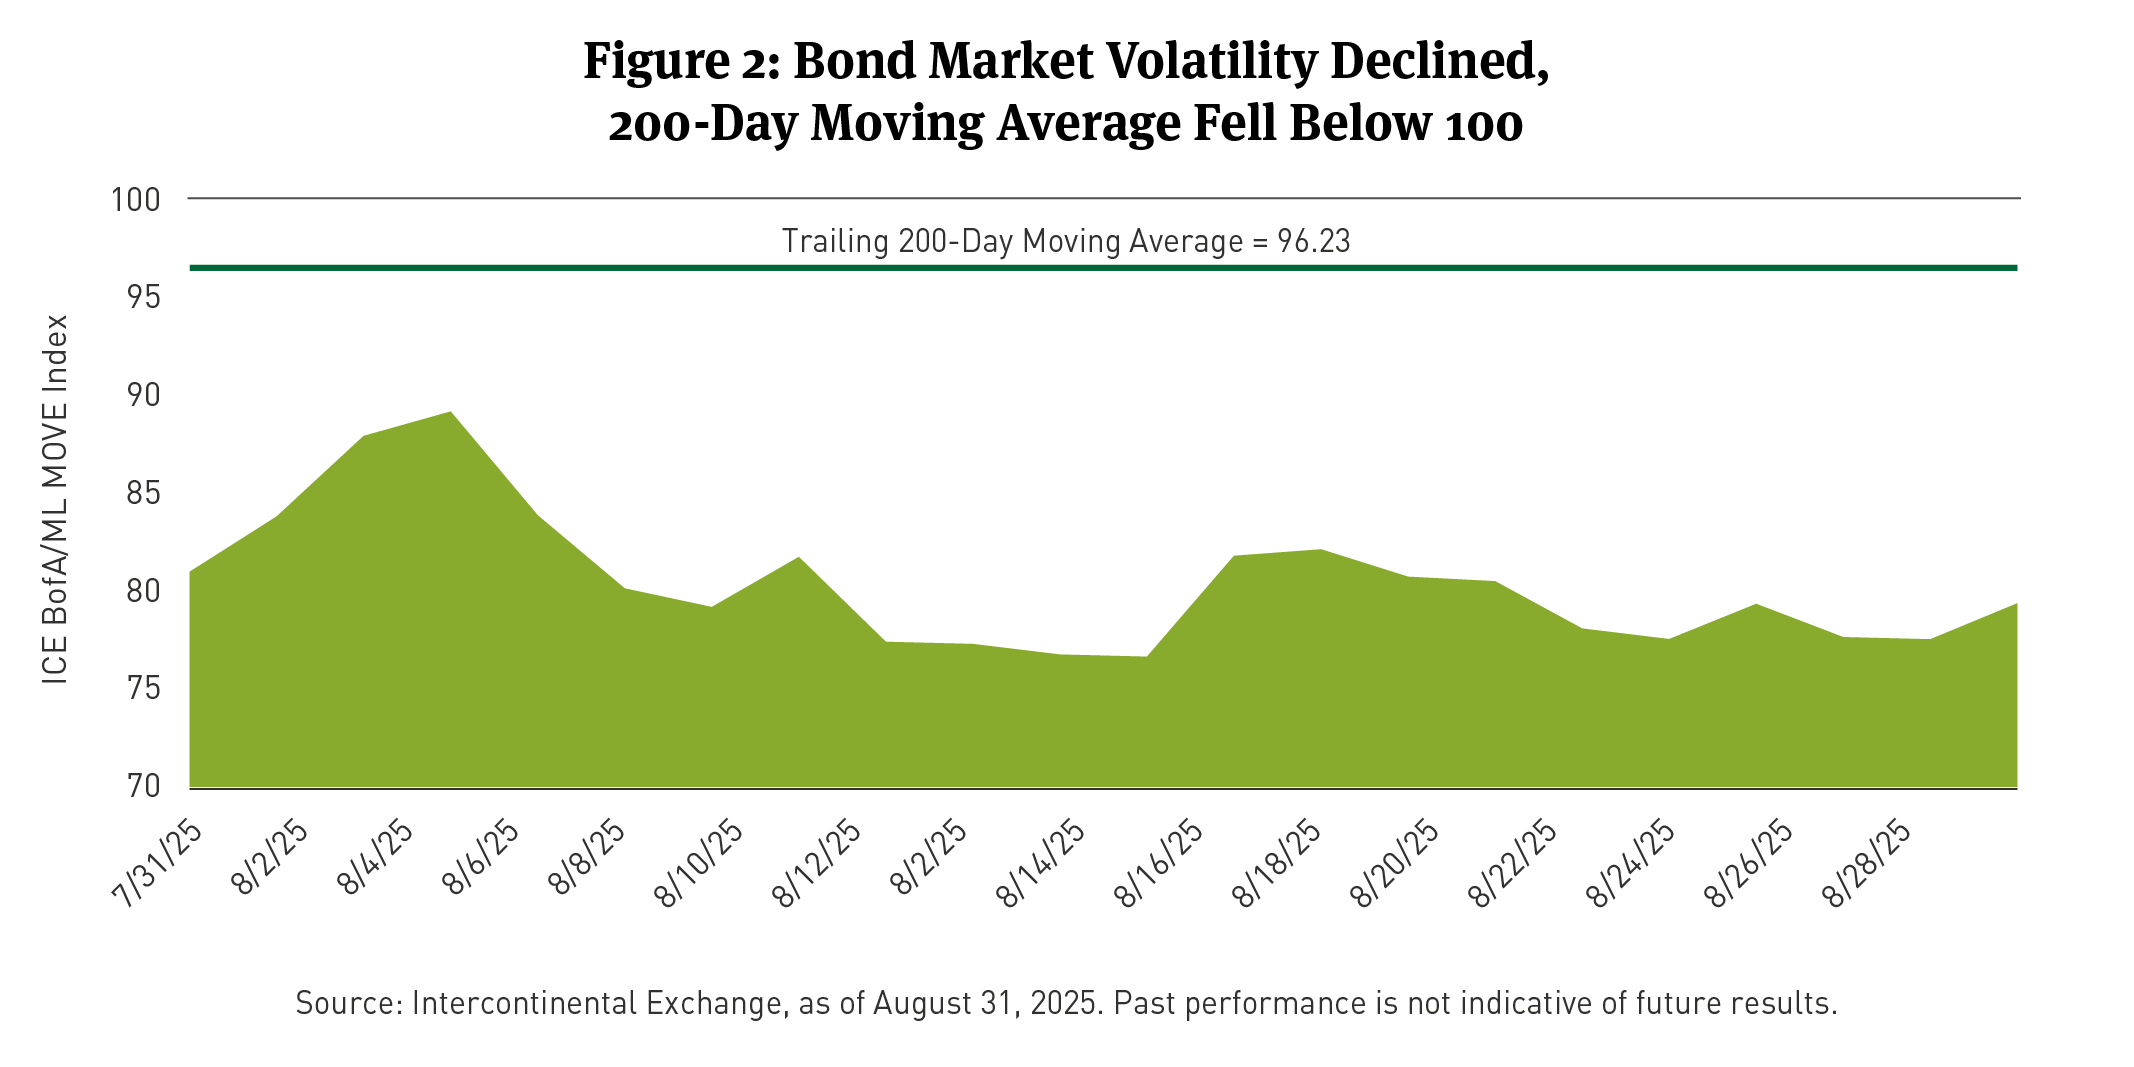
Bond market volatility, as measured by the Intercontinental Exchange Bank of America/Merrill Lynch MOVE Index, remained relatively stable, reflecting a cautious market environment (See Figure 2).
The Investment Committee's outlook for the second half of 2025 is for a slowdown in labor markets, sticky inflation measures, and moderating economic growth. The committee remains concerned about the risk of permanent tariffs on large trading partners, which could negatively impact growth, consumer spending, and price levels. Given this outlook, portfolio positioning is defensive with still tight valuations in most spread sectors, partially mitigated by attractive yields that continue to bring fund flows into the IG market.
MUNICIPAL MARKET REVIEW
In August 2025, the municipal bond market experienced a relatively stable month, with supply and demand dynamics remaining balanced. According to London Stock Exchange Group (LSEG) data, total municipal bond issuance for August 2025 was about $52 billion, a slight decrease from $53 billion in July 2025 and $55 billion in August 2024.
The Bloomberg Short/Intermediate Municipal Bond Index (the Index), which tracks the performance of municipal bonds with maturities between 1 and 10 years, returned 0.85 percent in August 2025. This performance was driven by a combination of stable yields and positive fund flows. The Index's total return was slightly lower than the U.S. Treasury Index, which returned 1.06 percent.
Municipal yields declined across the curve, with the 10-year yield down 7bps, while M/T ratios held steady (See Figures 3 and 4). The steeper curve has begun to translate into better returns for longer duration municipal bonds. The pace of net new-issue supply could influence performance moving into the fourth quarter, with the potential for a slowdown in supply into year-end helping performance.
CORPORATE MARKET REVIEW
The U.S. Corporate Index OAS widened by 3bps in August. This movement reflects a slight increase in credit spreads for IG corporate bonds.
On a total return basis for August, the Corporate Bond Index returned 1.01 percent, with an excess return of negative 0.08 percent, trailing the return for Treasuries with similar maturities. This indicates that corporate bonds underperformed by a small margin during the month.
Per BBG, the best-performing sectors in August were Sovereigns, Office REITS, Oil Field Services, Other REITs, Finance Companies, Health Insurance, and Refining. Conversely, the worst-performing sectors were Wirelines, Railroads, Wireless, Food and Beverage P&C Insurance and Pharmaceuticals.
Total fixed-rate gross IG corporate supply was $119 billion in August. After $76.3 billion in redemptions, net supply was $42.6 billion, BBG reported.
In August, a net total of approximately $56.23 billion flowed into corporate mutual and exchange-traded funds (ETFs). This inflow suggests strong investor demand for corporate bonds during the month.
SECURITIZED MARKET REVIEW
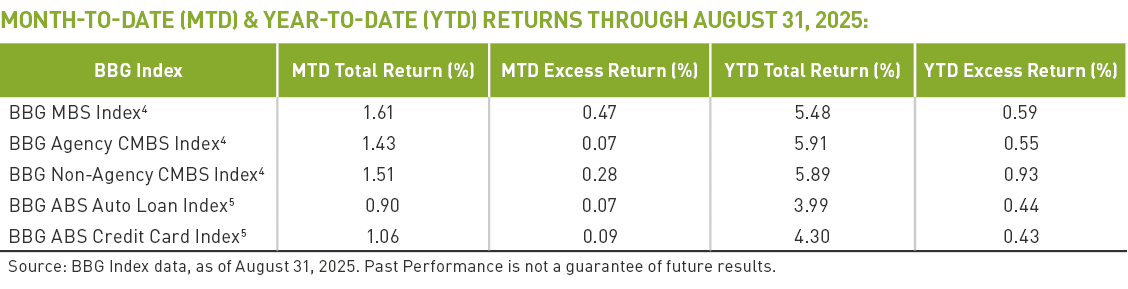
During August, the mortgage-backed securities (MBS) sector generated a total return of 1.61 percent and an excess return of 0.47 percent. The sector's performance was driven by spreads that tightened by 5bps. Lower-coupon MBS outperformed higher-coupon MBS, as rates rallied.
In the asset-backed securities (ABS) market, the Auto Loans subsector returned 0.90 percent with an excess return of 0.07 percent, while the Credit Card Loans subsector returned 1.60 percent with an excess return of 0.09 percent. The ABS market experienced a quiet month with muted supply and generally unchanged spreads. Issuance is expected to pick up later in the month.
The performance of the MBS and ABS sectors was influenced by several factors. In the MBS market, declining rate volatility, as measured by the MOVE Index, provided a tailwind. Additionally, headlines about potential privatization of mortgage-related government sponsored entities (GSEs) resurfaced but did not significantly impact spreads. In the ABS market, stable spreads across subsectors characterized the quiet month, with no significant movements reported.
EQUITY MARKET REVIEW
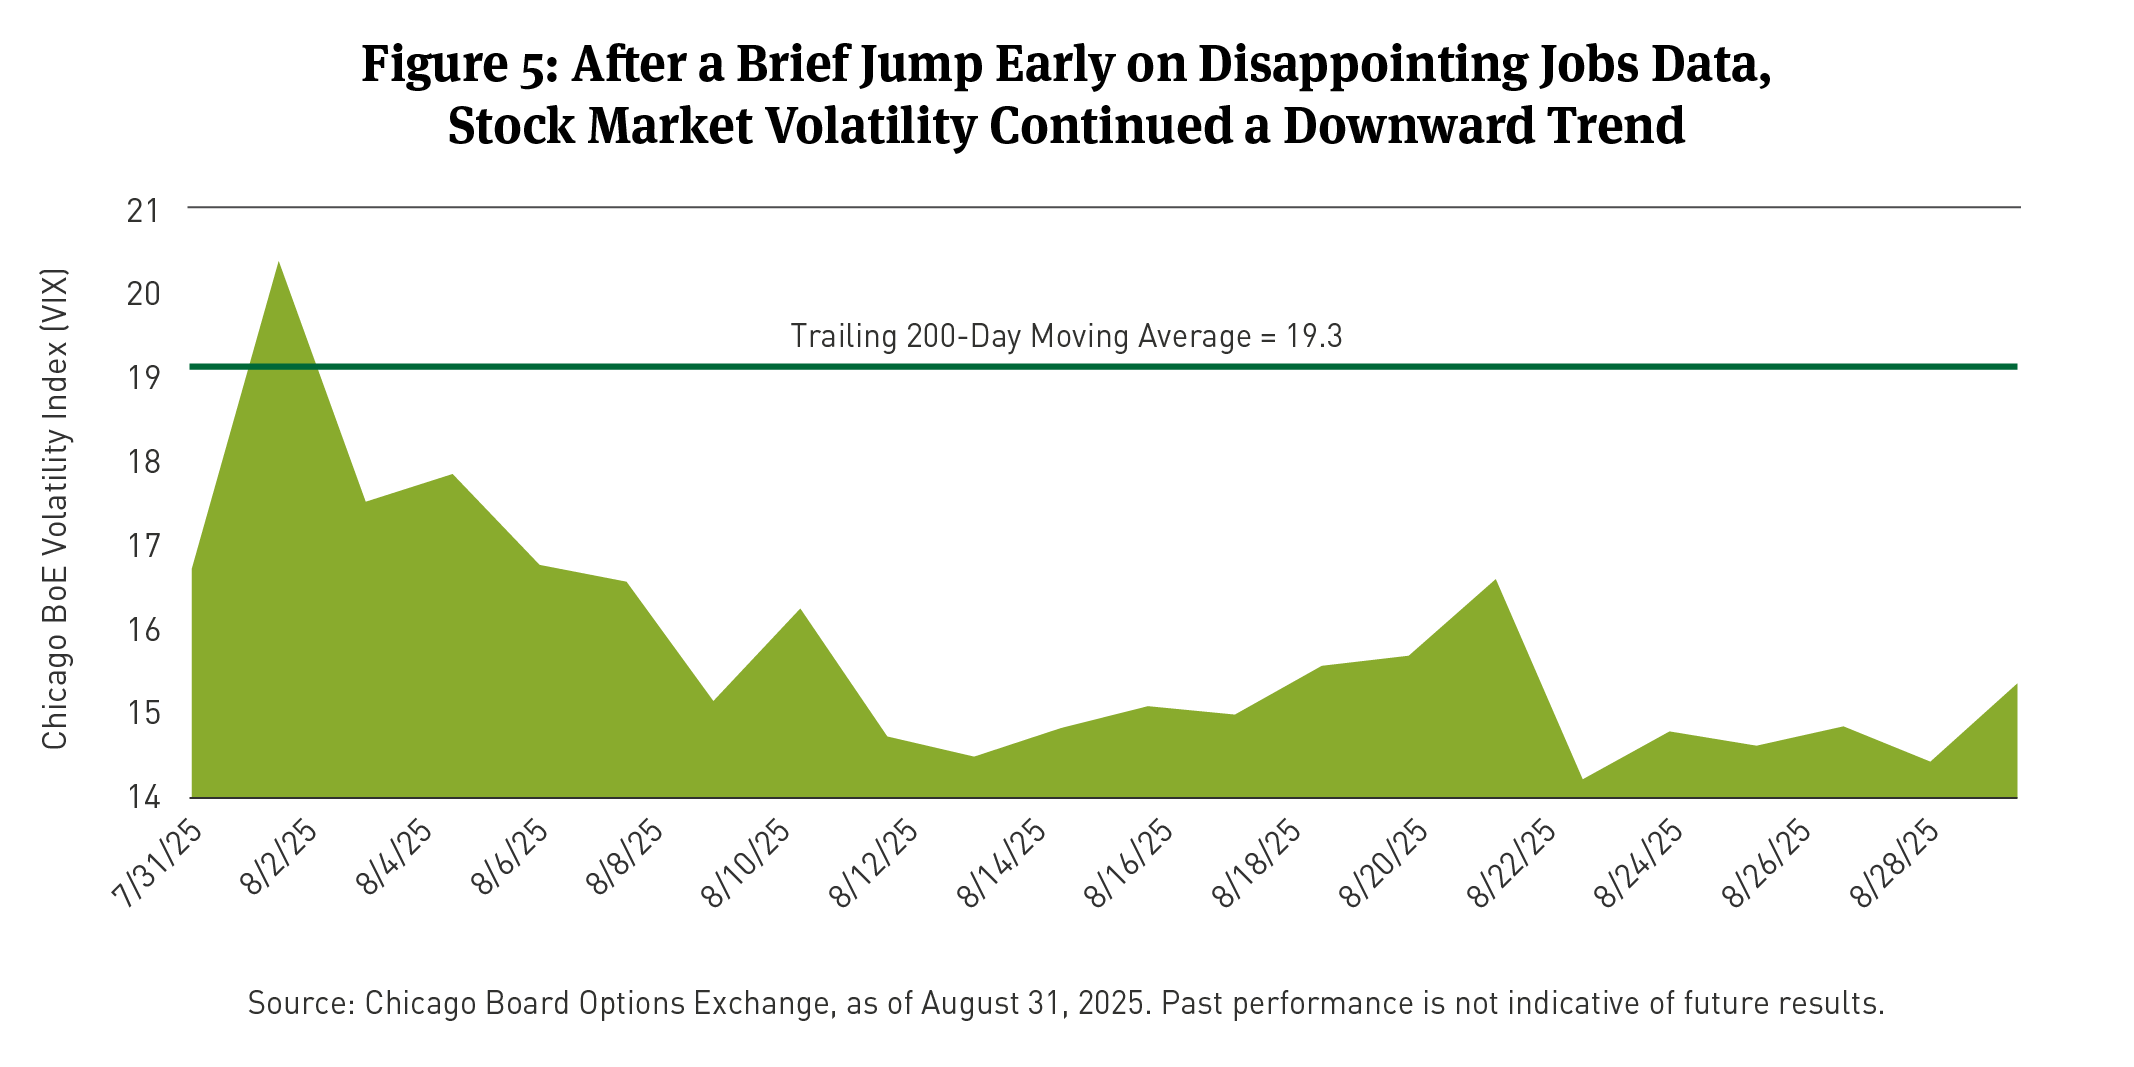
The S&P 500 Index returned 2.03 percent in August 2025, marking a positive month for U.S. equities. The VIX Index, a measure of market volatility, experienced a decline, ending the month below the 200-day moving average, indicating a reduction in market uncertainty and investor anxiety (See Figure 5).
At a sector level, the performance was mixed. The best-performing sectors were Materials, which gained 5.8 percent, and Health Care, which rose 5.4 percent. These sectors were followed by Energy, Communication Services, Consumer Discretionary, Financials, and Real Estate, all of which posted positive returns. Conversely, the worst performing sectors were Utilities, which fell 1.6 percent, Industrials, which gained 0.01 percent, Information Technology, which gained only 0.3 percent, and consumer staples, which saw a 1.6 percent increase.
The Russell 1000 Value Index6 outperformed the Russell 1000 Growth Index7 in August, returning 3.2 percent compared to 1.1 percent for the Russell 1000 Growth Index. This performance aligns with a broader market trend of value outperforming growth in August, a shift from the year-to-date outperformance of growth. During August, equity factors that turned in the best performance included Value (up 7.8 percent) and Dividend Yield (up 4.3 percent), while Momentum, Quality, Size, Growth and Low Volatility factors yielded negative results.
[1] The Municipal/Treasury (M/T) ratio compare yields of municipals bonds with those of U.S. Treasury bonds of the same maturity. M/T ratios can show the relative value of municipal bonds compared with taxable bonds, by indicating when yields for municipal bonds exceed the after-tax yields on taxable bonds. M/T ratio data is per Municipal Market Data, as of August 31, 2025.
[2] IG Corporate bond performance as of August 31, 2025, is as measured by the BBG U.S. Corporate Investment Grade Bond Index, an unmanaged market-value-weighted index of investment grade corporate fixed-rate debt issues with maturities of one year or more. You cannot invest directly in an index.
[3] The Bloomberg U.S. Treasury Bond Index is an unmanaged index of prices of U.S. Treasury bonds with maturities of 1 to 30 years. You cannot invest directly in an index. You cannot invest directly in an index.
[4] The Bloomberg MBS Index tracks agency mortgage-backed pass-through securities (both fixed-rate and hybrid ARM) guaranteed by government-sponsored enterprises (GSEs) Government National Mortgage Association (Ginnie Mae) (GNMA), Federal National Mortgage Association (Fannie Mae) (FNMA), and Federal Home Loan Mortgage Corporation (Freddie Mac) (FHLMC). The index is constructed by grouping individual pools into aggregates or generics based on program, coupon, and vintage. You cannot invest directly in an index.
[5] Bloomberg U.S. Asset-Backed Securities (ABS) Index is the ABS component of the Bloomberg U.S. Aggregate Bond Index, a flagship measure of the U.S. investment grade, fixed-rate bond market. The ABS index has three subsectors: credit and credit cards, autos, and utility. You cannot invest directly in an index.
[6] The Russell 1000® Value Index is an unmanaged market capitalization-weighted index of value-oriented stocks of U.S. domiciled companies that are included in the Russell 1000 Index. Value-oriented stocks tend to have lower price-to-book ratios and lower forecasted growth values. You cannot invest directly in an index.
[7] The Russell 1000® Growth Index is an unmanaged market capitalization-weighted index of growth-oriented stocks of U.S. domiciled companies that are included in the Russell 1000 Index. Growth-oriented stocks tend to have higher price-to-book ratios and higher forecasted growth values. You cannot invest directly in an index.
BCAI- 09092025-btaqb89a (9/9/2025)
DISCLAIMERS:
This material provides general information and should not be construed as a solicitation or offer of services or products or as legal, tax or investment advice. Nothing contained herein should be considered a guide to security selection, asset allocation or portfolio construction.
All information and opinions are current as of the dates indicated and are subject to change. Breckinridge believes the data provided by unaffiliated third parties to be reliable but investors should conduct their own independent verification prior to use. Some economic and market conditions contained herein have been obtained from published sources and/or prepared by third parties, and in certain cases have not been updated through the date hereof.
There is no assurance that any estimate, target, projection or forward-looking statement (collectively, “estimates”) included in this material will be accurate or prove to be profitable; actual results may differ substantially. Breckinridge estimates are based on Breckinridge’s research, analysis and assumptions. Other events that were not considered in formulating such projections could occur and may significantly affect the outcome, returns or performance.
Not all securities or issuers mentioned represent holdings in client portfolios. Some securities have been provided for illustrative purposes only and should not be construed as investment recommendations. Any illustrative engagement or sustainability analysis examples are intended to demonstrate Breckinridge’s research and investment process.
Yields and other characteristics are metrics that can help investors in valuing a security, portfolio or composite. Yields do not represent performance results but they are one of several components that contribute to the return of a security, portfolio or composite. Yields and other characteristics are presented gross of advisory fees.
All investments involve risk, including loss of principal. No investment or risk management strategy, including diversification, can guarantee positive results or risk elimination in any market. Periods of elevated market volatility can significantly impact the value of securities. Investors should consult with their advisors to understand how these risks may affect their portfolios and to develop a strategy that aligns with their financial goals and risk tolerances.
Past performance is not indicative of future results. Breckinridge makes no assurances, warranties or representations that any strategies described herein will meet their investment objectives or incur any profits. Performance results for Breckinridge’s investment strategies include the reinvestment of interest and any other earnings, but do not reflect any brokerage or trading costs a client would have paid. Results may not reflect the impact that any material market or economic factors would have had on the accounts during the time period. Due to differences in client restrictions, objectives, cash flows, and other such factors, individual client account performance may differ substantially from the performance presented.
Actual client advisory fees may differ from the advisory fee used to calculate net performance results. Client returns will be reduced by the advisory fees and any other expenses incurred in the management of their accounts. For example, an advisory fee of 1 percent compounded over a 10-year period would reduce a 10 percent return to a 9 percent annual return. Additional information on fees can be found in Breckinridge’s Form ADV Part 2A.
Index results are shown for illustrative purposes and do not represent the performance of any specific investment. Indices are unmanaged and investors cannot directly invest in them. They do not reflect any management, custody, transaction or other expenses, and generally assume reinvestment of dividends, income and capital gains. Performance of indices may be more or less volatile than any investment strategy.
Fixed income investments have varying degrees of credit risk, interest rate risk, default risk, and prepayment and extension risk. In general, bond prices rise when interest rates fall and vice versa.
Equity investments are volatile and can decline significantly in response to investor reception of the issuer, market, economic, industry, political, regulatory or other conditions.
BLOOMBERG® is a trademark and service mark of Bloomberg Finance L.P. and its affiliates (collectively “Bloomberg”). Bloomberg does not approve or endorse this material or guarantees the accuracy or completeness of any information herein, or makes any warranty, express or implied, as to the results to be obtained therefrom and, to the maximum extent allowed by law, neither shall have any liability or responsibility for injury or damages arising in connection therewith.
The S&P500 Index (“Index”) and associated data is a product of S&P Dow Jones Indices LLC, its affiliates and/or their licensors and has been licensed for use by Breckinridge. © 2025 S&P Dow Jones Indices LLC, its affiliates and/or their licensors. All rights reserved. Redistribution or reproduction in whole or in part are prohibited without written permission of S&P Dow Jones Indices LLC. For more information on any of S&P Dow Jones Indices LLC’s indices please visit www.spdji.com. S&P® is a registered trademark of Standard & Poor’s Financial Services LLC (“SPFS”) and Dow Jones® is a registered trademark of Dow Jones Trademark Holdings LLC (“Dow Jones”). Neither S&P Dow Jones Indices LLC, SPFS, Dow Jones, their affiliates nor their licensors (“S&P DJI”) make any representation or warranty, express or implied, as to the ability of any index to accurately represent the asset class or market sector that it purports to represent and S&P DJI shall have no liability for any errors, omissions, or interruptions of any index or the data included therein.