Municipal
Perspective published on January 6, 2026
2026 Municipal Market Outlook
Summary
- The municipal market enters 2026 with strong but fading credit quality.
- The technical backdrop is stable.
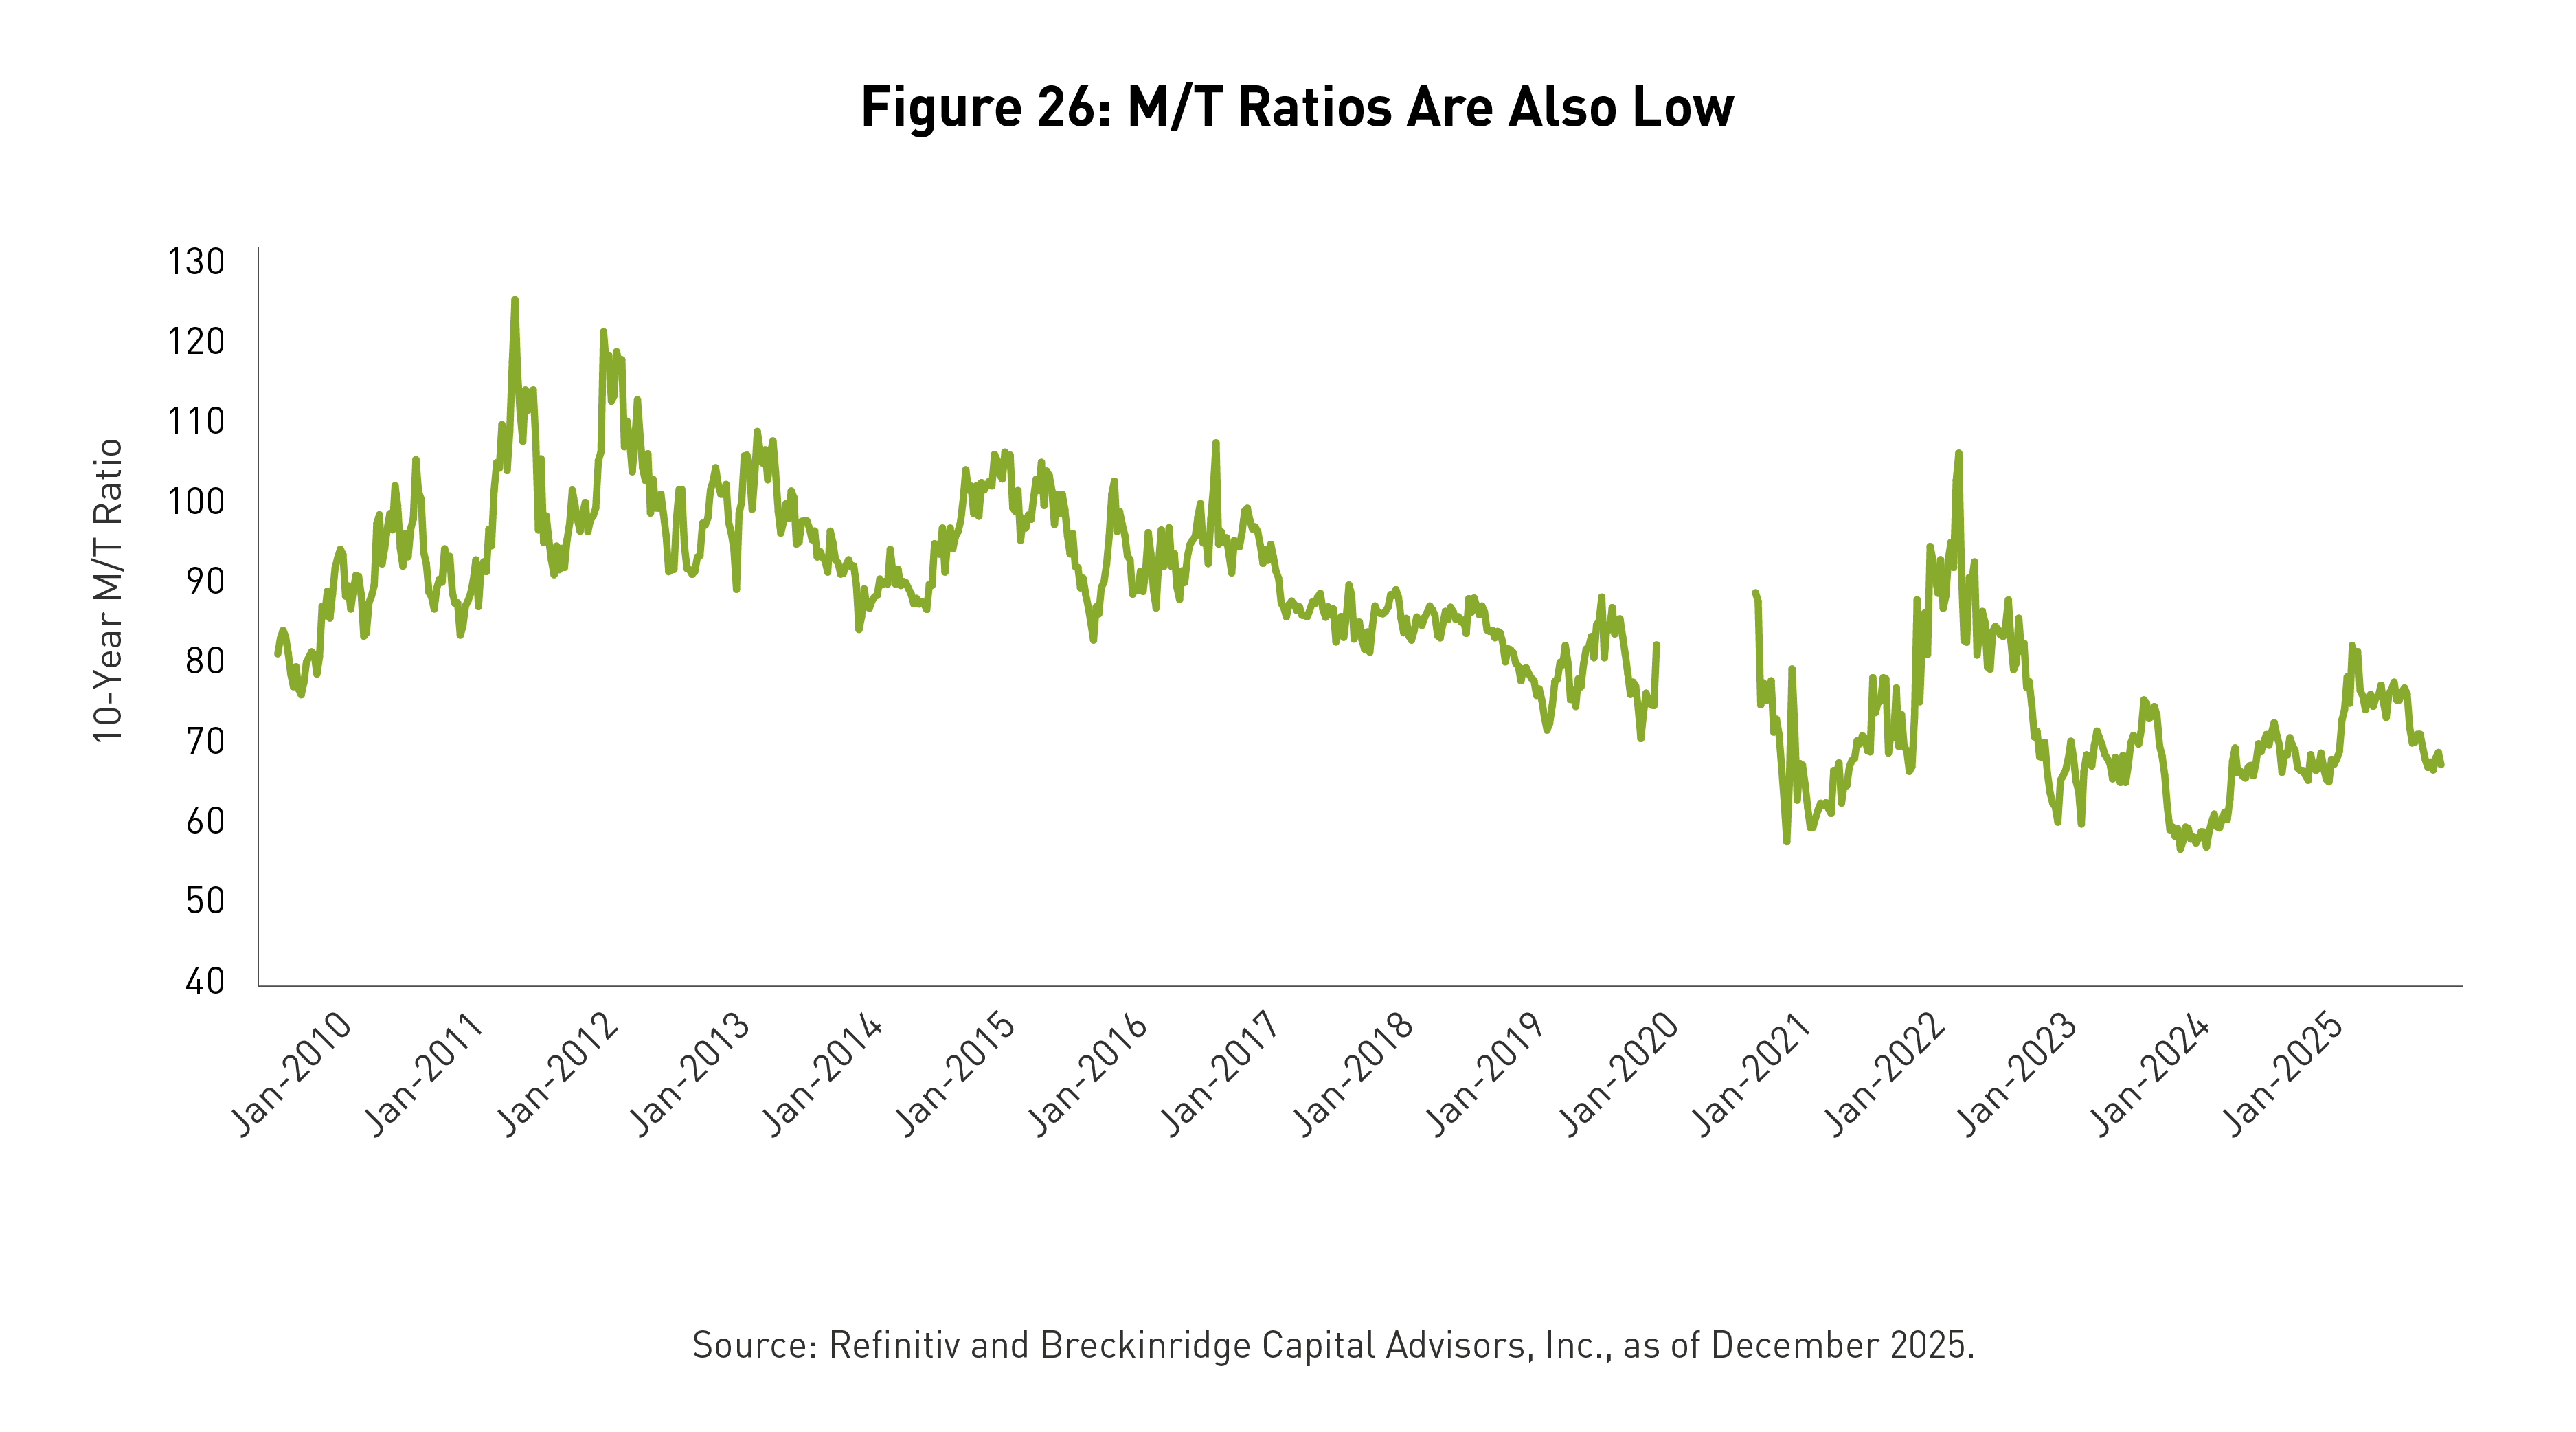
- Municipal spreads and Municipal/Treasury (M/T) ratios [1] are at the lower end of their post-2021 range.
- In 2026, we anticipate greater differentiation in credit spreads and favor a neutral approach to duration given mixed economic data and Federal Reserve’s dissonant communications on the path for interest rates.
Fundamentals:
- State credit quality is generally good. Debt and pension risks are manageable. The transportation and utility sectors look stable. Default rates are low, and credit ratings remain high.
- But a potential ratings peak is possible given: a weakening K-12 public school district sector, ongoing pressures in the hospital and higher education sectors, fiscally stressed mass transit systems, climate-related challenges, growing unwillingness by voters to support tax and utility rate increases, and the potential for a stock market correction.
- Federal policy developments remain, on balance, negative for credit.
Technicals:
- Demand is likely to remain reasonably strong given retail investors’ need to rebalance portfolios, better small lot liquidity, aging demographics in the U.S., and investors’ growing preference for separately managed accounts (SMAs).
- Growth in supply is likely to moderate, as federal retrenchment in healthcare, K-12 public school, and mass transit causes issuers to reevaluate some projects.
Valuations:
- There is potential for wider credit spreads and more volatility in 2026.
- Essential service revenue bonds may provide slightly better value compared to local obligations given the potential for weaker federal support and growing concerns over rising local property tax burdens, in some places.
- M/T ratios are at the lower end of fair value in the 5- to 10-year range and may be more volatile given the Fed’s mixed interest rate stance. Elevated new issue supply could push ratios higher at points during the year.
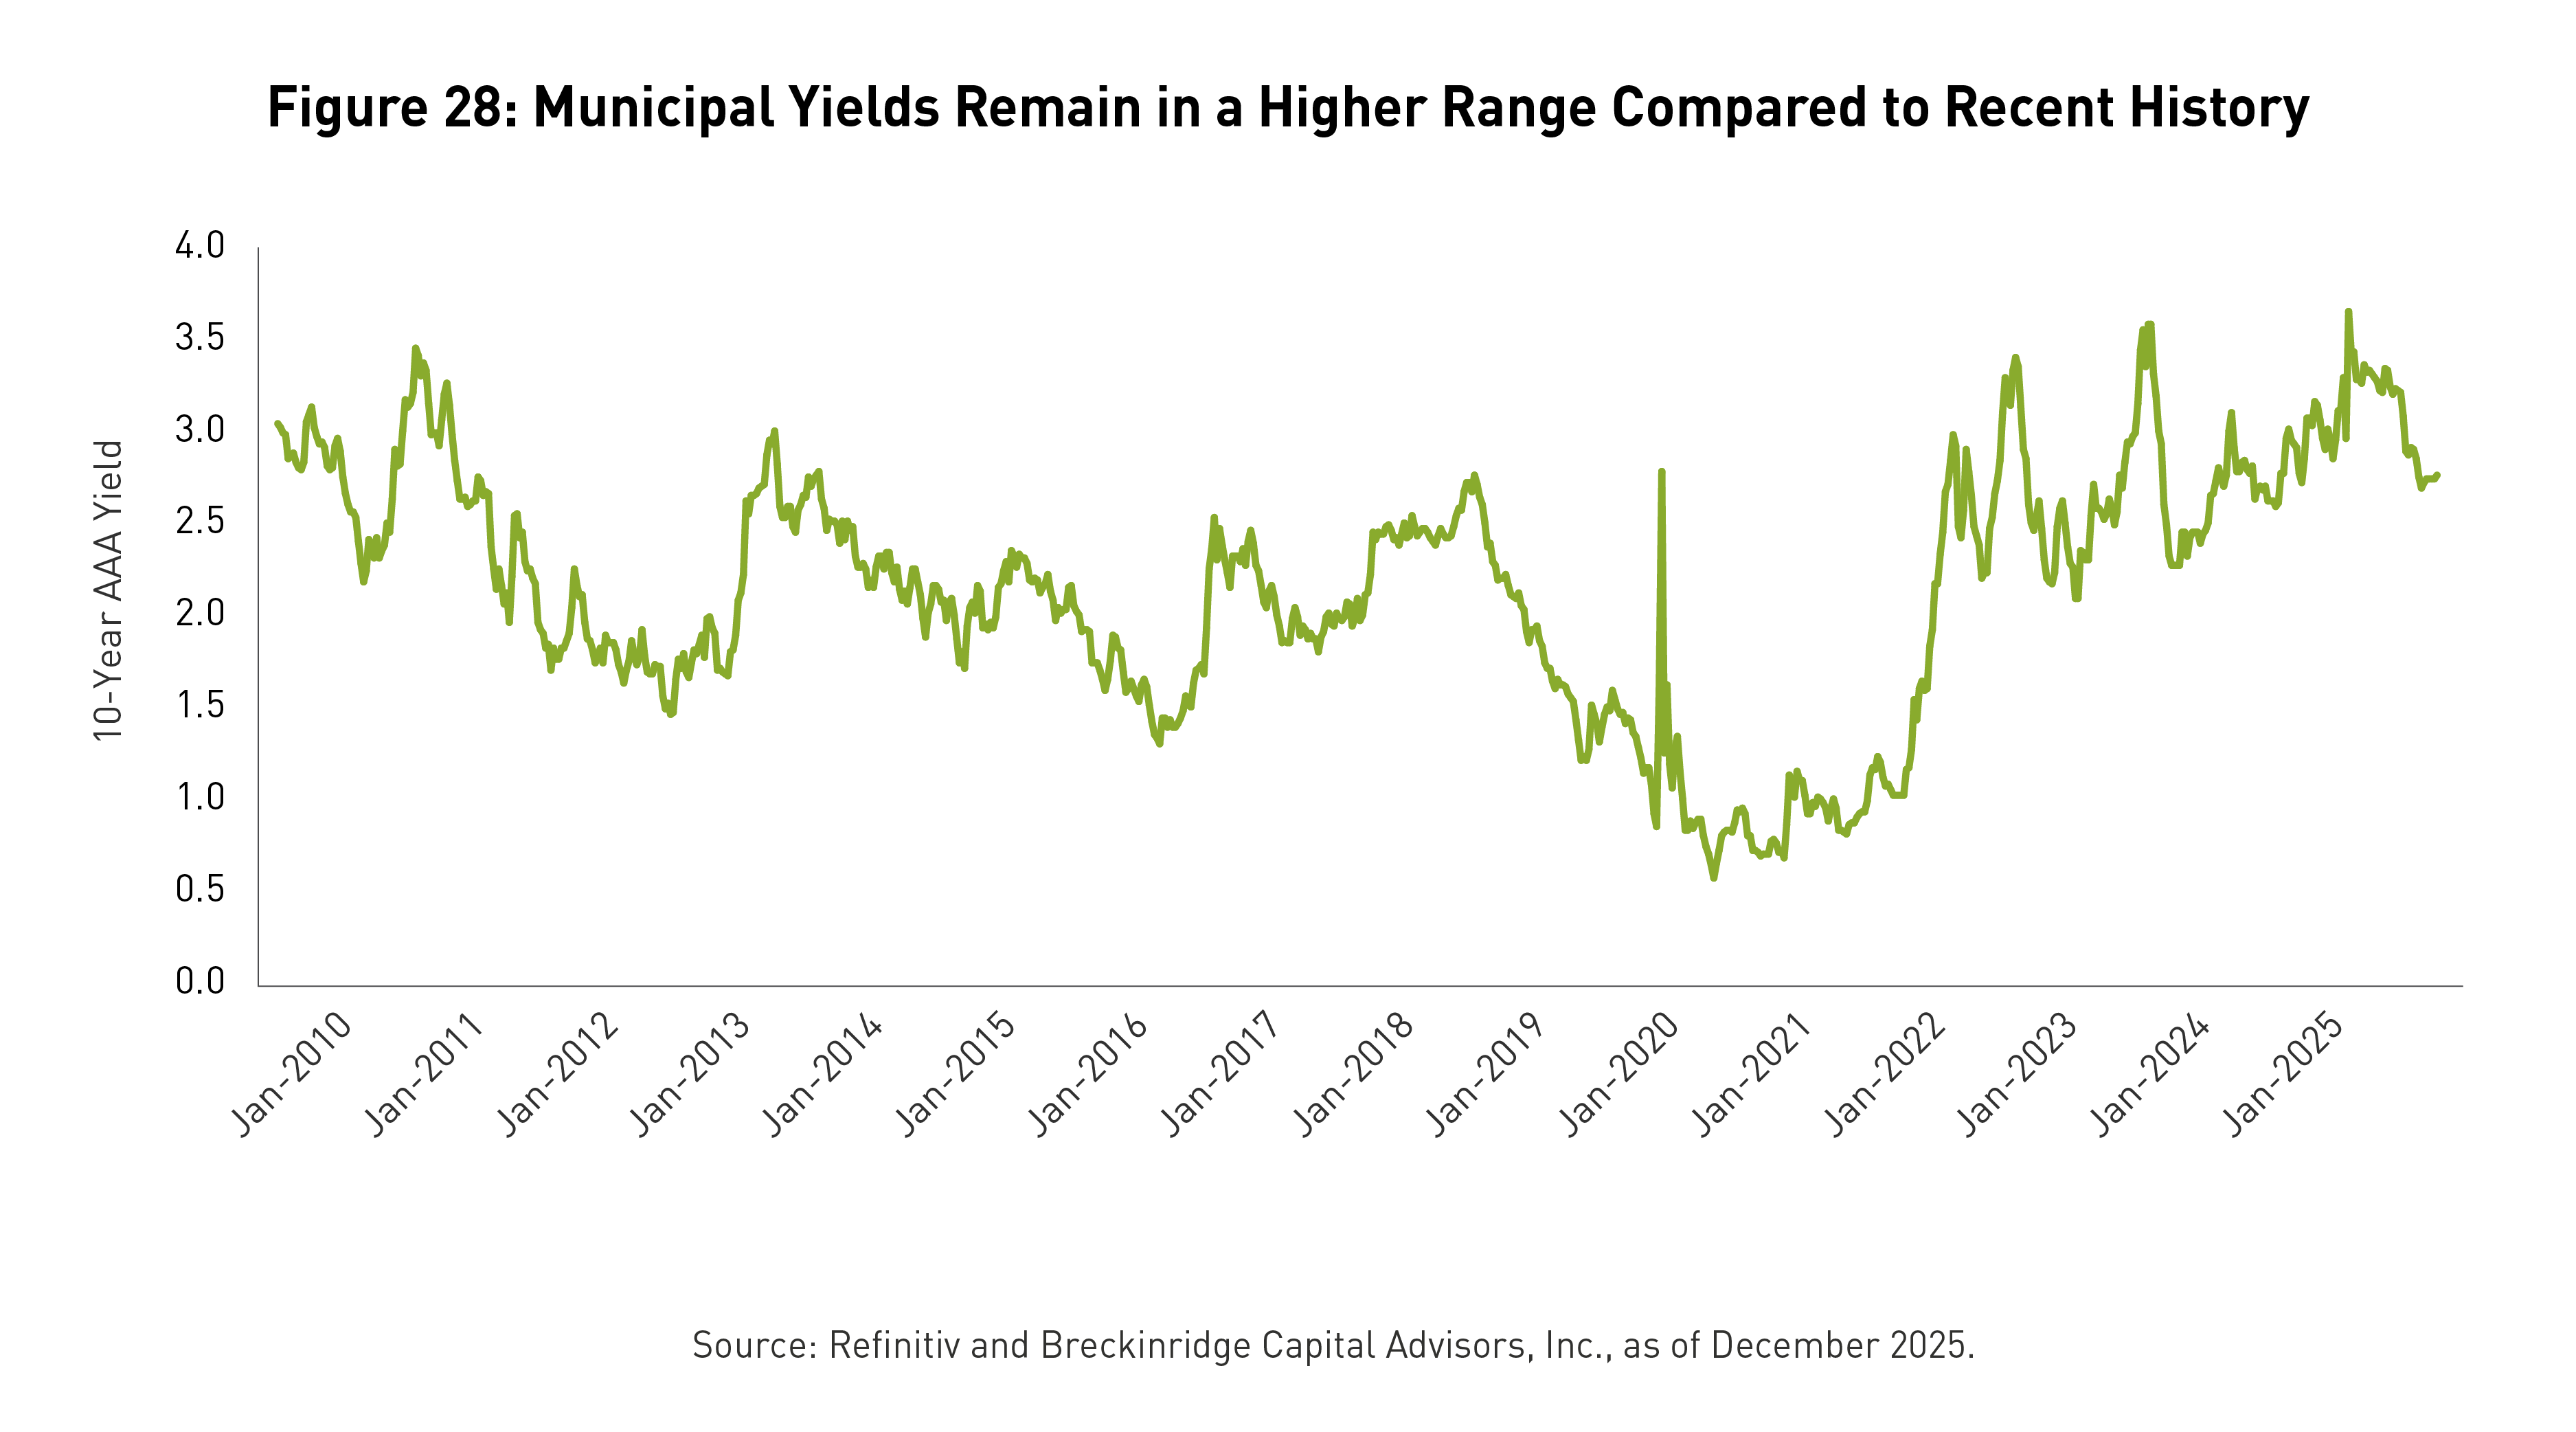
- Absolute yields remain attractive for investors in the top marginal bracket.
FUNDAMENTALS
Market Strengths
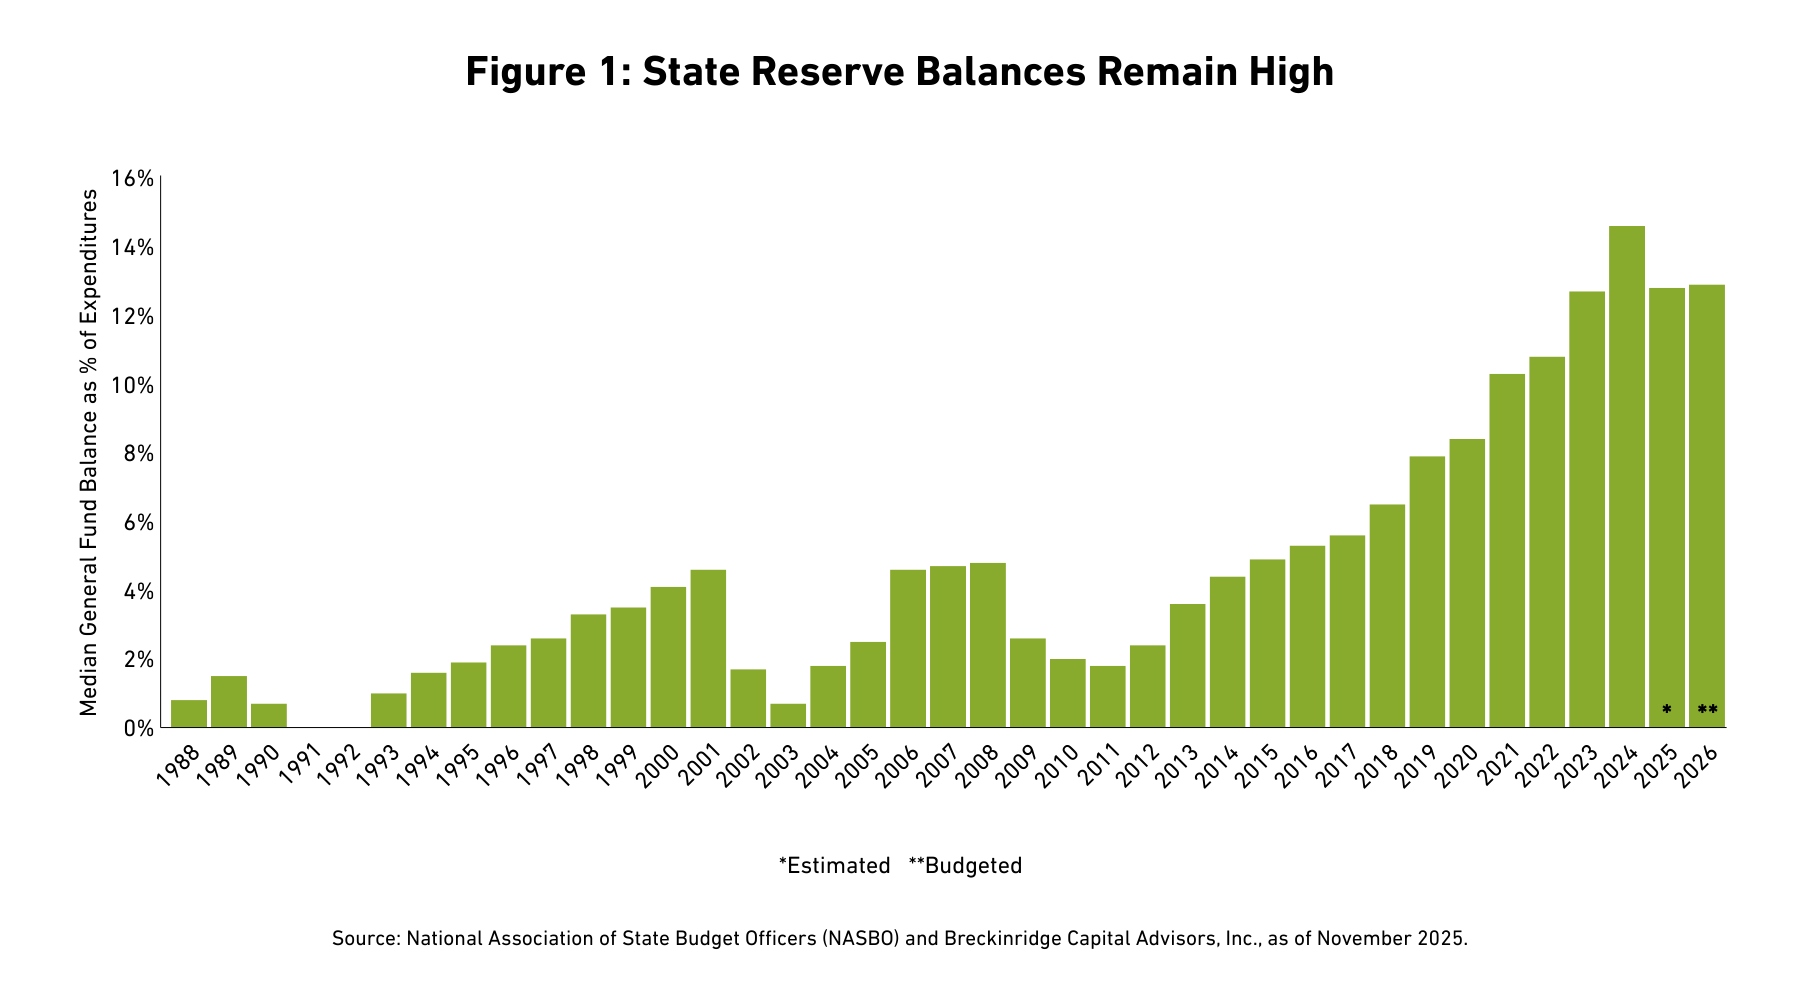
States. Reserve levels remain near a record high, and state budget assumptions remain quite conservative (See Figure 1).2 Some issuers with weaker reputations earned upgrades in 2025 (e.g., Connecticut, Illinois, and New Jersey).3 Overall, states are better positioned to withstand an economic downturn than they were in 2007.4 Healthy states make for a stable muni market. State obligations comprise over 10 percent of Bloomberg’s (BBG) U.S. Municipal Bond Index (Index) and state intercept and guarantee programs back another 9 percent of Index par value.5
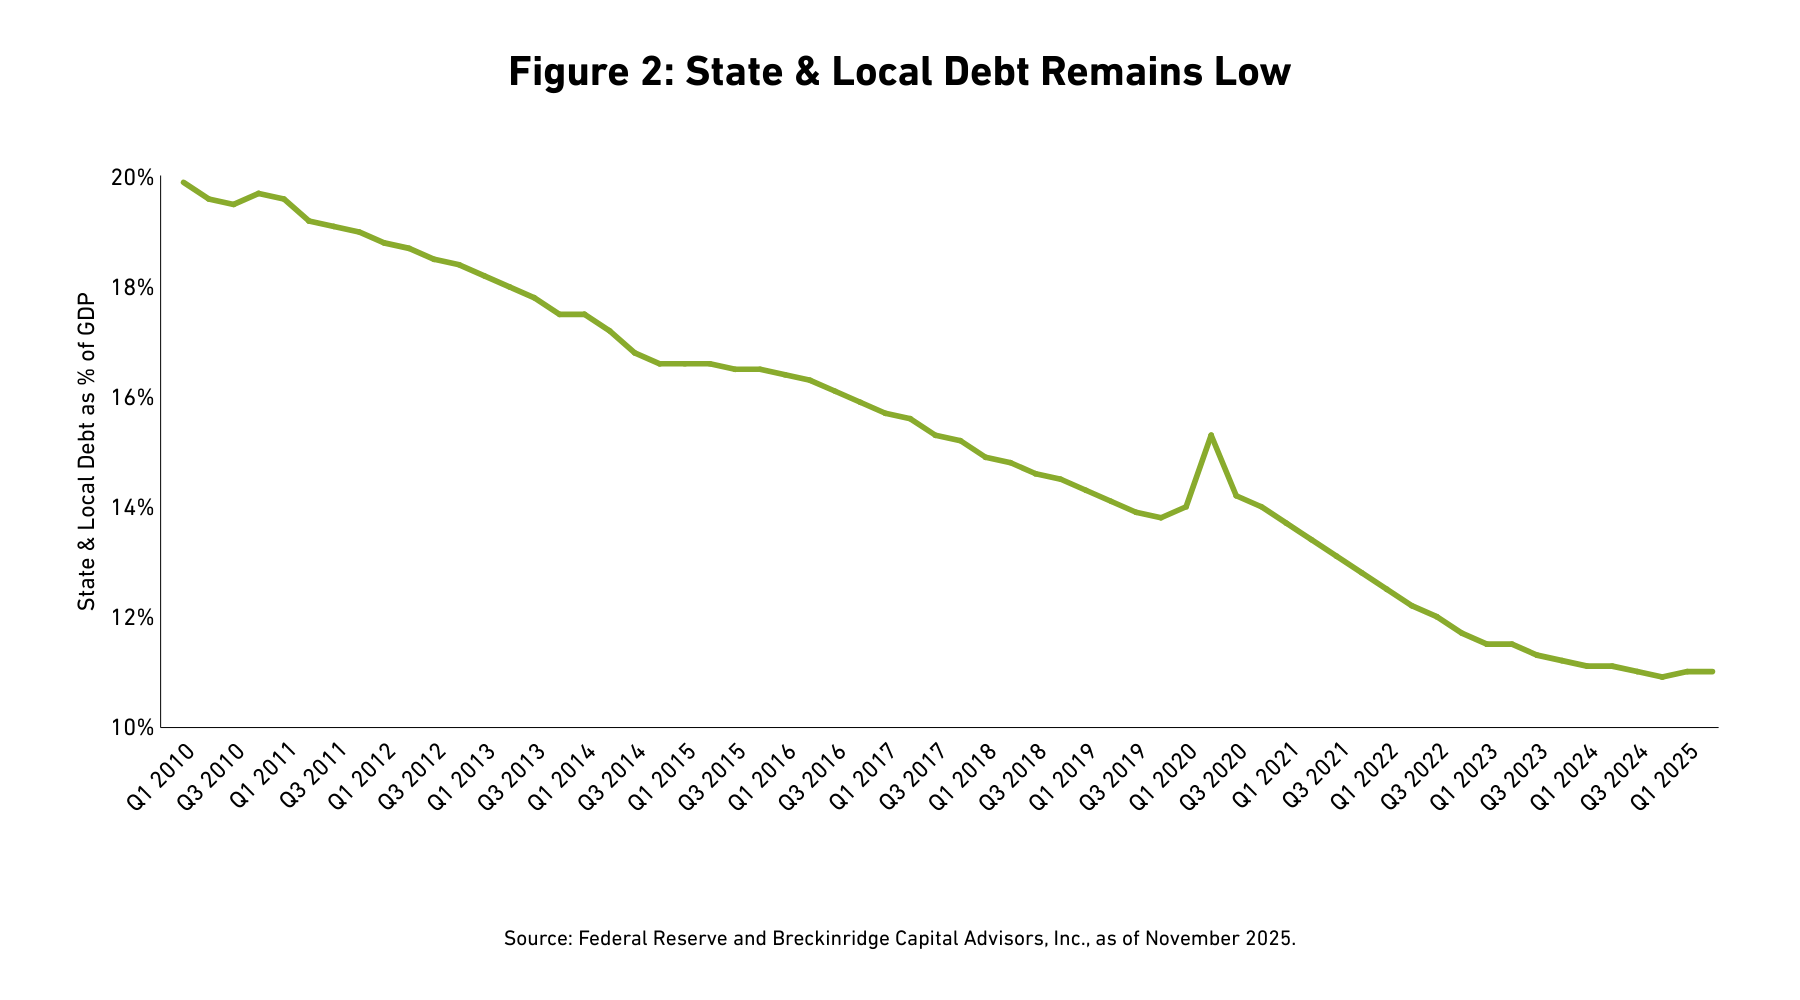
Debt levels. Resilient state credit quality reflects, in part, relatively low debt levels. State and local government debt comprises only 11 percent of gross domestic product (GDP), down from over 20 percent in 2010 (See Figure 2). On average, interest costs comprise less than 4 percent of governmental expenses.6
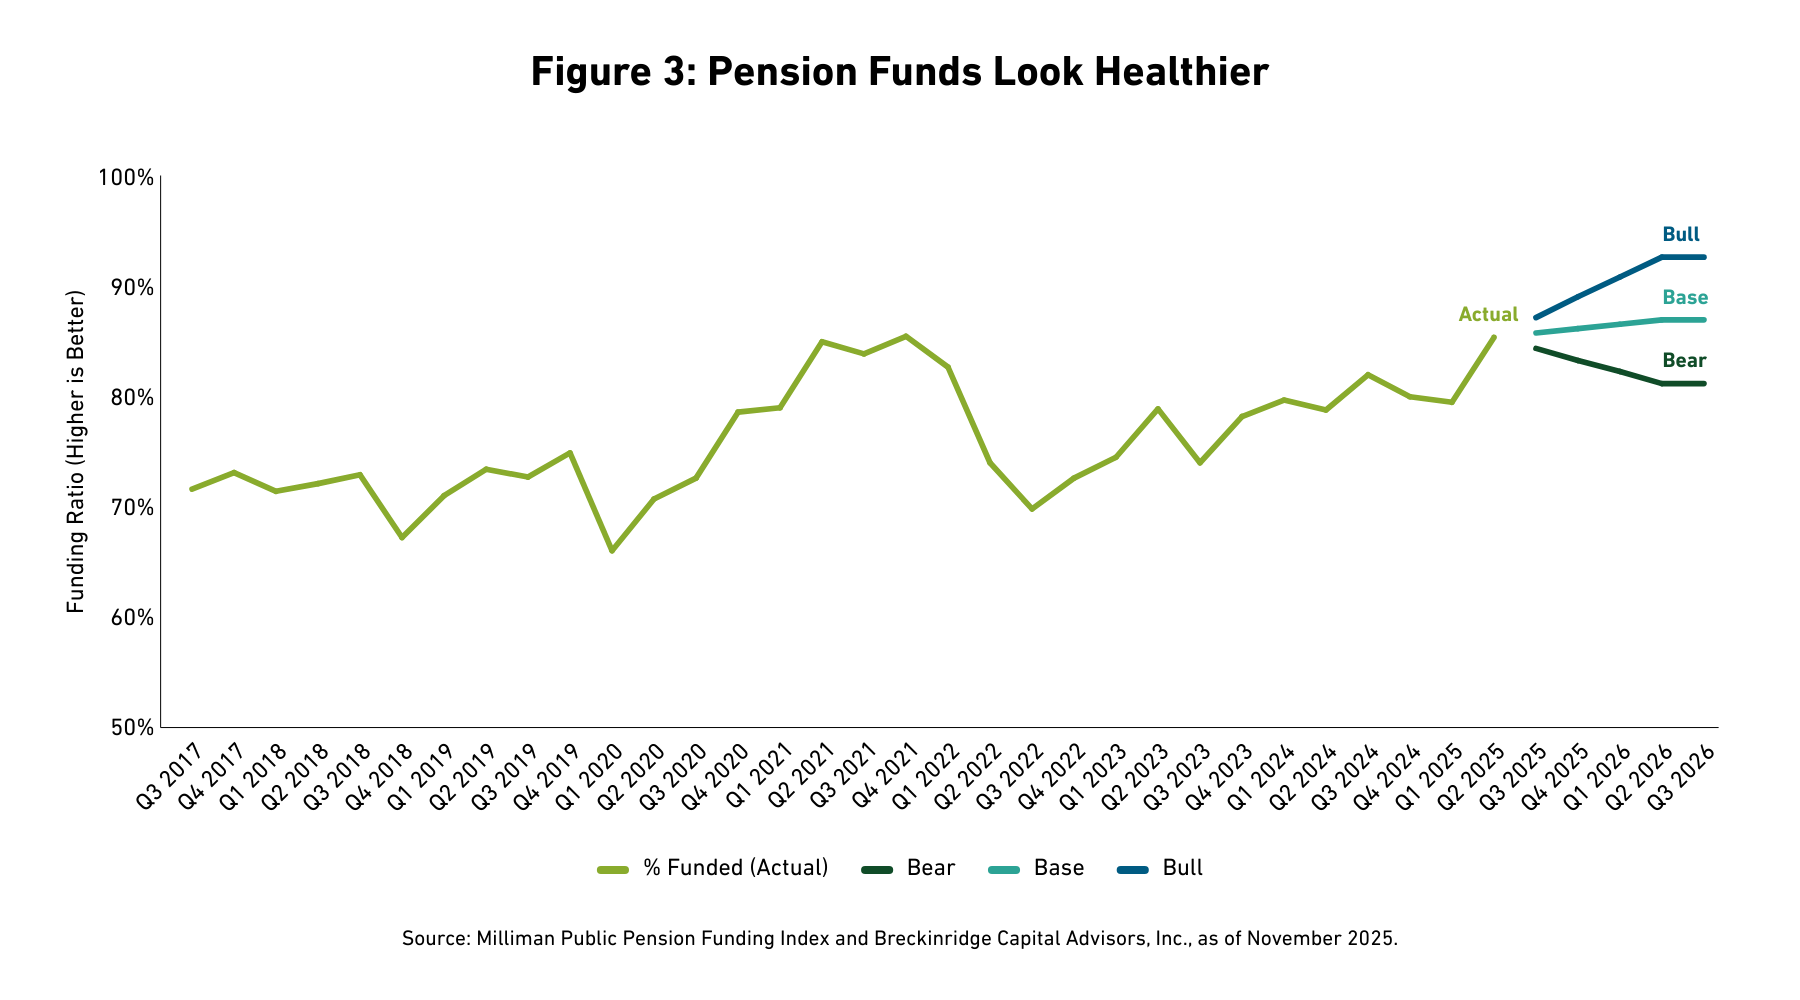
Pensions. The unfunded liabilities of public pension funds declined from 21 percent to 9 percent of GDP, from Q1 2020 to Q2 2025.7 Actuaries at Milliman, Inc., now estimate that the aggregate funding ratio for the largest 100 U.S. public pension plans will be 81 percent in 2026 in a bear market scenario (See Figure 3).
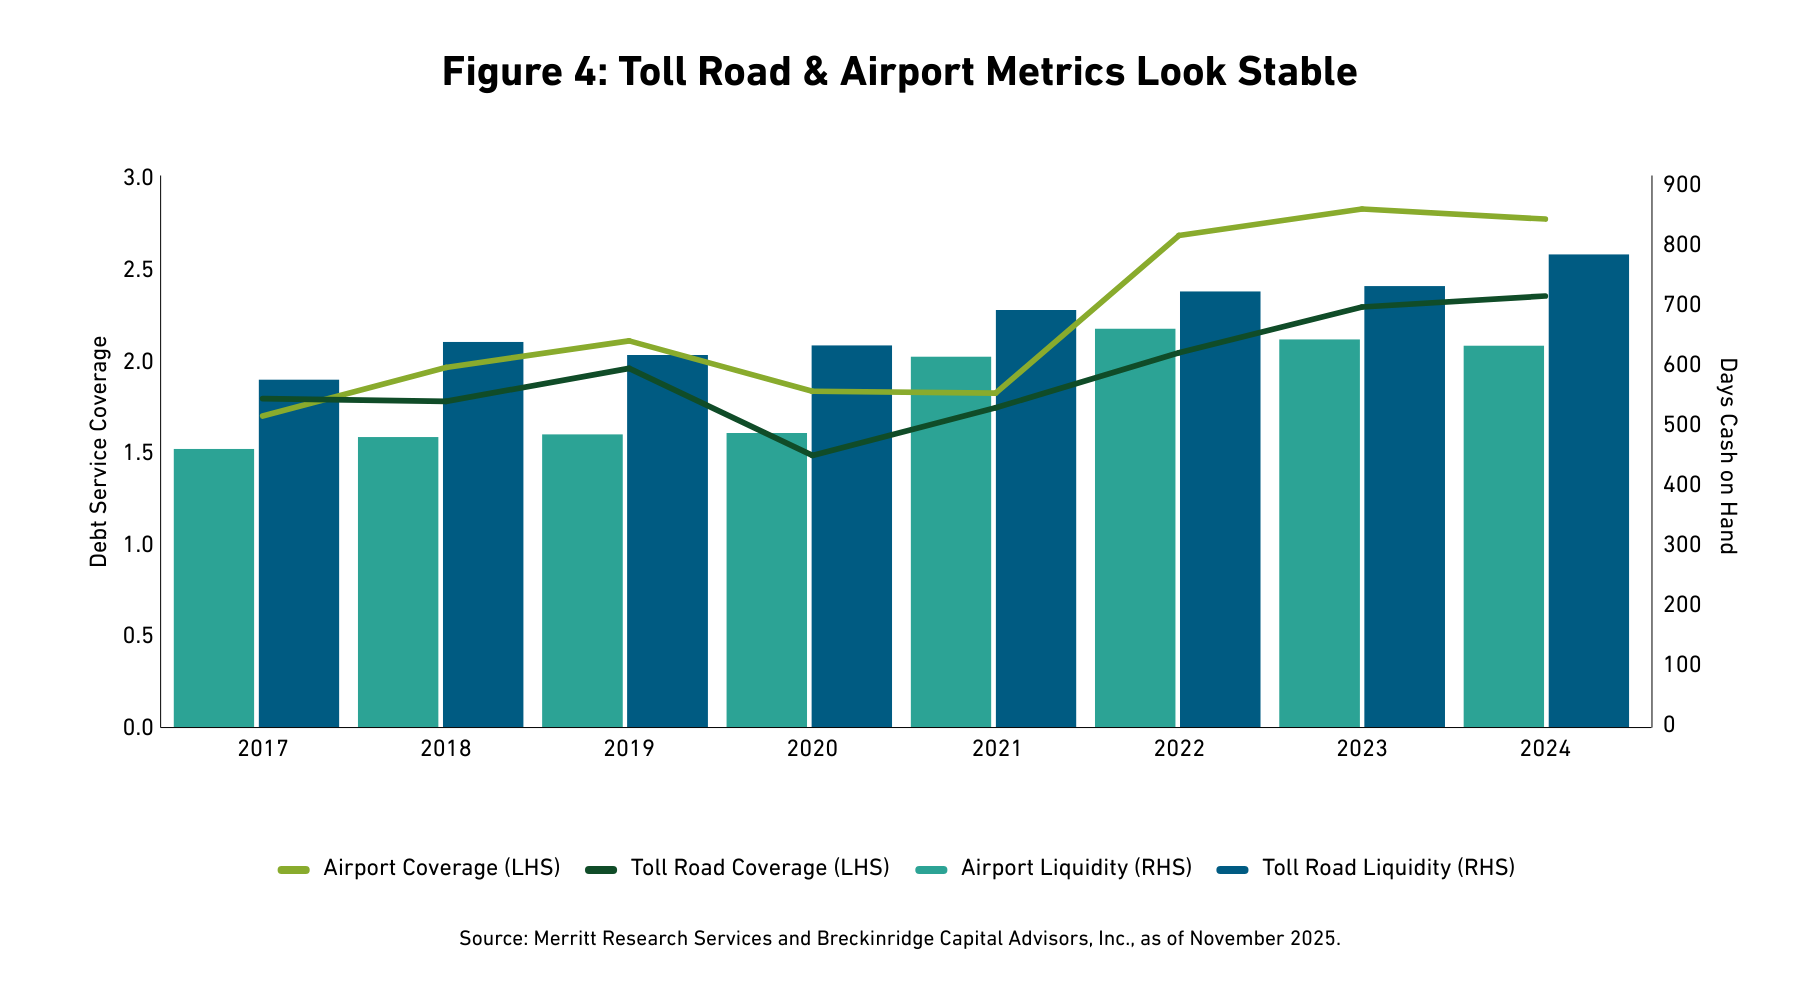
Transportation (excluding mass transit). Cash and coverage metrics in the toll road and airport sectors have improved consistently in recent years (See Figure 4). Highway traffic is up 15 percent since the COVID-19 pandemic.8 Airport enplanements (boardings) returned to their pre-COVID-19 peak in 2025,9 and air traffic is set to grow again as larger planes enter service in 2026.10 Port liquidity (not shown) remains strong, and landlord ports are generally well insulated from tariff-driven volume declines.11
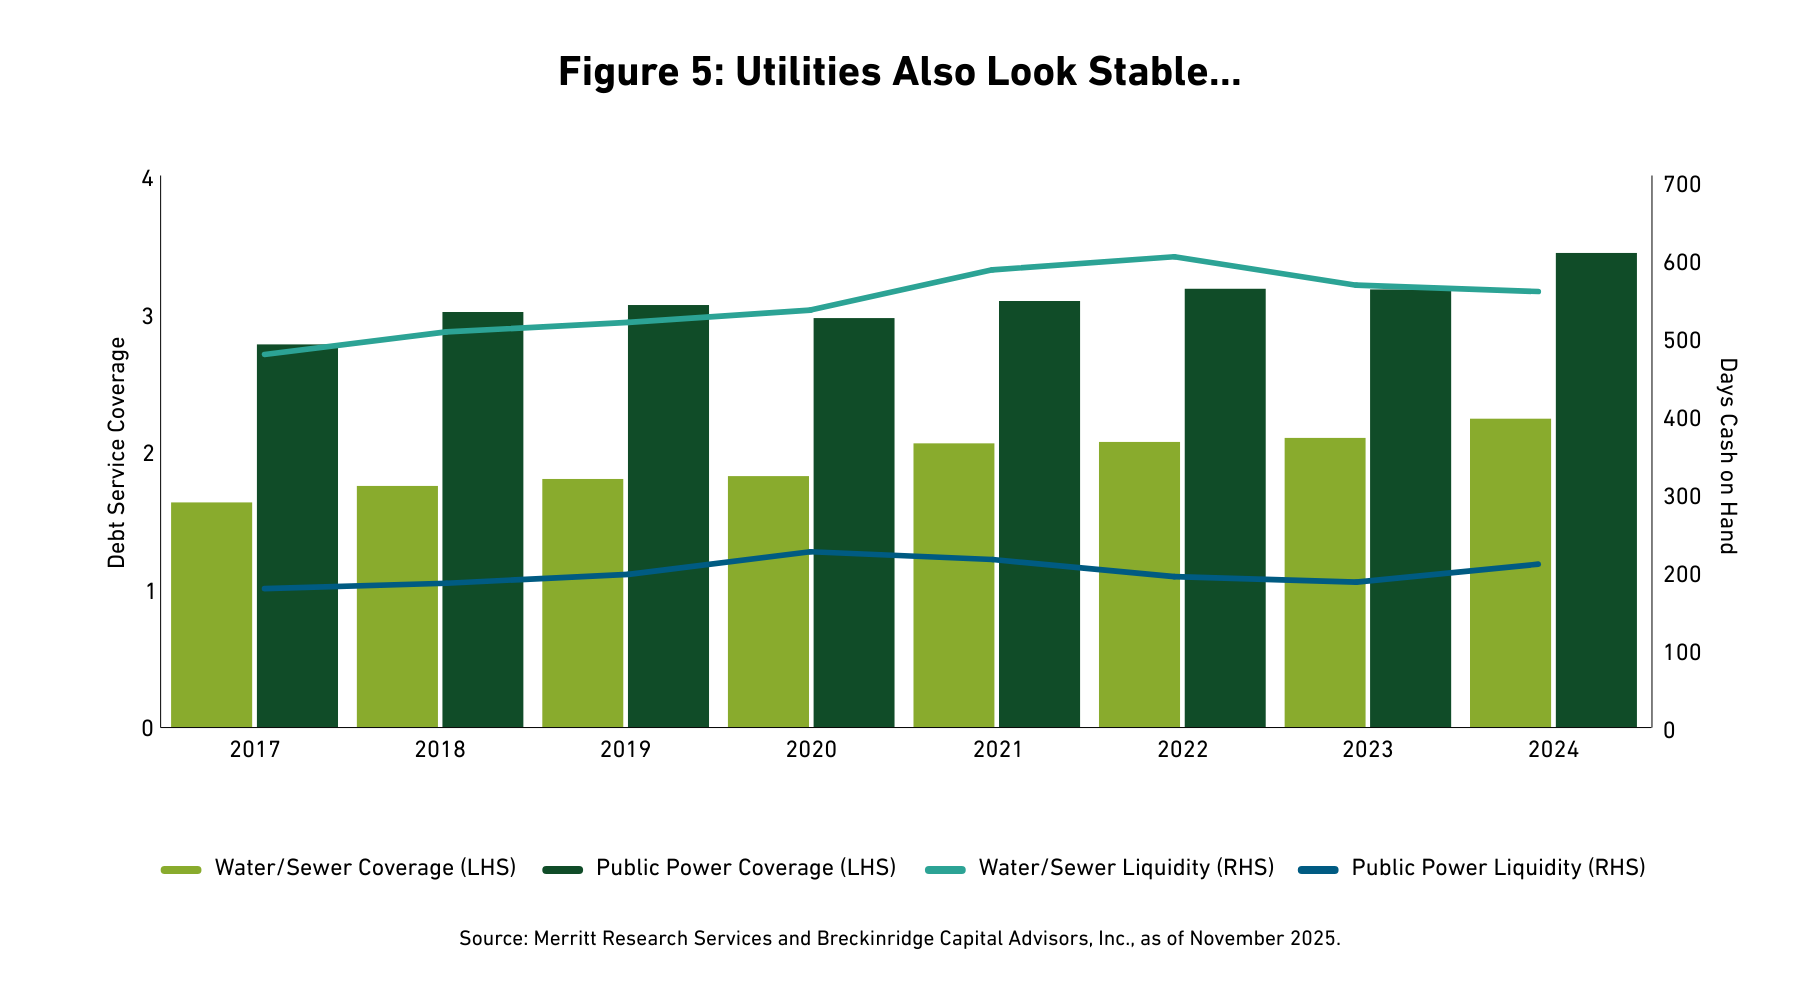
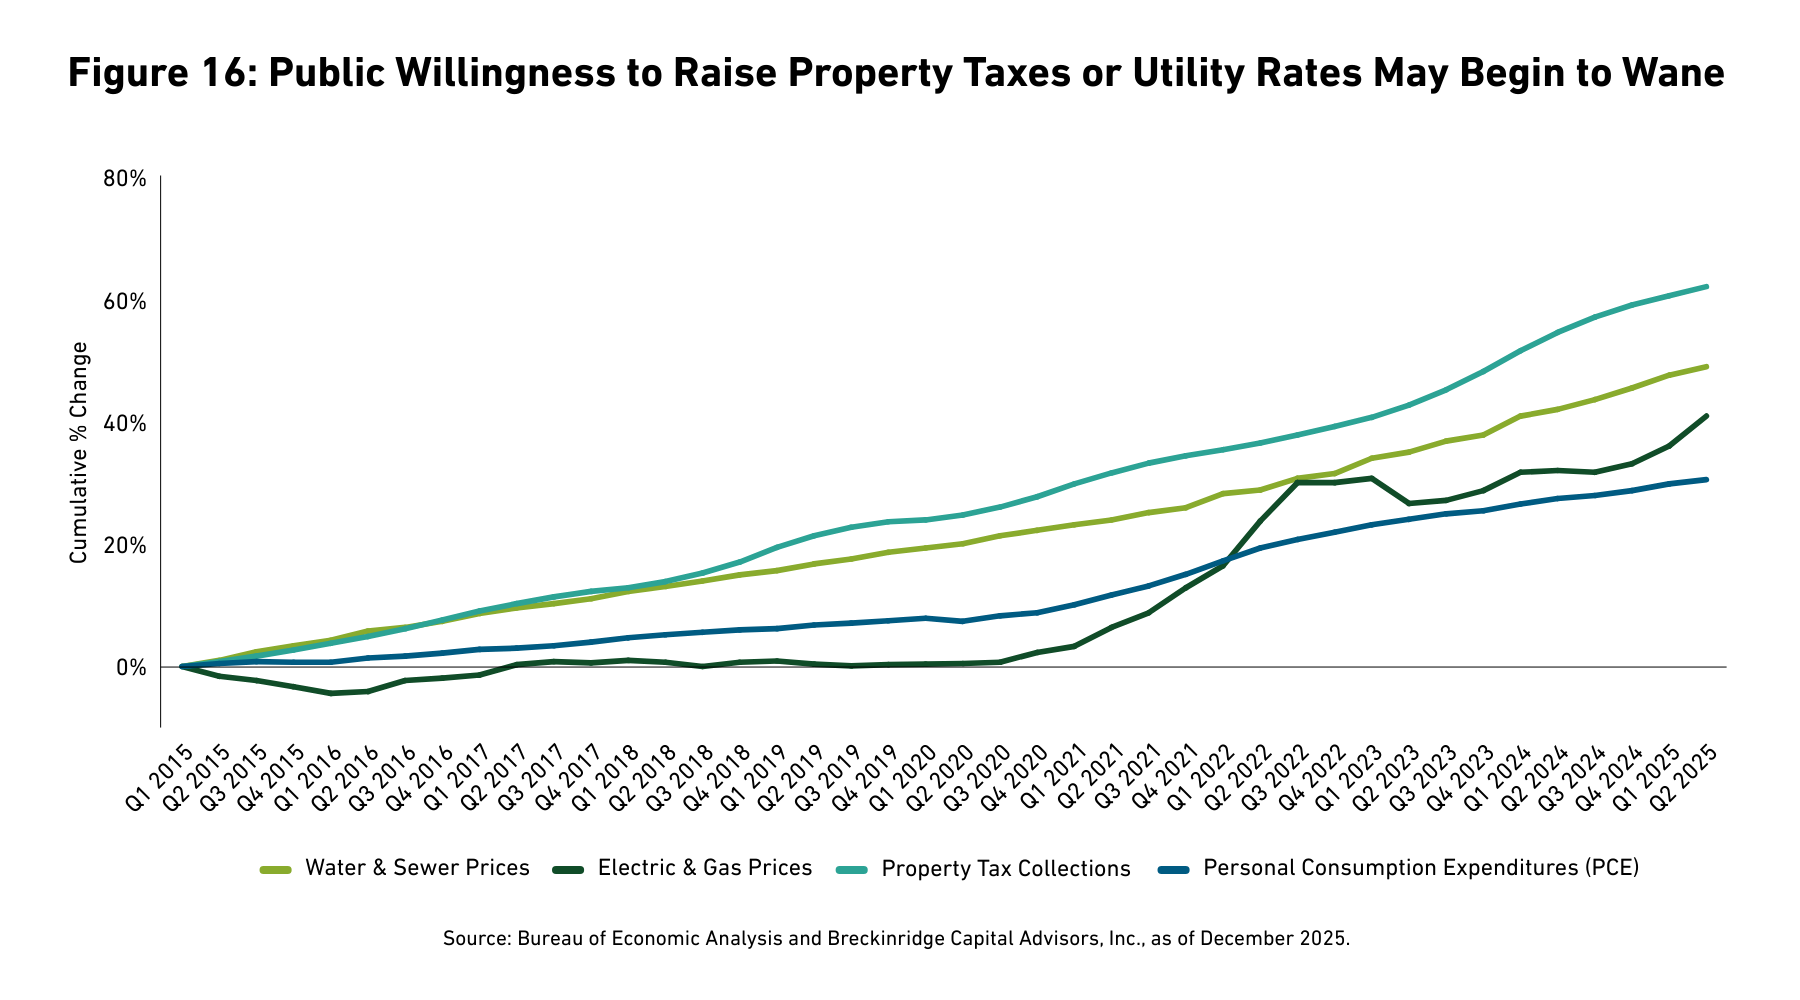
Utilities. Cash and coverage metrics suggest credit health in the utility sectors, as well (See Figure 5). Utilities’ ability to increase user fees for artificial intelligence (AI)-related energy projects and water-sewer upgrades may become more challenging in 2026 (See Figure 16). Nonetheless, we expect most issuers can ably manage given the sectors’ strong overall base.
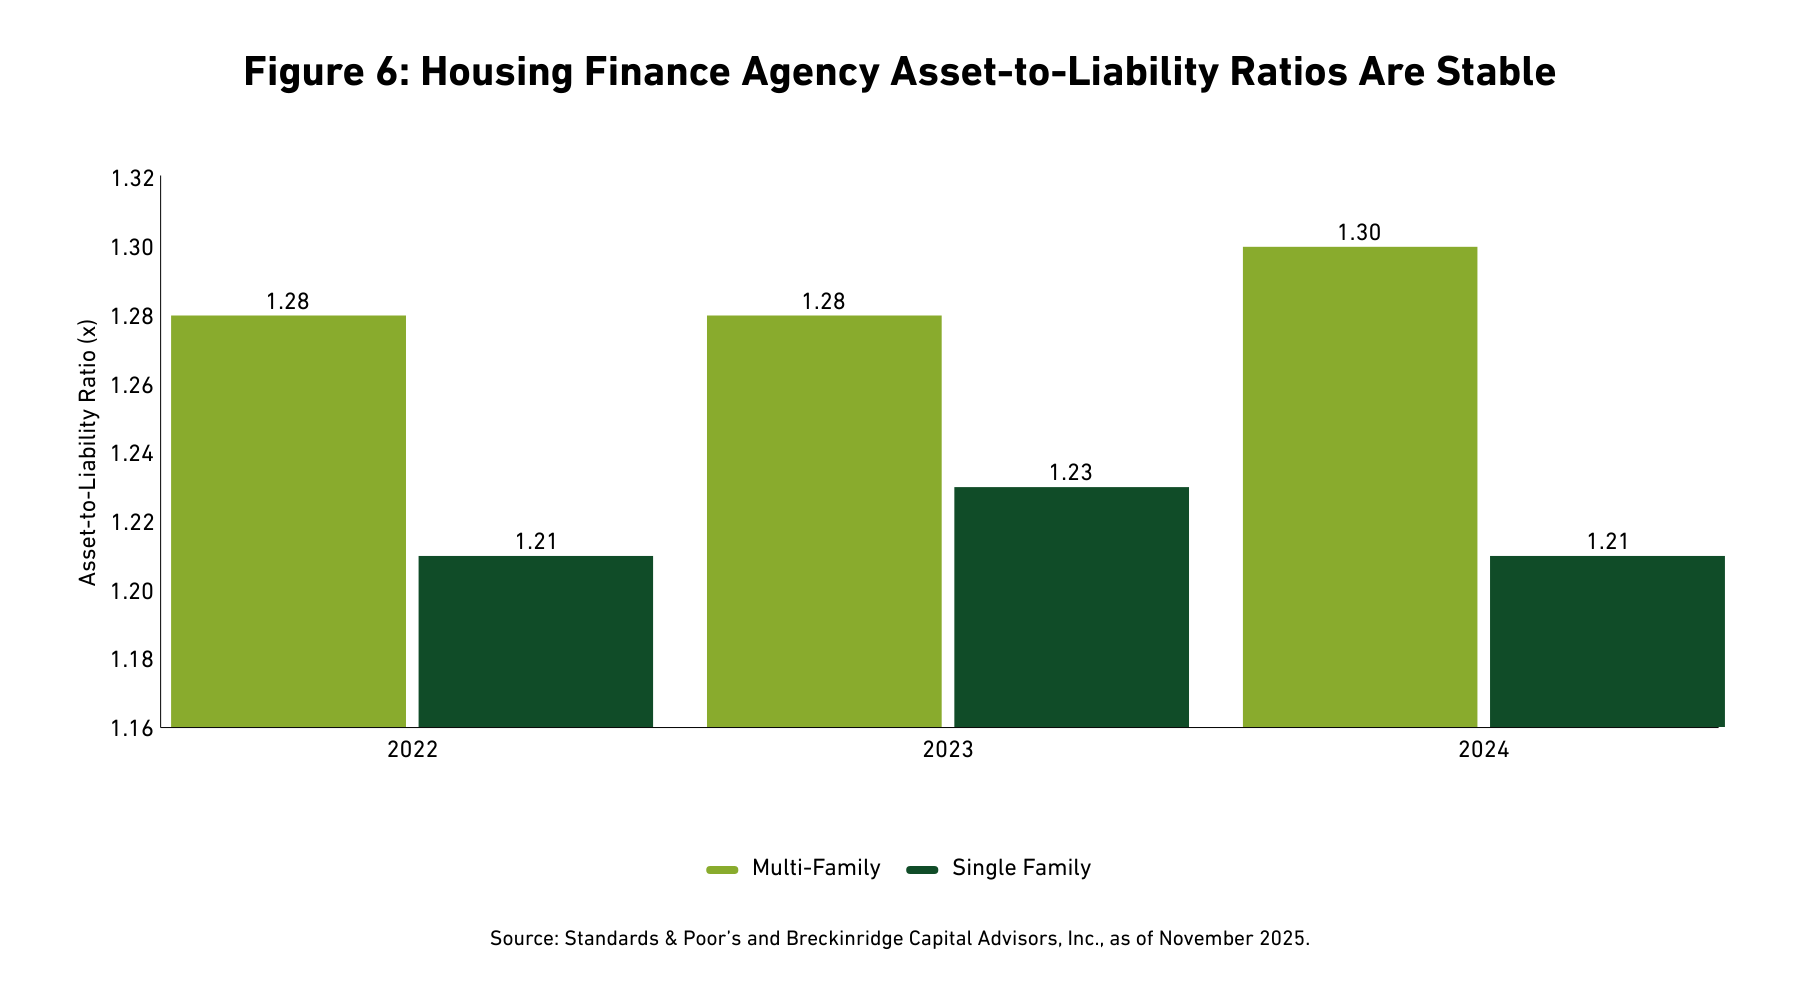
Pooled housing. Asset-to-liability ratios in state housing finance agency loan pools remain well above 1.0 times (See Figure 6). Federally insured mortgage-backed securities (MBS) now comprise the bulk of loans held in single-family structures.12
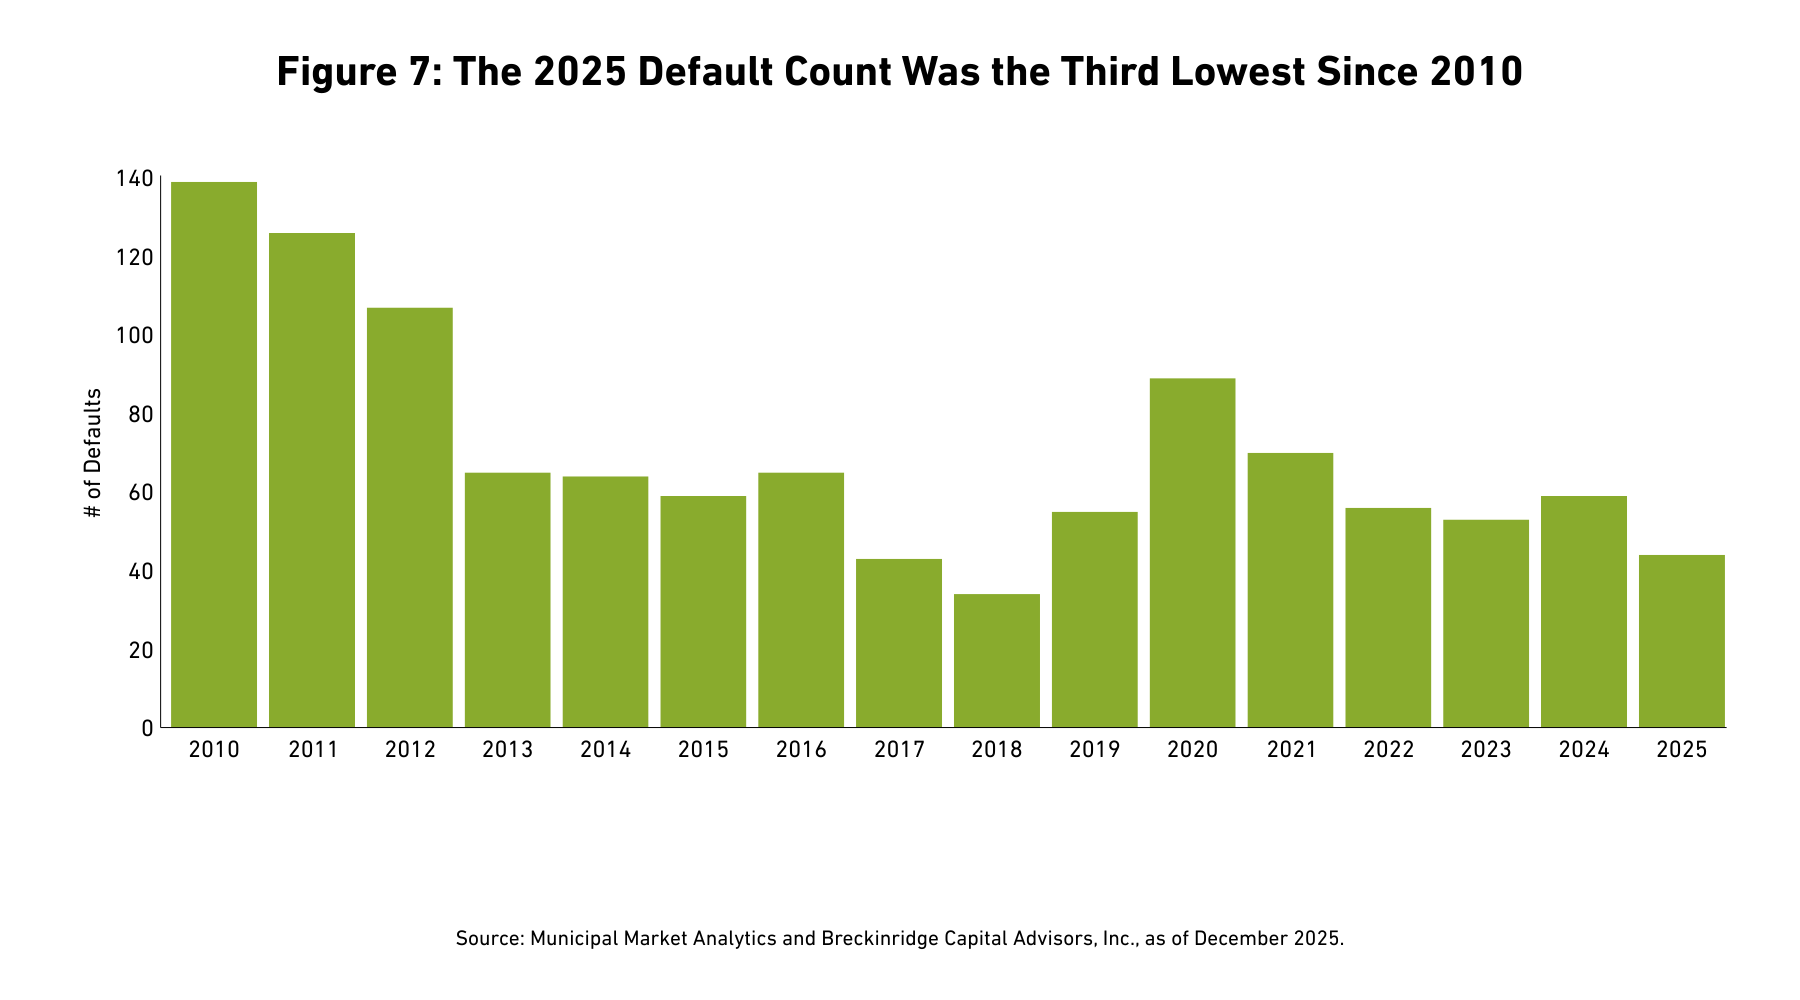
Low default rates. The sturdy fundamental environment resulted in another year with few bond defaults. Through mid-December, there had been only 44, tied for the third-best pace since 2010 (See Figure 7). Just over 1 percent of market debt was classified as impaired, as of late November 2025, a figure consistent with recent years.13
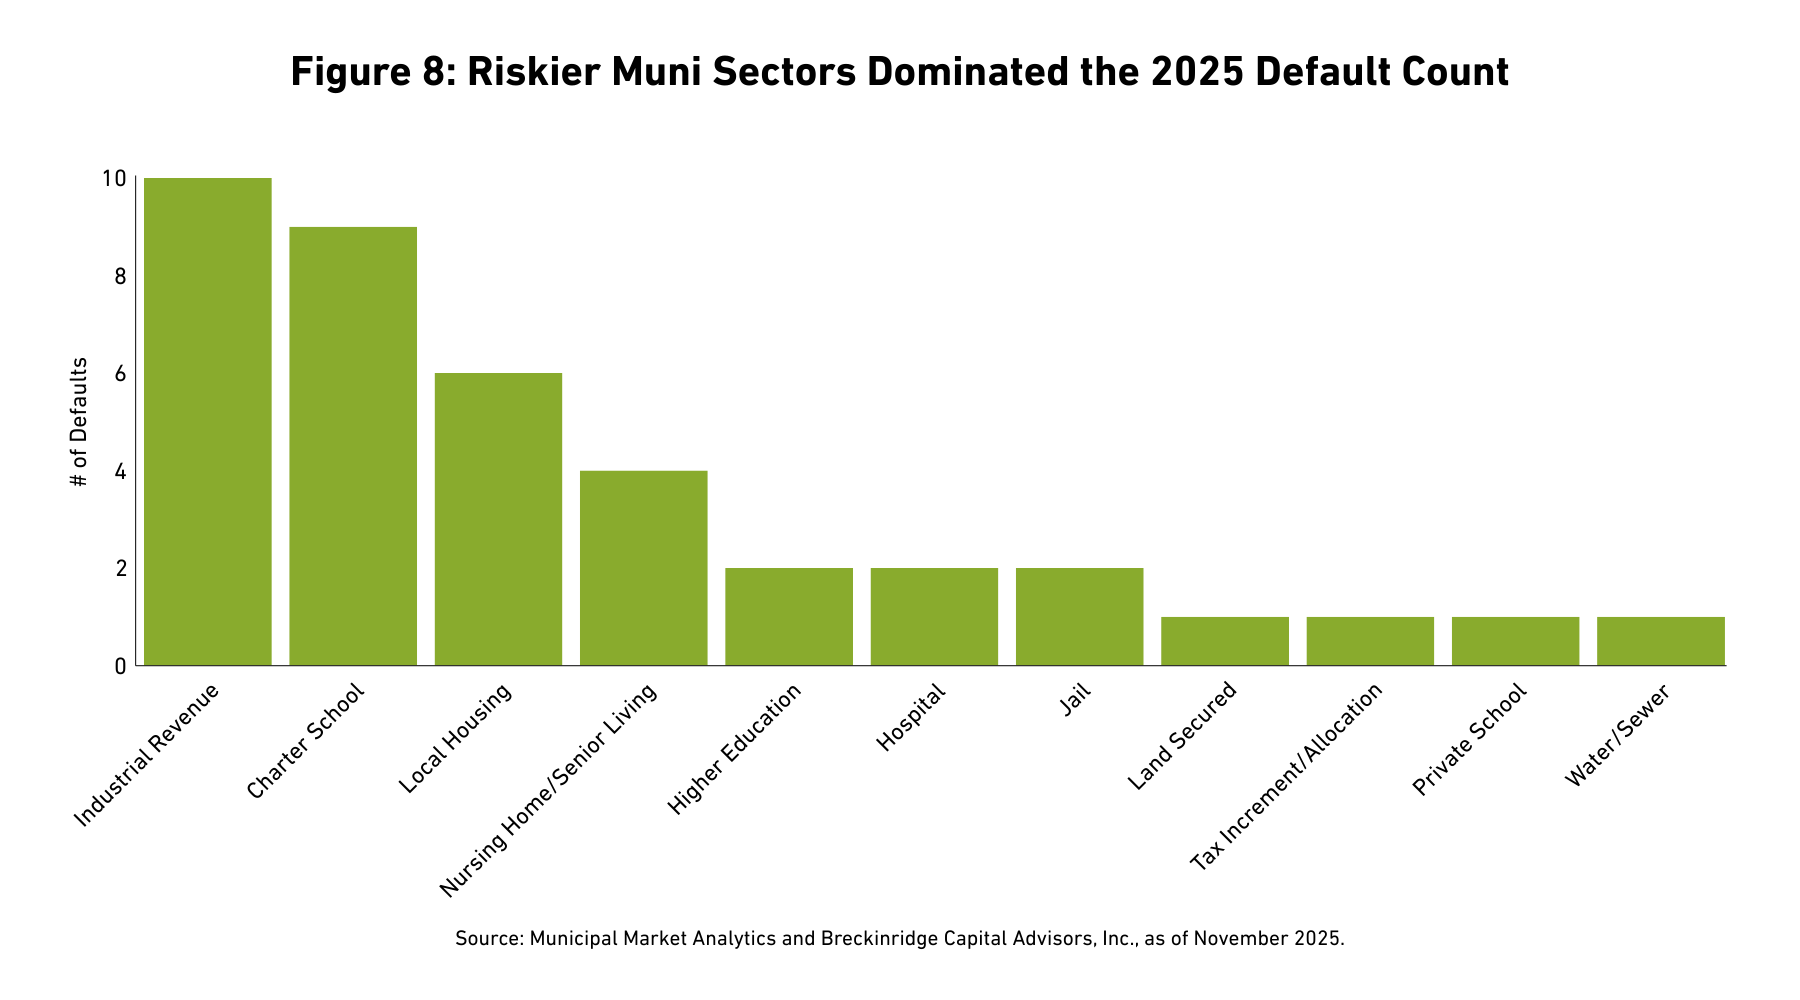
The lone “safe sector” municipal bond default in 2025 involved a poorly secured water security issued by tiny Benham, Kentucky.14 Otherwise, all defaults occurred in historically riskier sectors (See Figure 8).
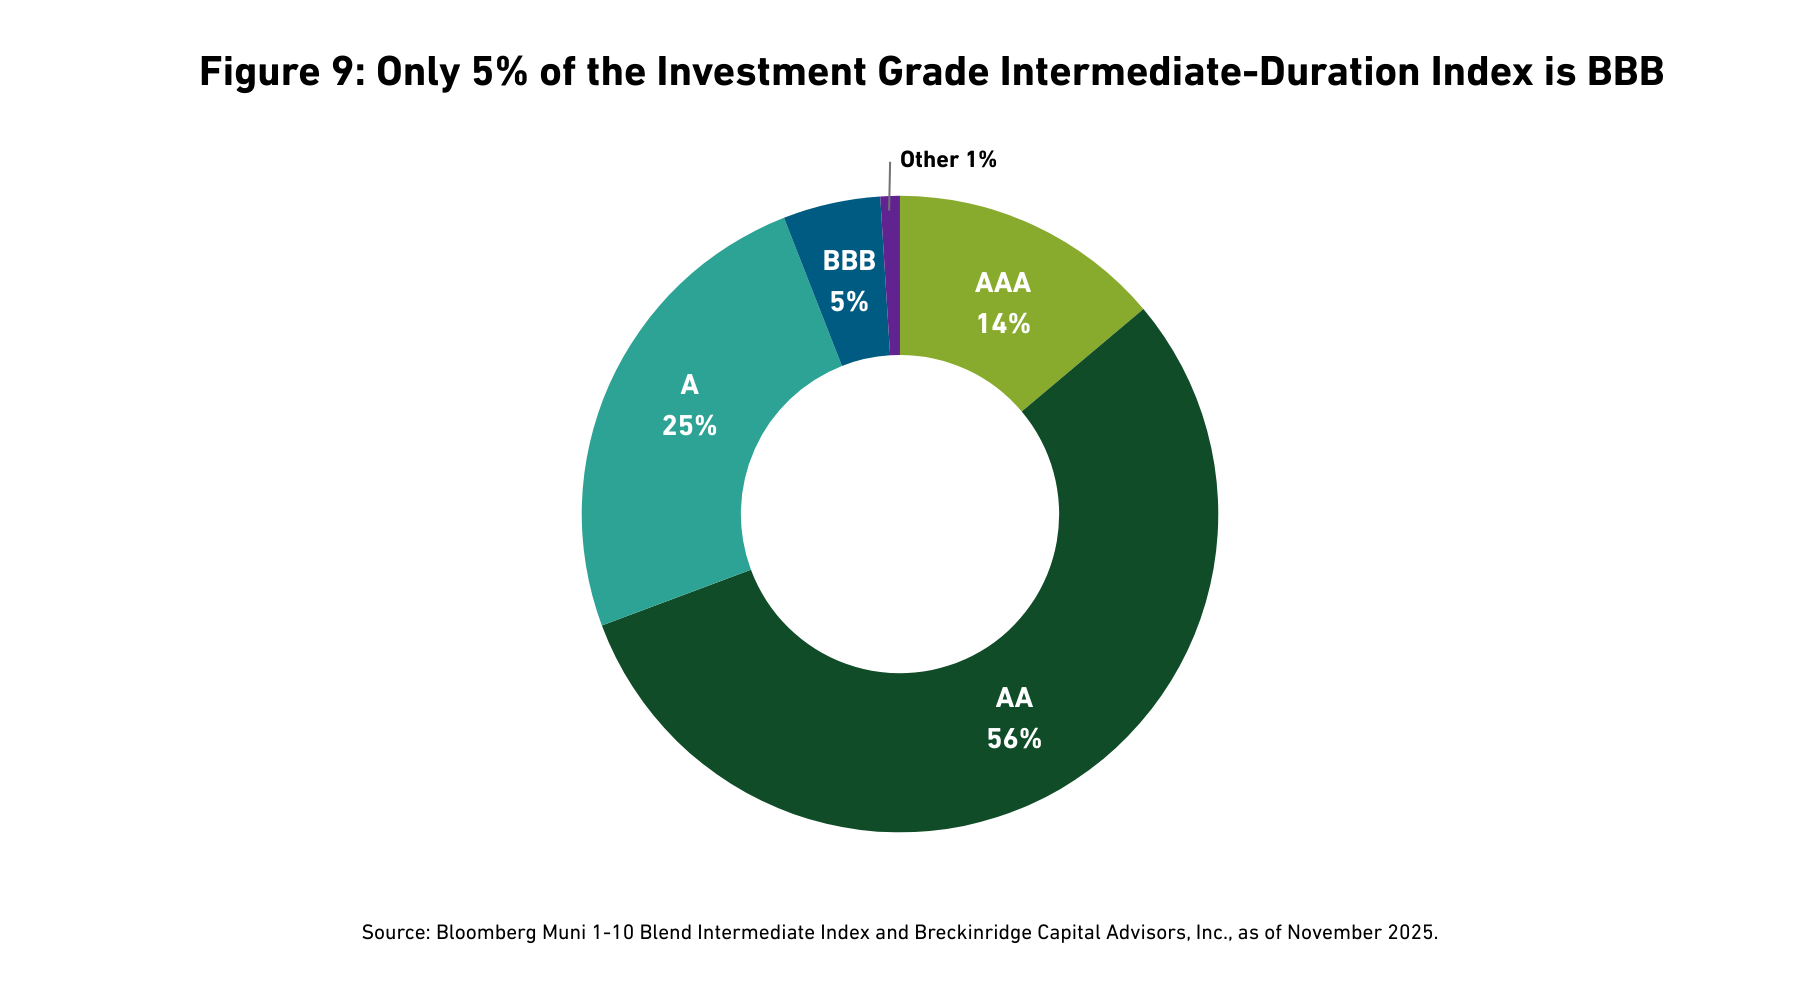
High ratings. The market’s generally solid credit quality has flowed through to high ratings. Only 5 percent of the Bloomberg 1-10 Blend Intermediate Index now carries a BBB rating (See Figure 9). This is about half the level of 2016 (10 percent) when Illinois, New Jersey, and some other names were in the BBB category.
Risks
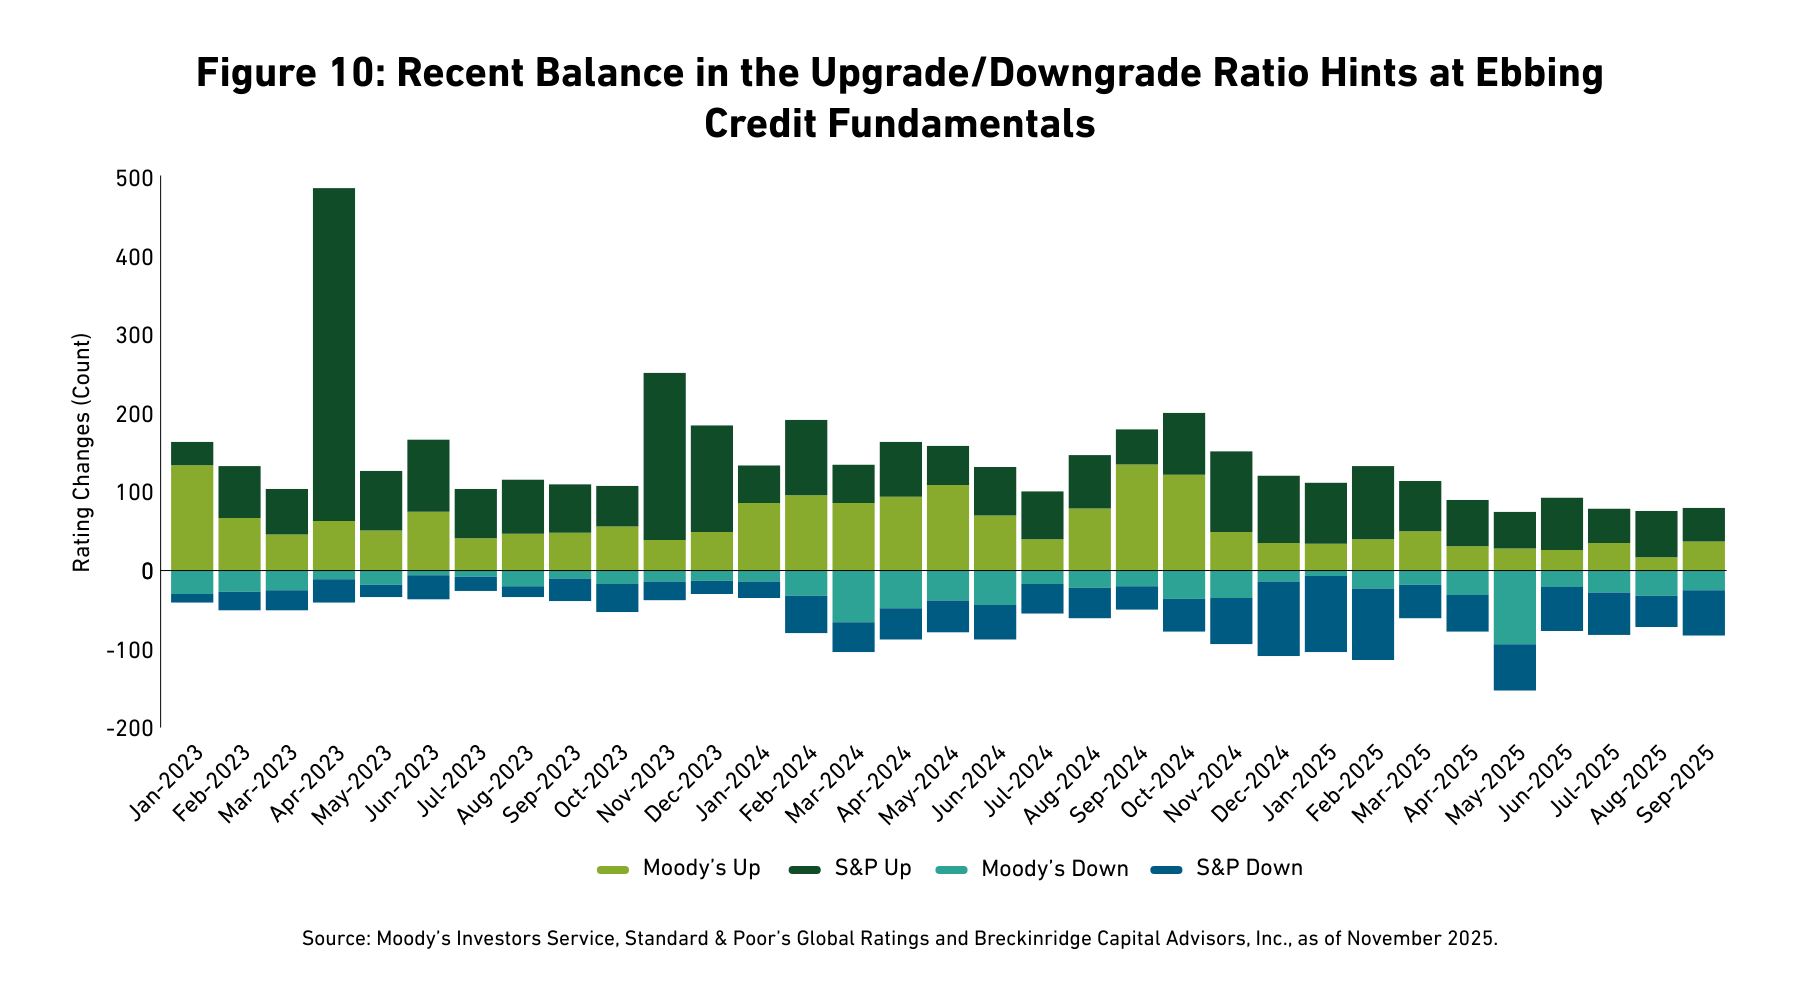
Peak ratings? A strongly positive upgrade bias seems unlikely in 2026. Improving upon such a high ratings base is difficult as a matter of math (ratings can only go so high). But some sectors also exhibit fading credit fundamentals, as we discuss in the section that follows. In the six months through September 2025 (See Figure 10), upgrades balanced downgrades across public finance sectors. A similar ratings transition experience seems plausible for next year.
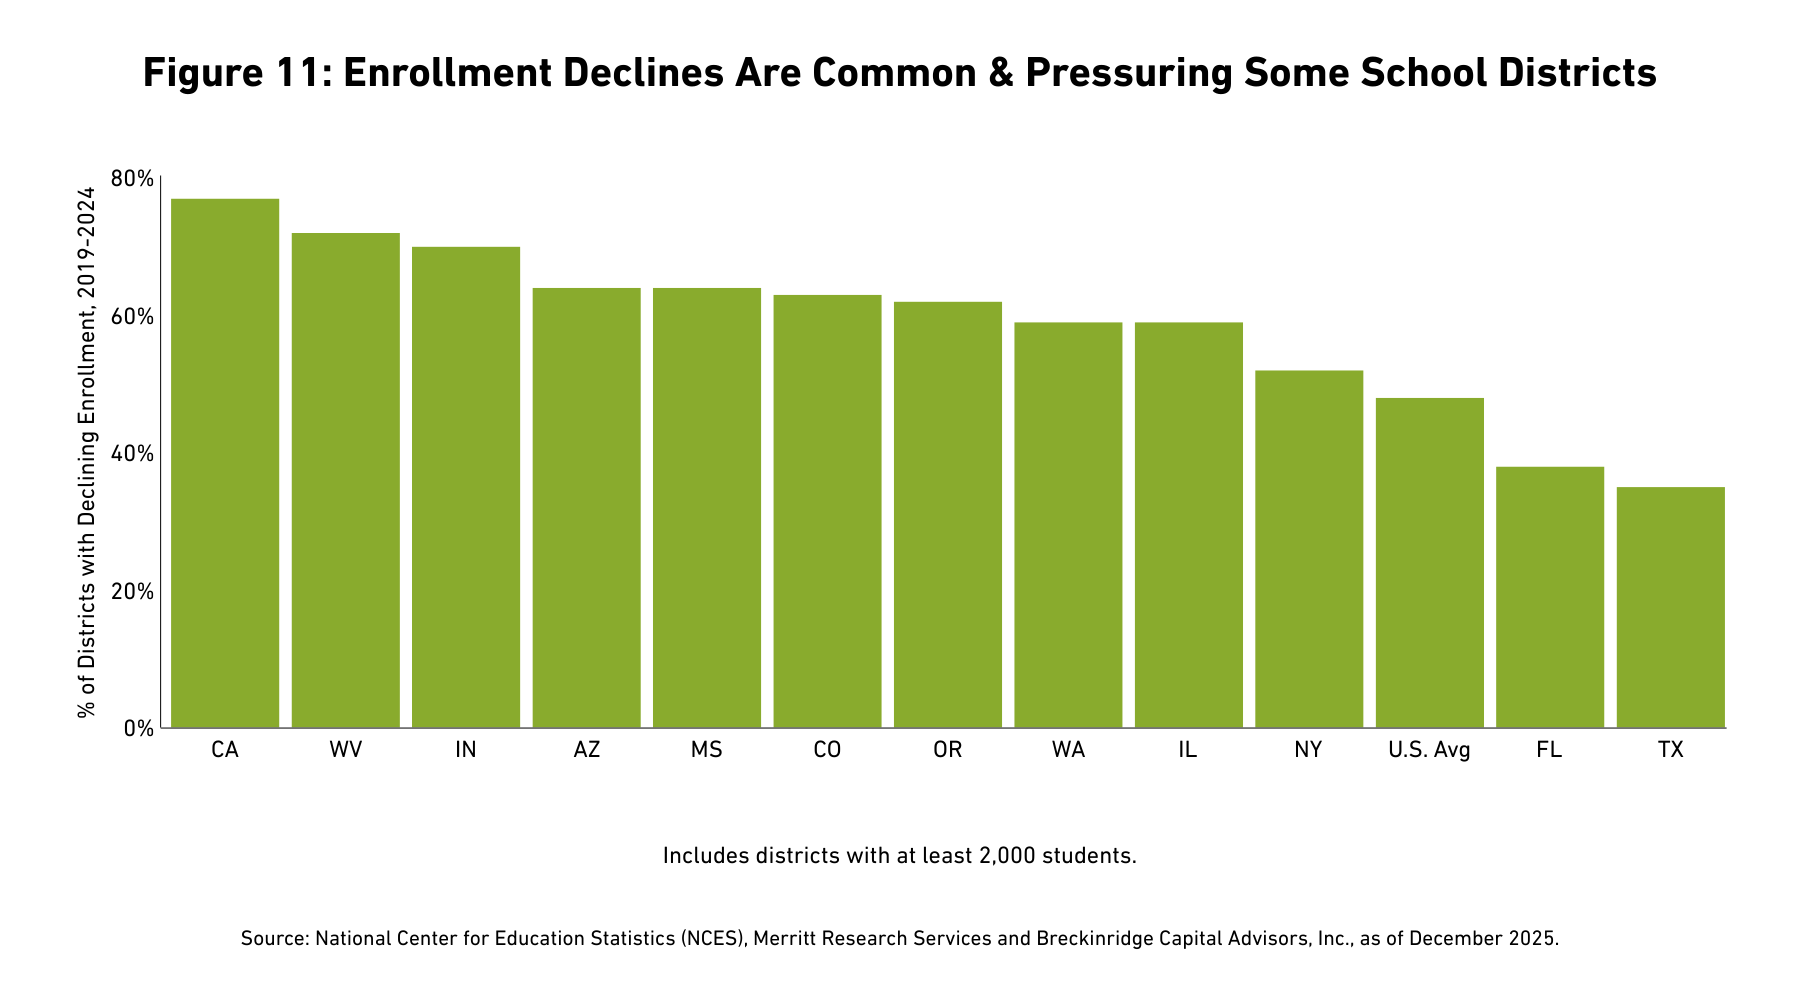
School districts. Weak demographic trends coupled with competition from charter, private, and home schooling have led to declining enrollment (and lower per pupil state aid) in some regions (See Figure 11).
Federal grant aid is also declining, even as costs associated with post-pandemic learning loss remain a challenge.15 We expressed concern about waning school credit quality as early as Spring 2022 in our article Is It Time To Go Back To School on K-12 Public School Credit Fundamentals? and would be unsurprised if downgrades outpaced upgrades in 2026.
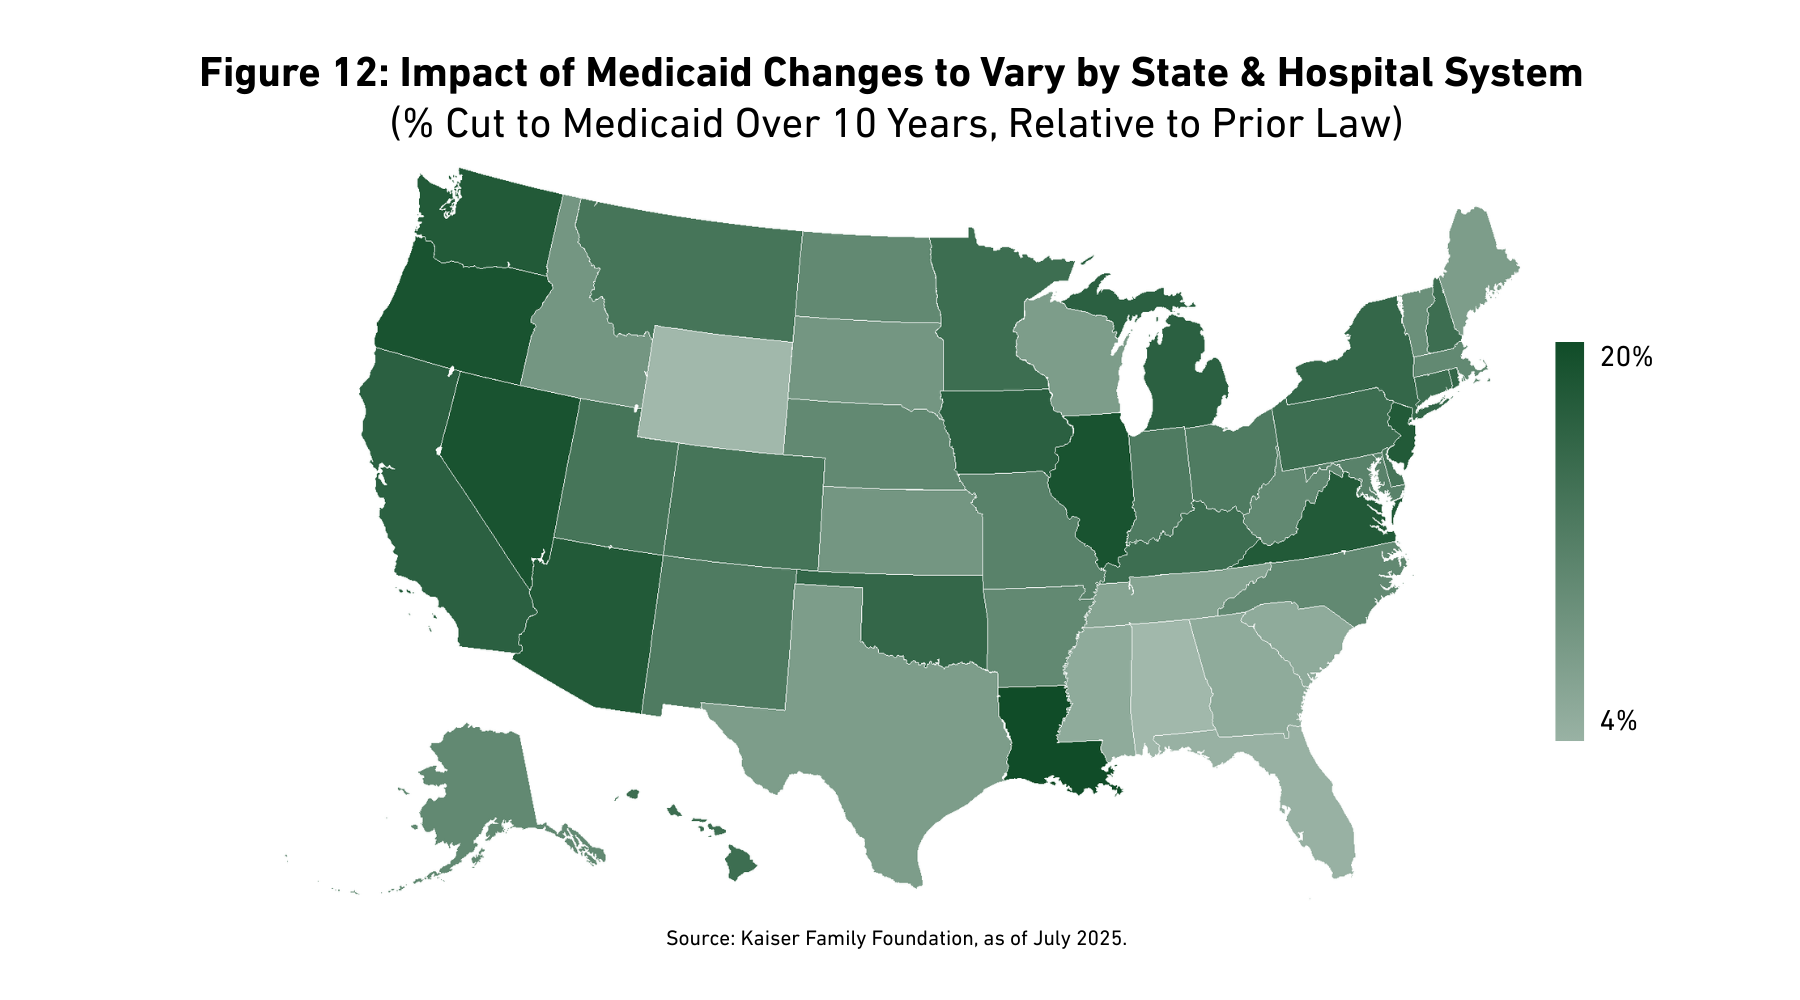
Hospitals. Non-profit hospital margins stabilized in 2025.16 However, the federal reconciliation bill enacted in July 2025 alters Medicaid eligibility rules, places limits on state-directed payments, and did not renew enhanced Affordable Care Act (ACA) subsidies, among other changes.17 Together, these provisions hint at a more austere revenue outlook for hospitals. The impact is likely to vary by region and hospital (See Figure 12). Congress may soften some of the changes.18 However, hospitals with high concentrations of Medicaid and ACA-exchange patients seem more vulnerable, over the medium-term.
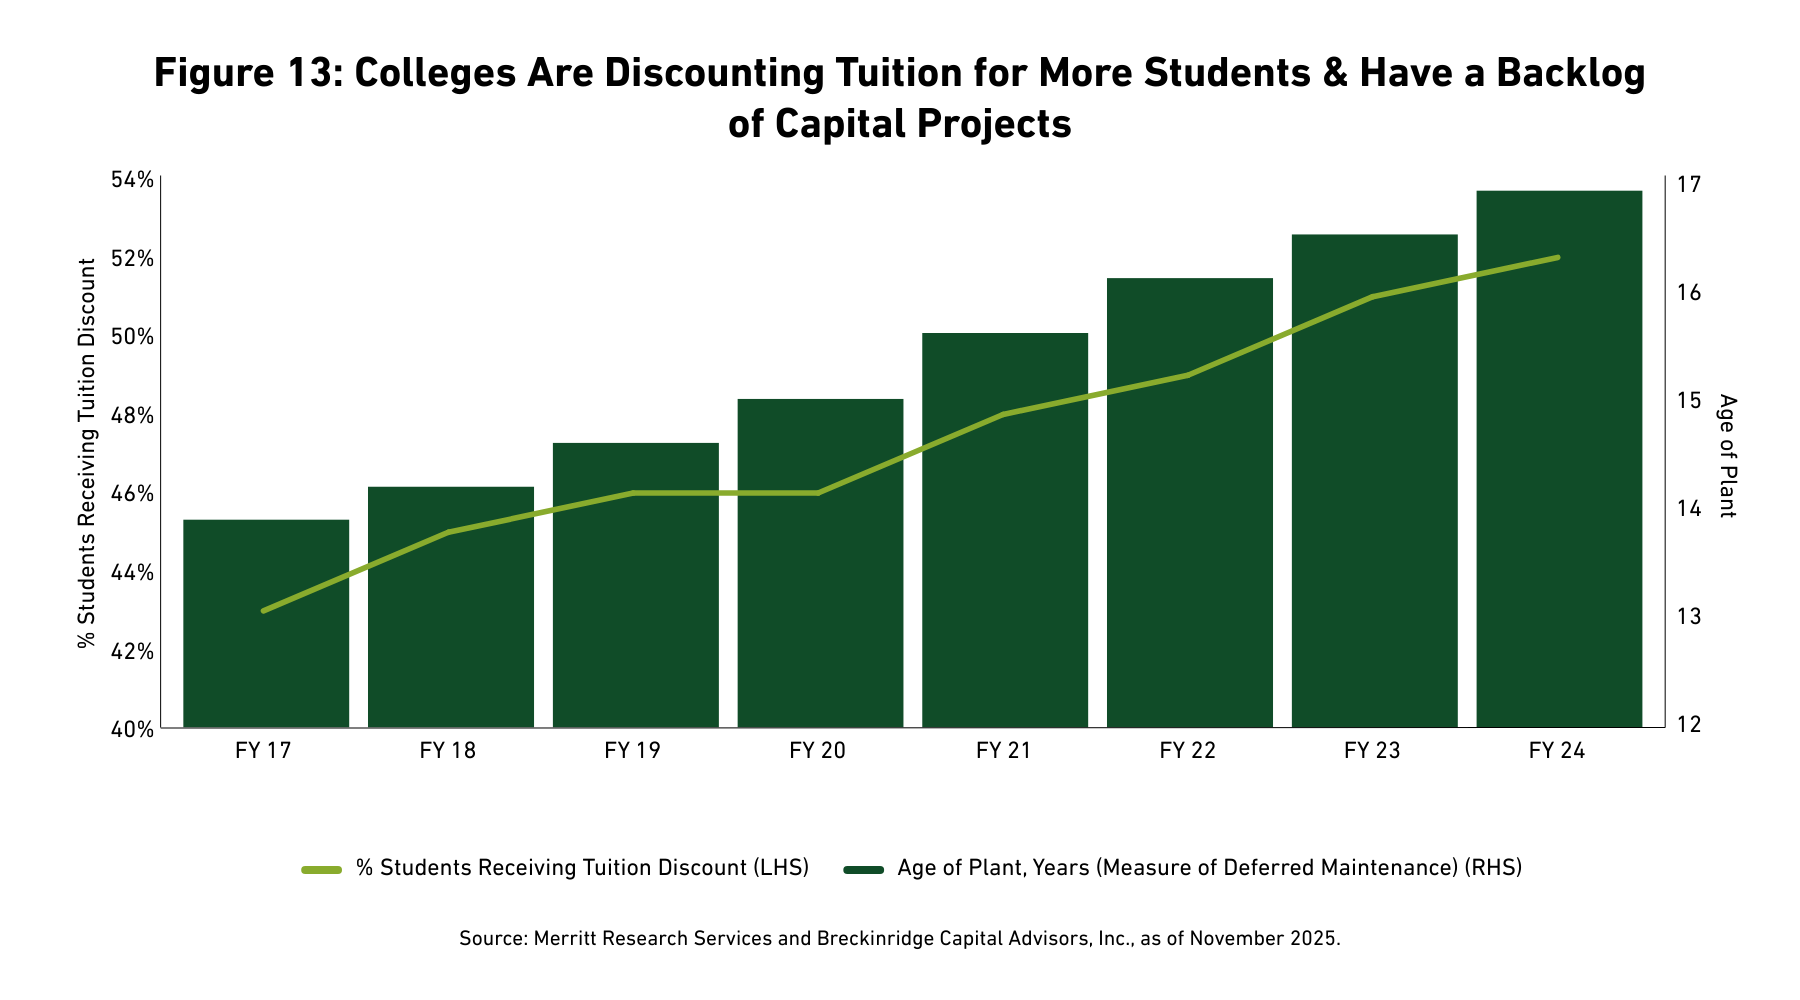
Higher education. Federal policy has exacerbated latent risks facing colleges and universities, including greater competition, deferred maintenance, weak demographic trends, and a weaker overall value proposition (See Figure 13). Restrictive student-immigration policies and cuts to research and development funding, in particular, may negatively impact some higher ed issuers. (See Material Policy Headwinds for Private Higher Ed are Likely Manageable Investment Risks). We expect most university bond issuers ranked investment grade (IG) to muddle through the current environment and note that several colleges have recently settled lawsuits with the federal government.19 But, headwinds for this sector seem reasonably entrenched.20
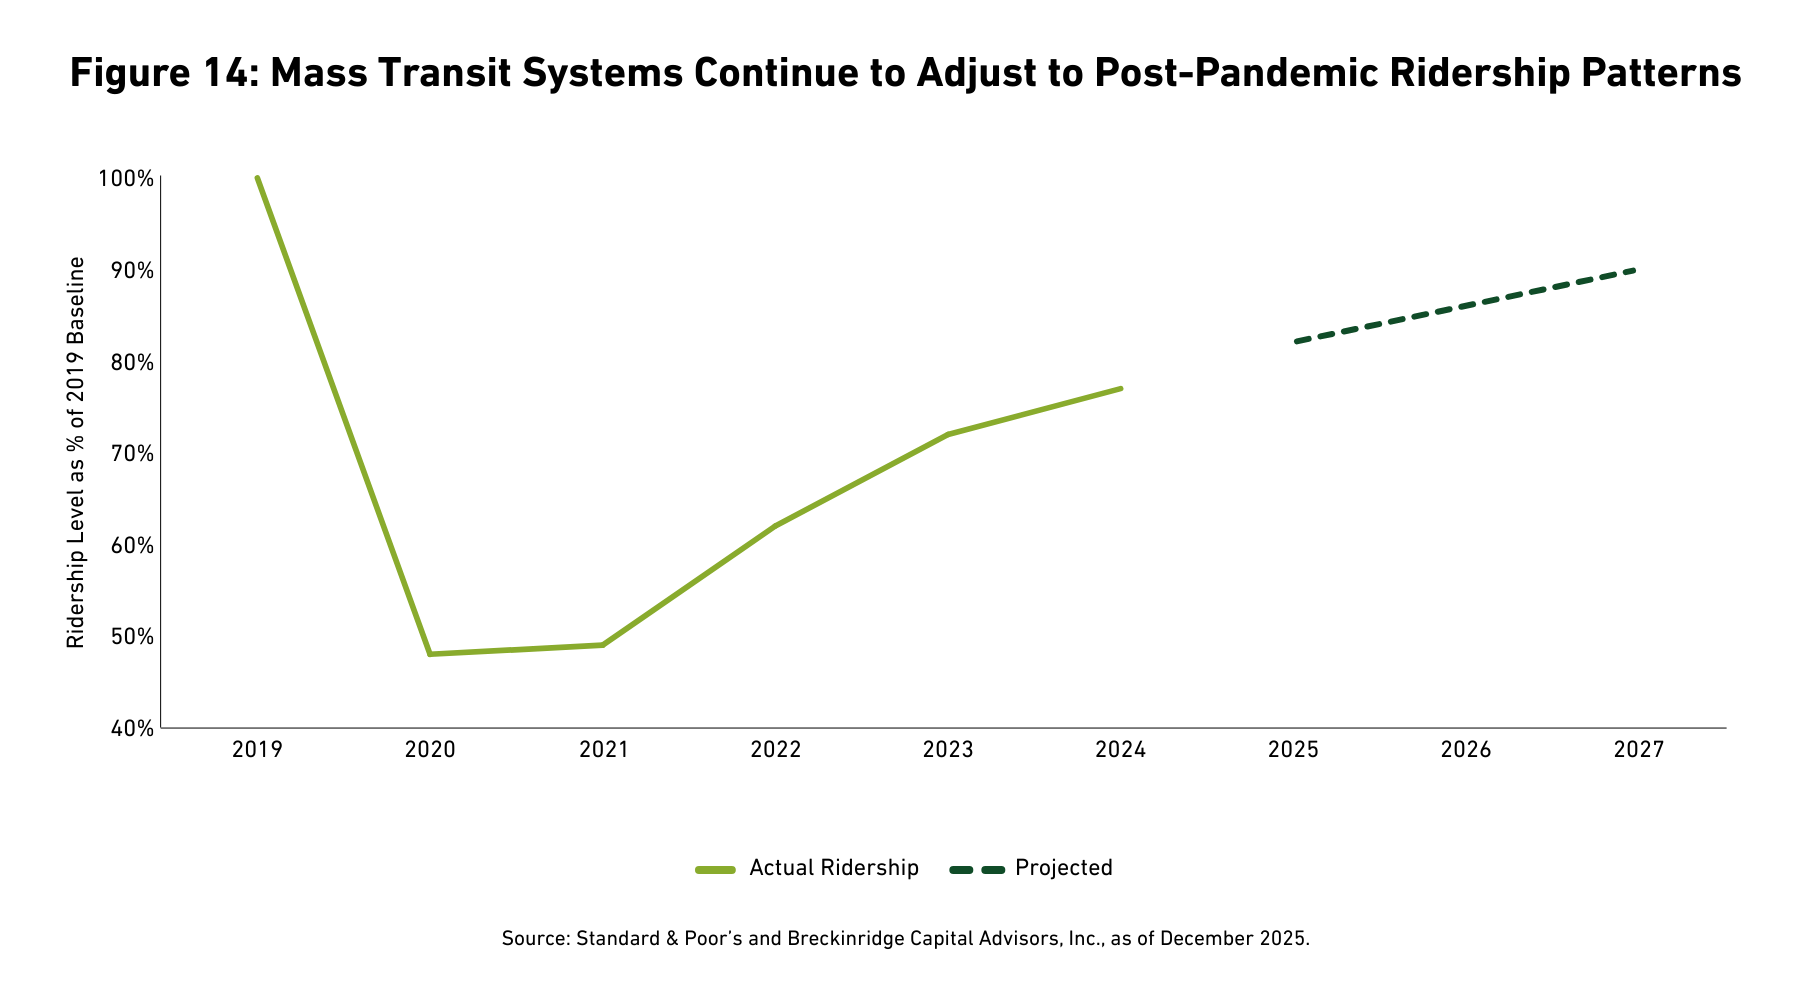
Mass transit. The New York Metropolitan Transportation Authority or NYMTA, the nation’s largest mass transit system, was upgraded in 2025.
However, nationally, transit ridership remains subdued (See Figure 14). San Francisco voters may refuse to raise taxes for mass transit in 2026.21 Dallas area communities are rethinking whether membership in a transit system makes sense.22 Philadelphia’s transit authority has redirected capital dollars to maintain operations.23 Federal aid to transit providers may be reduced in next year’s surface transportation bill.24 For now, we remain wary of mass transit securities backed solely by farebox revenue but are confident in structures backed by dedicated taxes.
Away from specific sectors, we are monitoring several cross-sectoral risks that could influence ratings, including:
-
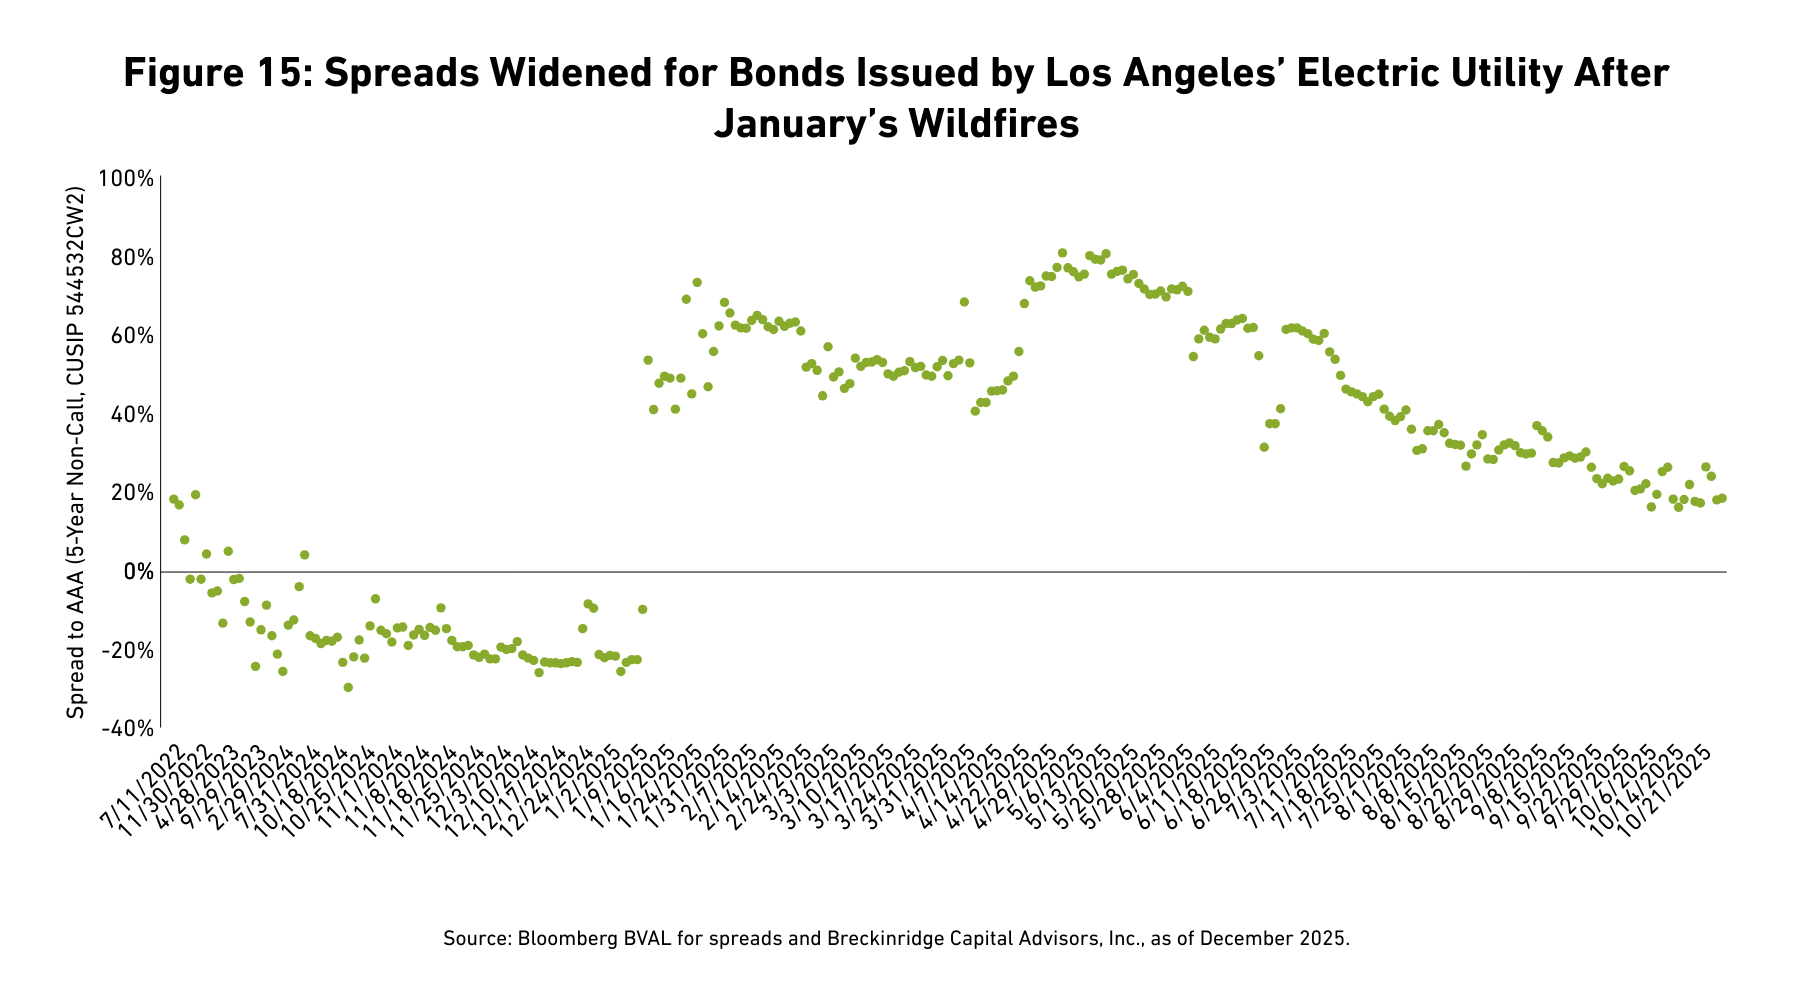
Climate risk. In 2025, S&P assigned a negative outlook to the Corpus Christi, TX, water utility on acute water scarcity concerns and lack of near-term plans for addressing the issue. Moody’s questioned Miami-Dade County, FL’s ability to withstand a Category 5 hurricane.25 The Trump administration slowed Federal Emergency Management Administration (FEMA)-related disaster payments in some instances.26 The market also penalized some Los Angeles, CA-area credits after L.A.’s January wildfires (See Figure 15).27 Breckinridge recently enhanced its portfolio management system to more precisely account for muni climate risk in tax-efficient sustainable portfolios.
- Property tax reform and affordability issues, generally. The increase in home prices since the pandemic, coupled with rising electricity demand and the need to update aging water systems, has led to a multi-year increase in property tax collections and utility inflation (See Figure 16). In response, voter support for further tax increases or utility rate hikes may wane. Notably, since 2024, 18 states have considered legislation to significantly curtail or eliminate property taxes.28
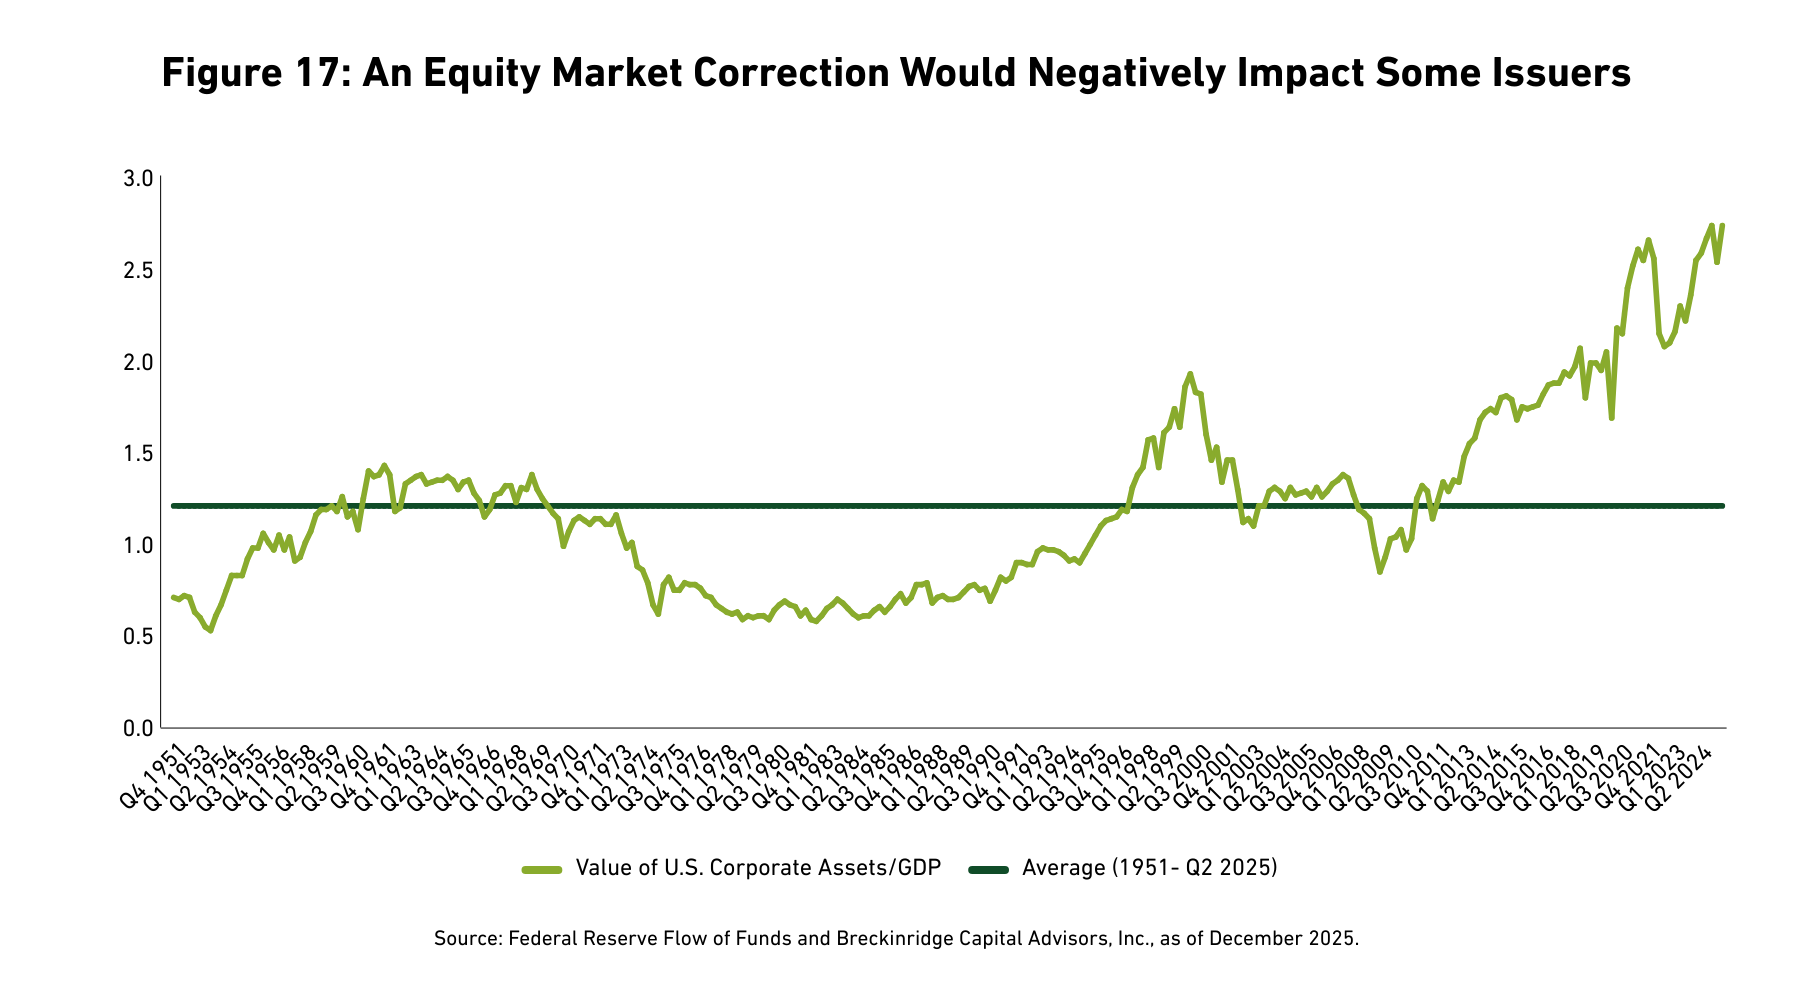
- Equity markets. Stock prices are at historic highs relative to the size of the economy, as measured against GDP (See Figure 17). A reassessment of the value of AI stocks could lead to a correction and a ratings downgrade for California or other issuers with exposure to pension funds or endowments (See CA Credit and the Risk of an AI Bubble). A market correction might also result from an uptick in inflation expectations and/or an associated rise in long-term interest rates.
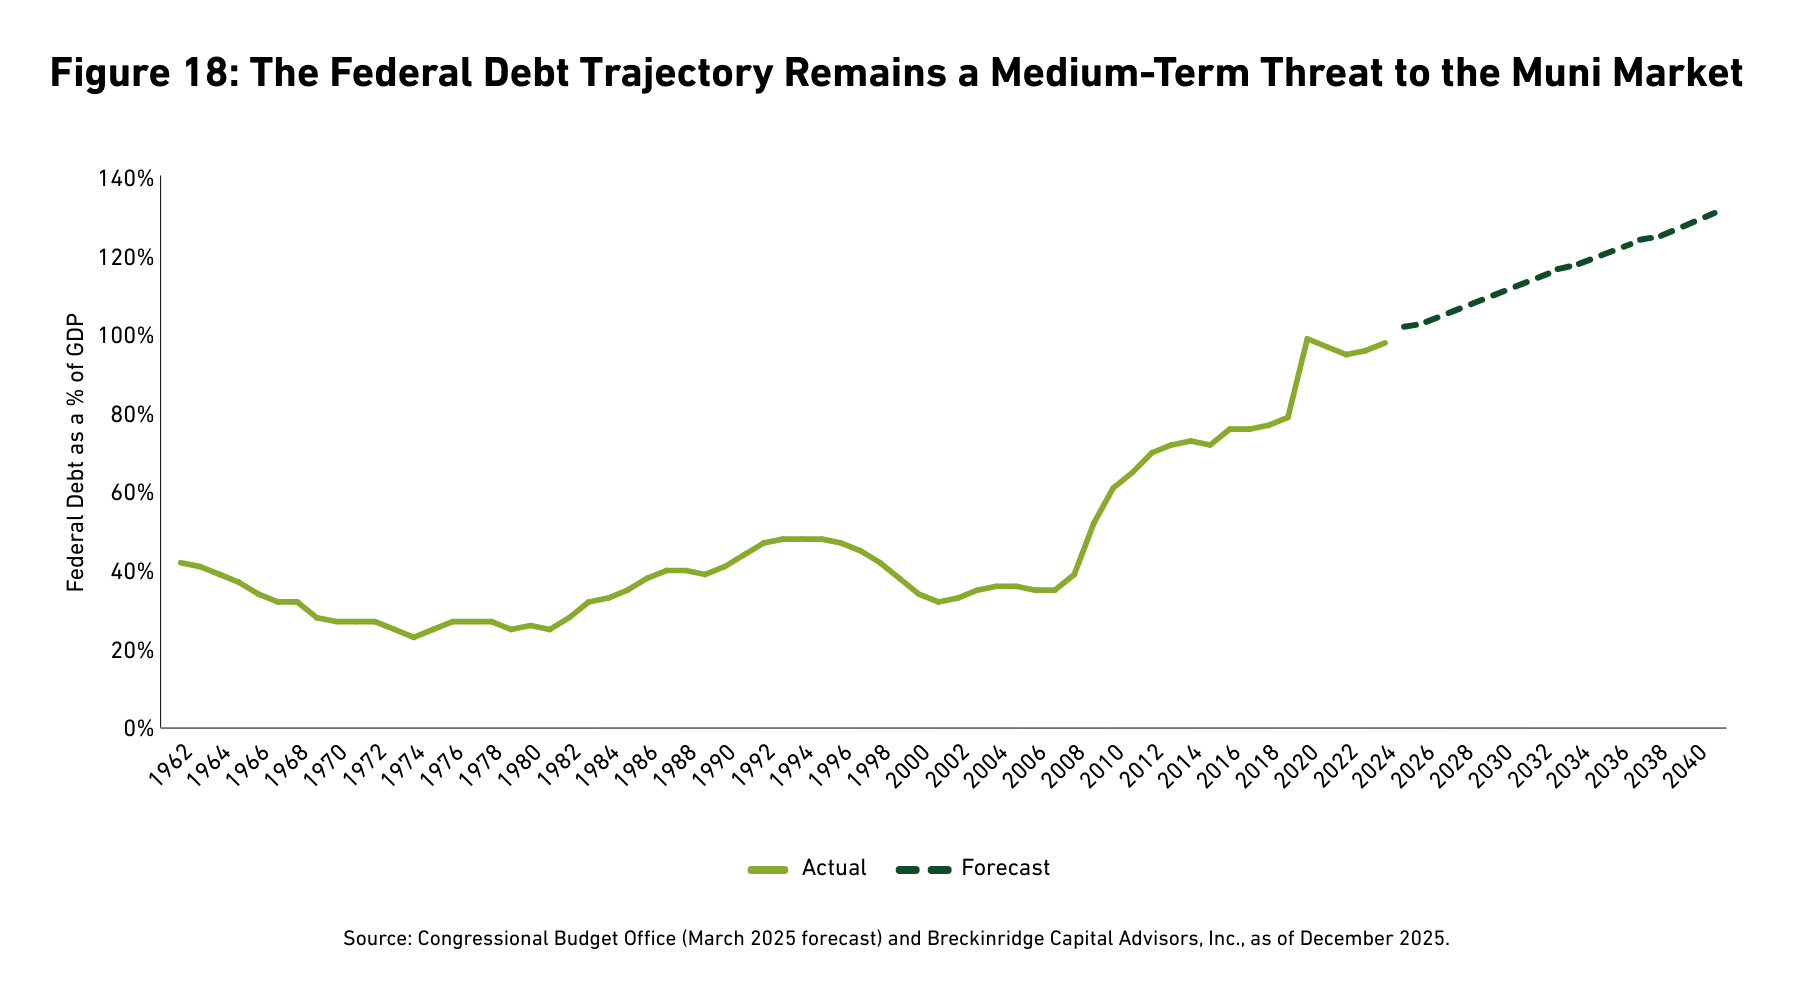
- Federal policy risk. Federal budget cuts are less of a risk in 2026 given November elections and recent talks to restore expiring healthcare subsidies.29 Also, unlike last year, there is little risk that Congress tinkers with the tax exemption for municipal interest. However, executive branch regulatory risk remains elevated. Strict immigration enforcement and planned federal layoffs may again reduce employment and growth prospects for some issuers 30 (for more detail see last year’s Outlook and our Mid-year Outlook). Persistent federal deficits also remain a medium-term risk insofar as they threaten tax certainty and the reliability of state aid flows (See Figure 18).
TECHNICALS
Demand
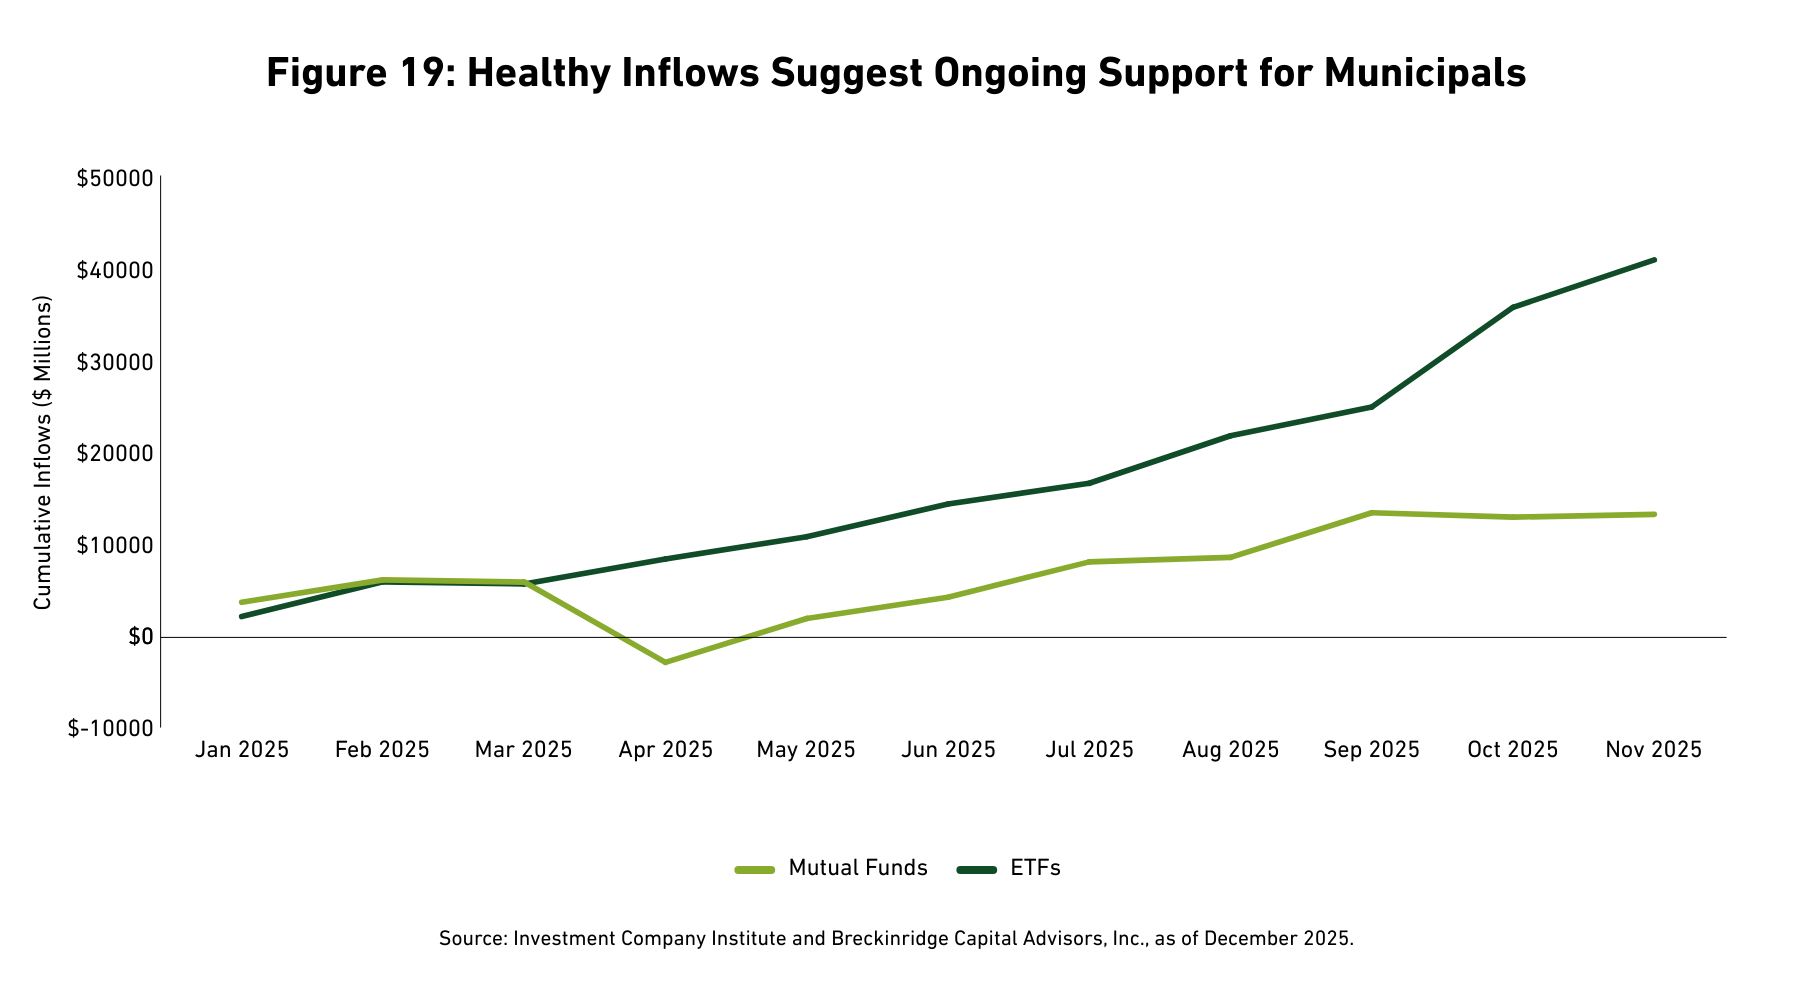
Flows into SMAs were strong in 2025. Mutual funds and exchange-traded funds (ETFs) also experienced inflows (See Figure 19). Demand was largely consistent throughout the year, and the market absorbed another year of heavy supply, despite reduced reliance on institutional buyers. Banks and insurers were net sellers of municipal bonds throughout most of 2025.31
We expect a similar demand picture in 2026 for a few reasons.
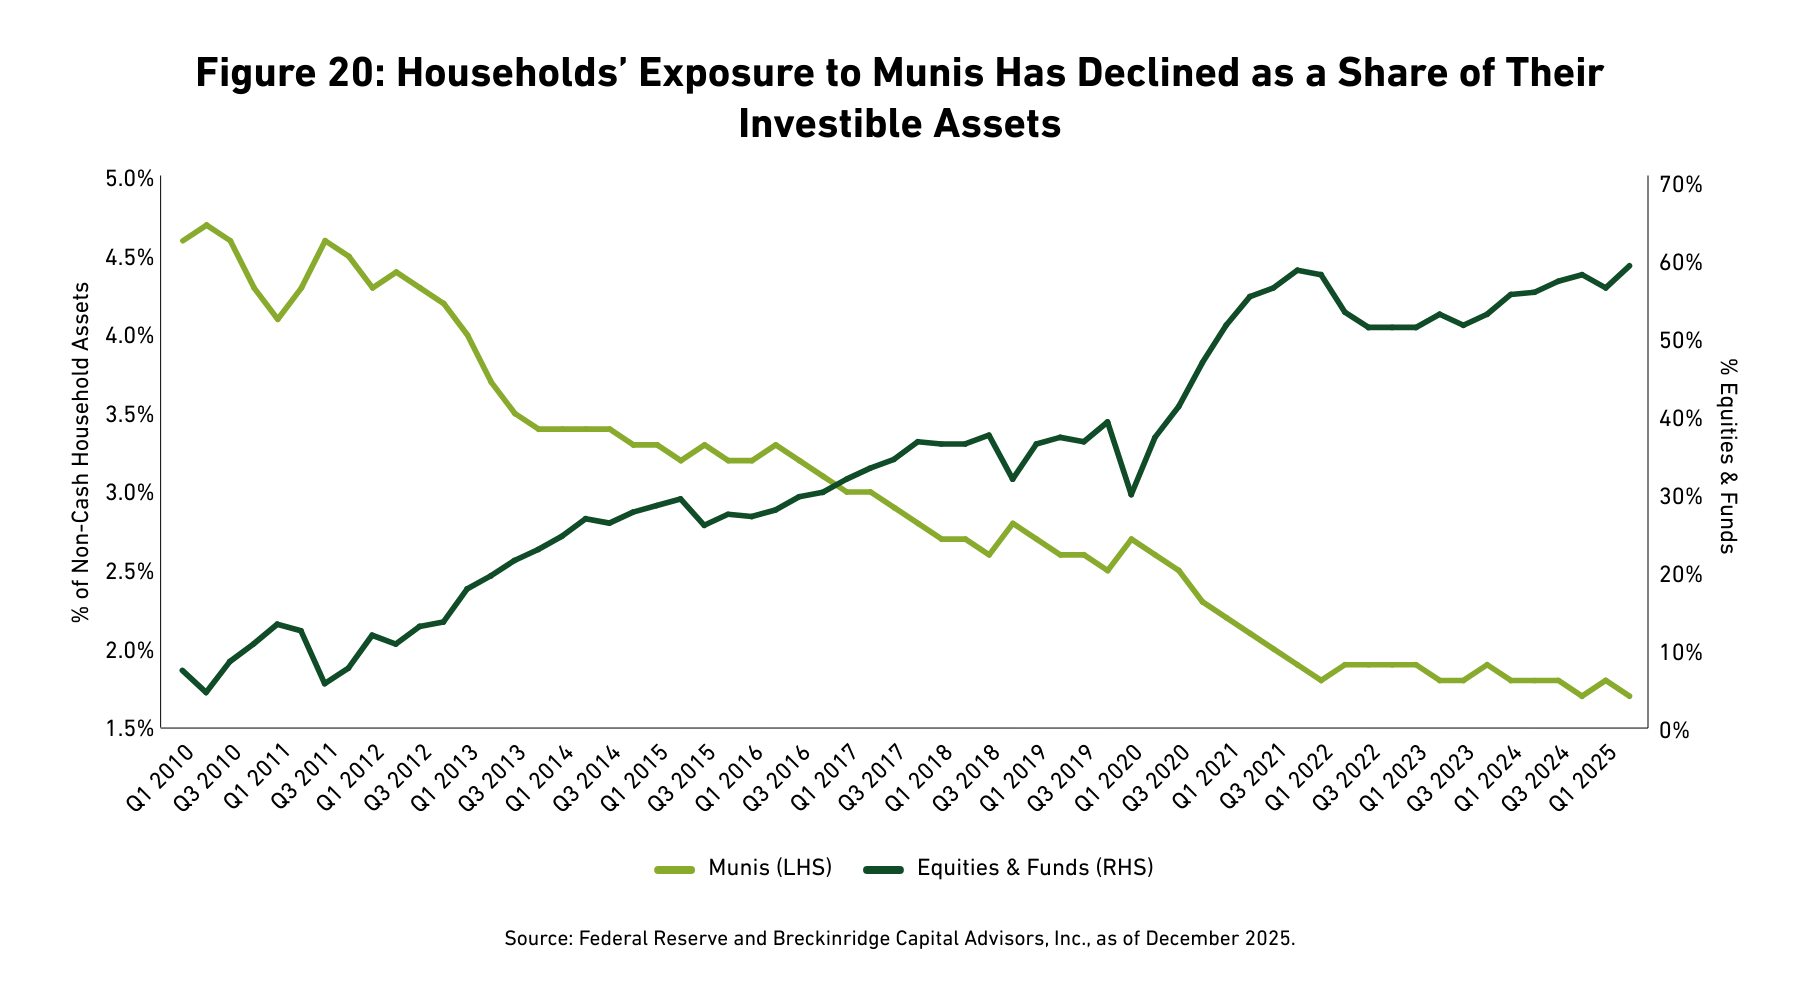
First, after several years of strong equity returns, retail investors are now underweight municipal bonds compared to prior years (See Figure 20).32 Some investors are likely to rebalance their portfolios.
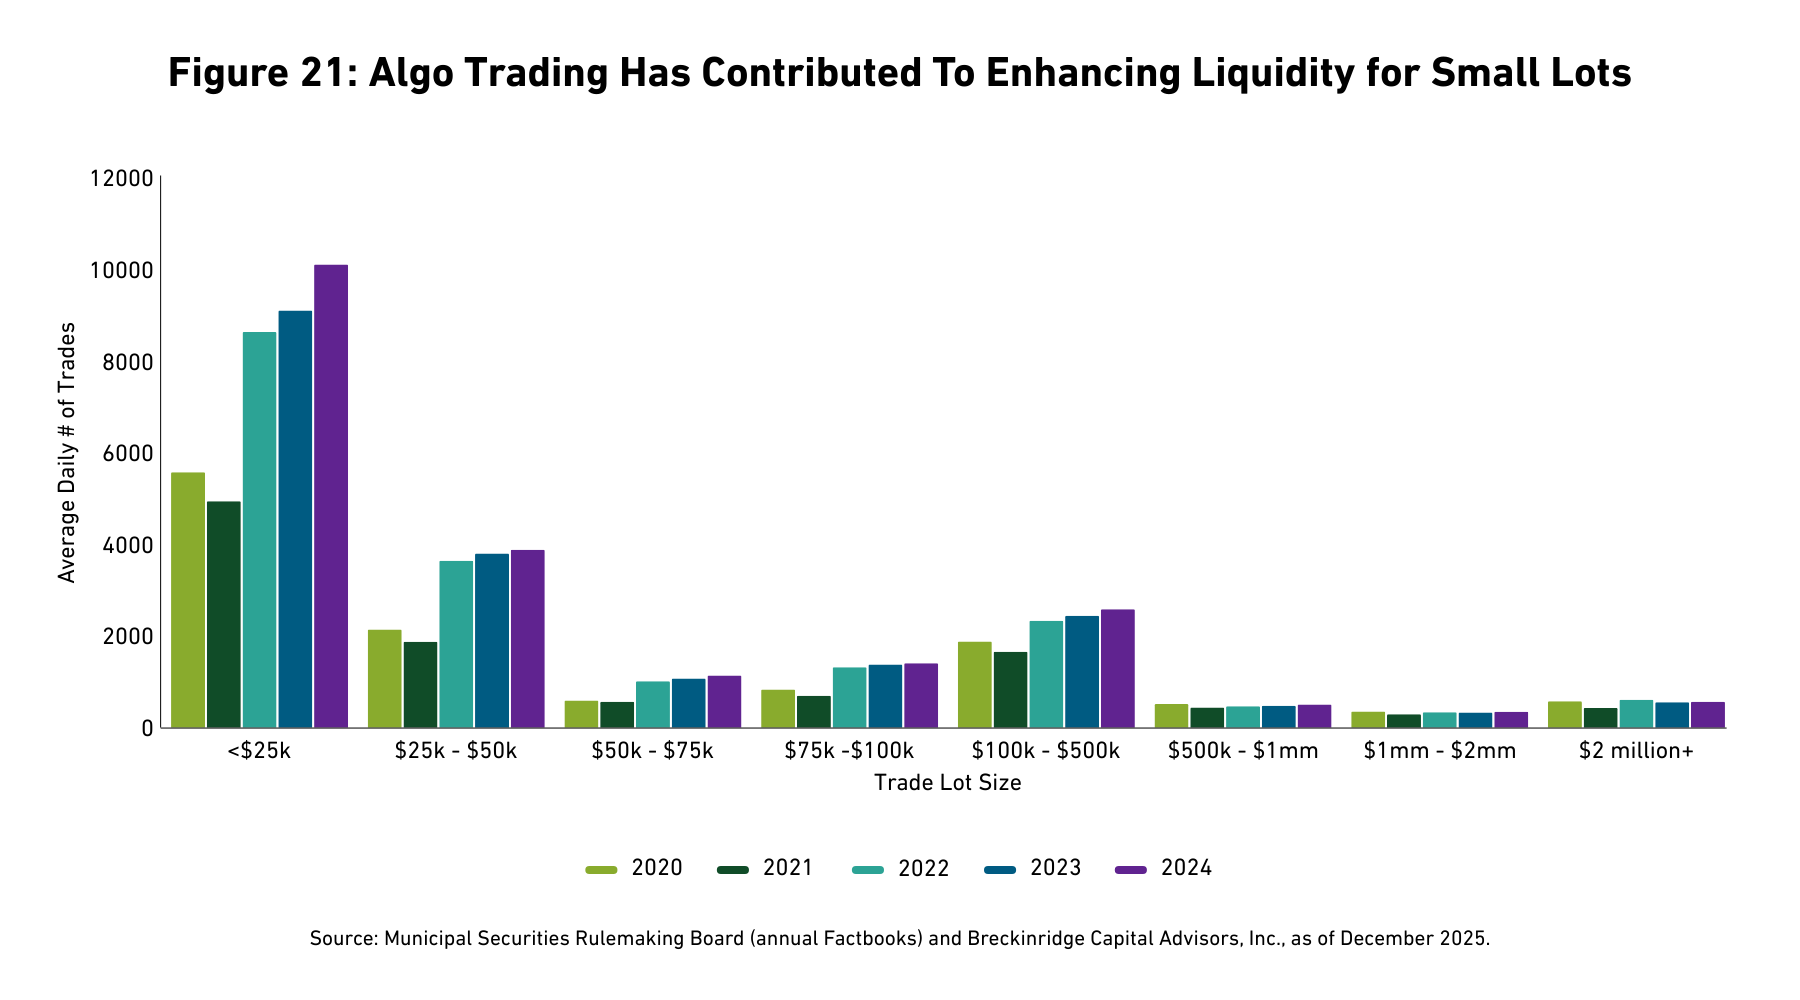
Second, liquidity continues to improve for small lot sizes, which underpin many lower-balance SMAs (See Figure 21). Better liquidity has come against the backdrop of less participation in the market from institutional investors. This fact suggests that advances in algorithmic (algo) trading (coupled with solid credit fundamentals) have resulted in a more durable demand structure.
Third, as we have outlined in previous Outlooks, aging demographics in the U.S. and a growing investor preference for SMAs are tailwinds for municipal demand. Aging investors tend to have tax liabilities and a need for a tax-advantaged, reliable, and transparent income stream.
Supply
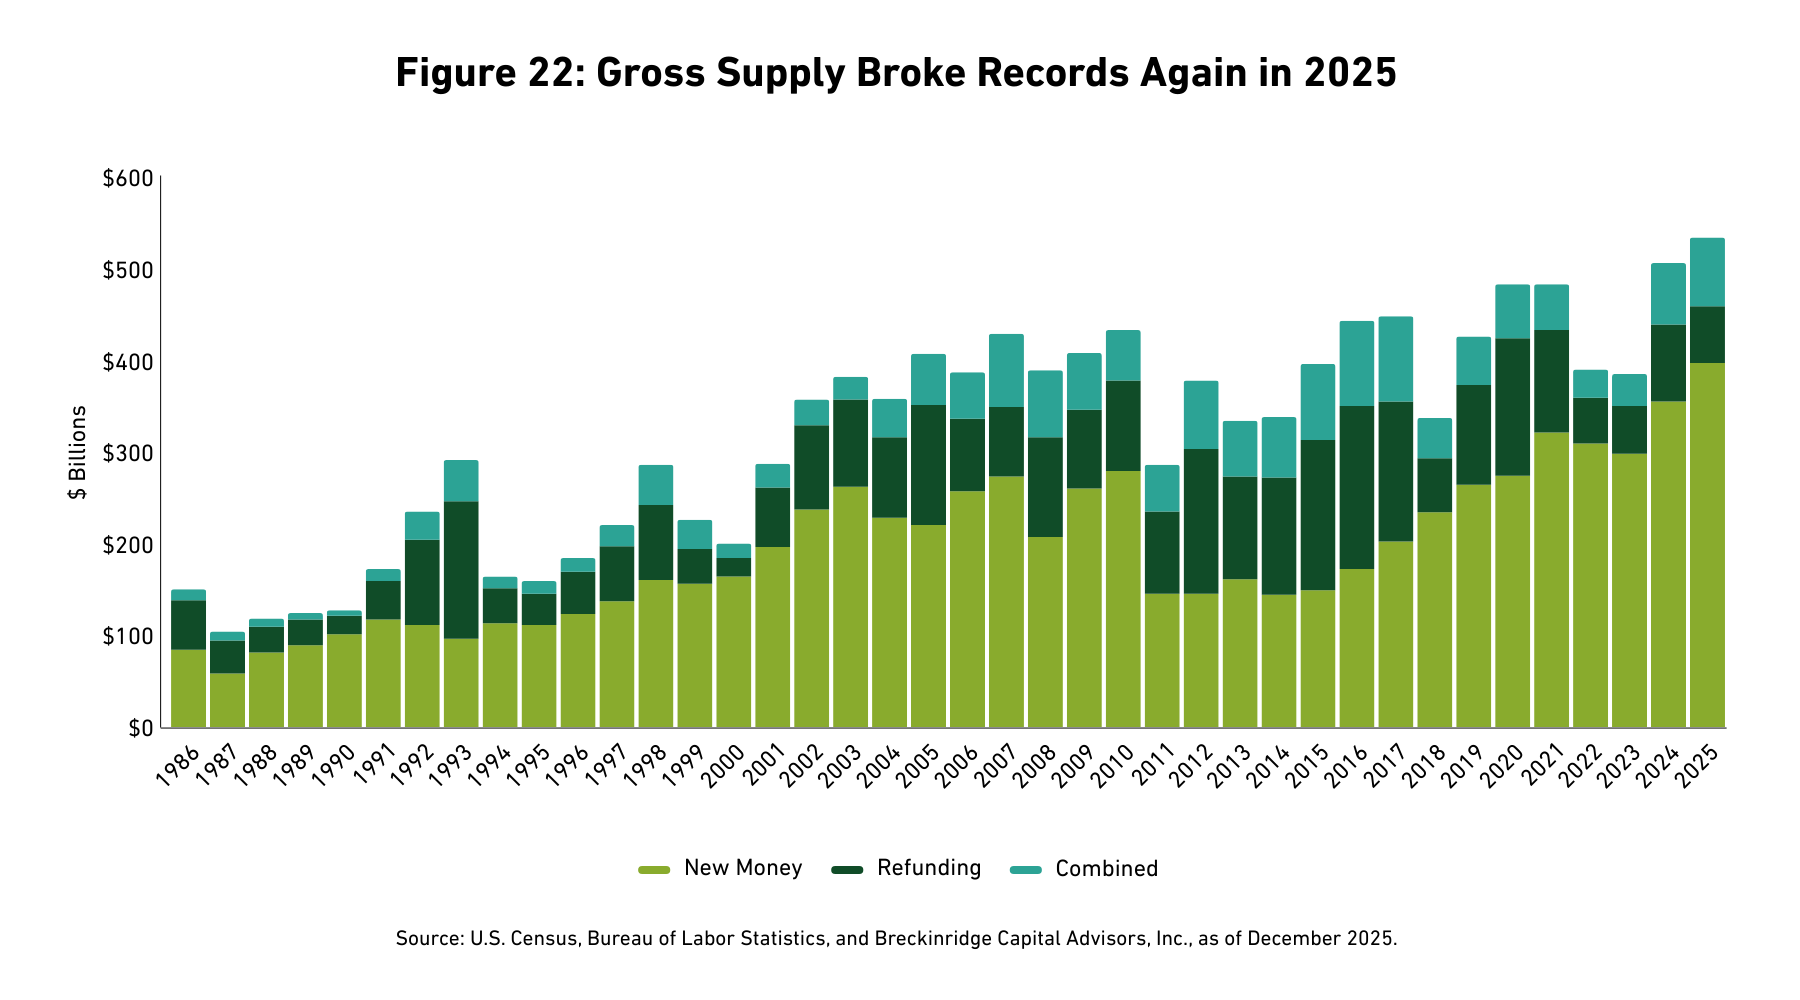
Supply exceeded records for a second consecutive year in 2025 (See Figure 22). Early in the year, some issuers sought to lock-in tax exempt borrowing, fearing it might be eliminated in last summer’s reconciliation bill. Universities borrowed to bolster their balance sheets in the face of regulatory headwinds.33 Inflation increased the cost of projects, and more issuers opted to debt-finance capital projects, as pandemic-era support and reserves have now been spent in many places.
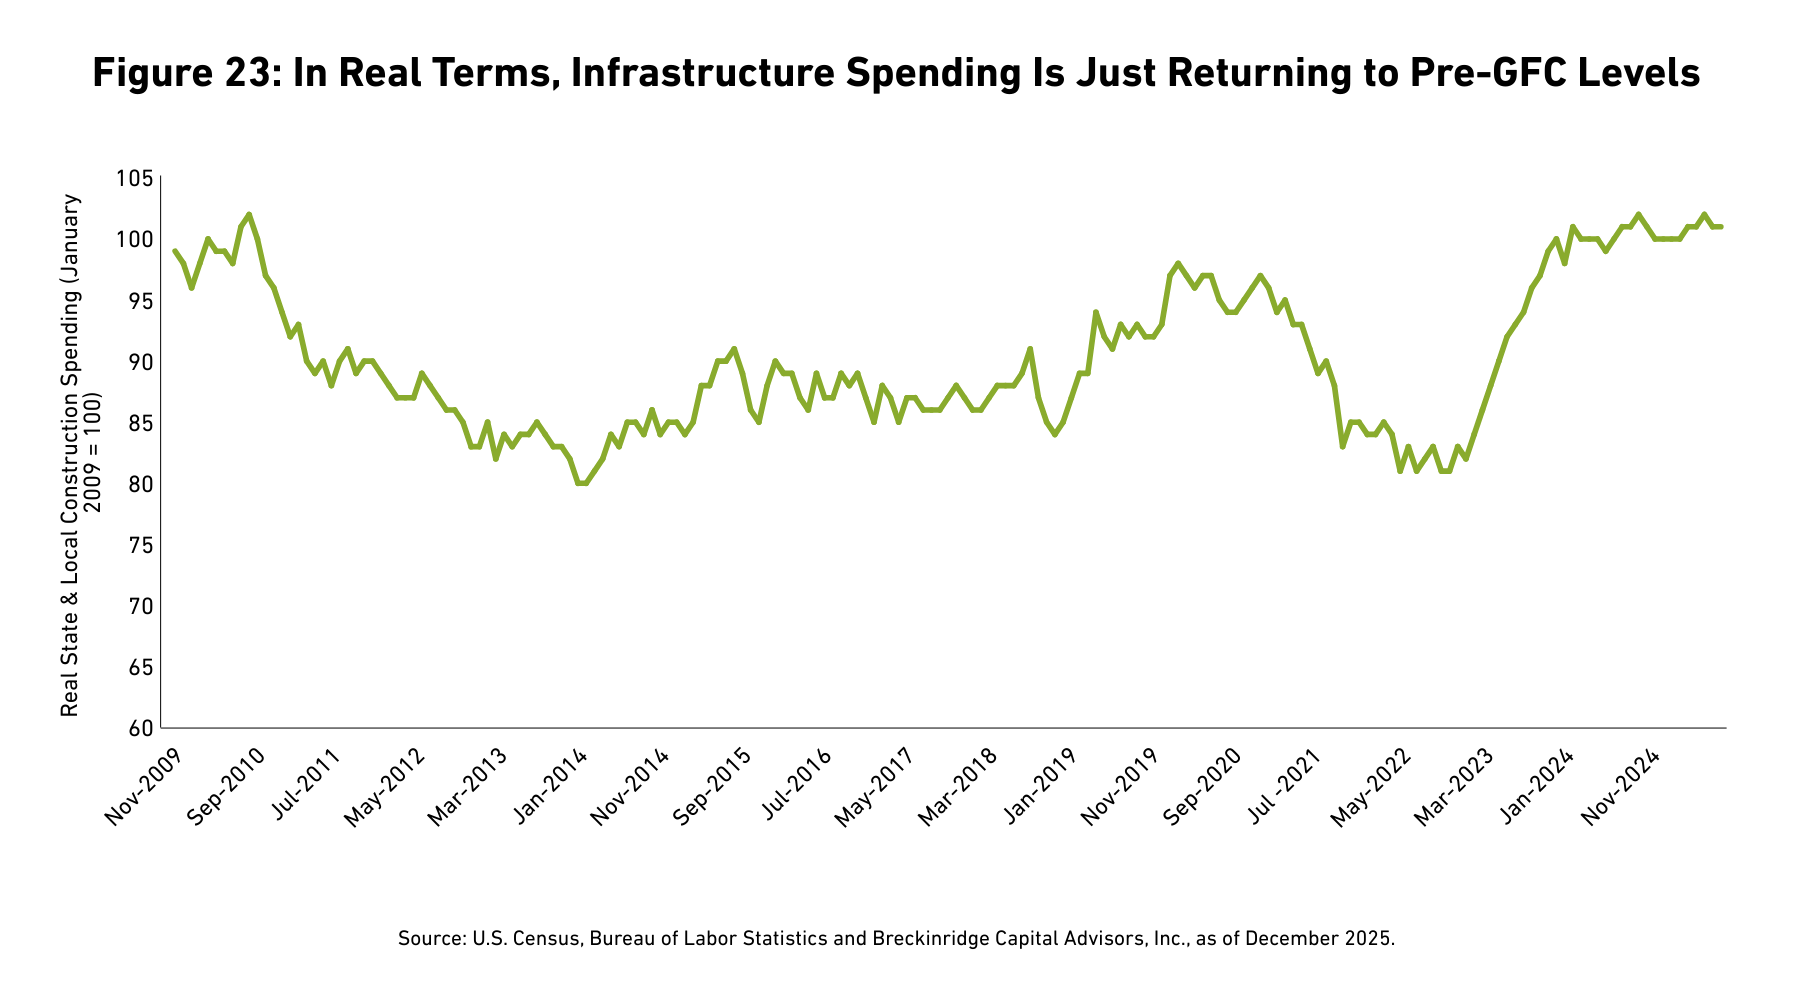
We anticipate a modest increase in supply in 2026. Federal retrenchment in healthcare, K-12 public education, and mass transit may cause some issuers to reevaluate projects. However, issuers have plenty of built-up cap spending needs. State and local construction spending has barely grown in real terms since 2009 (See Figure 23). Voters continue to approve bond referenda at a reasonable clip.34
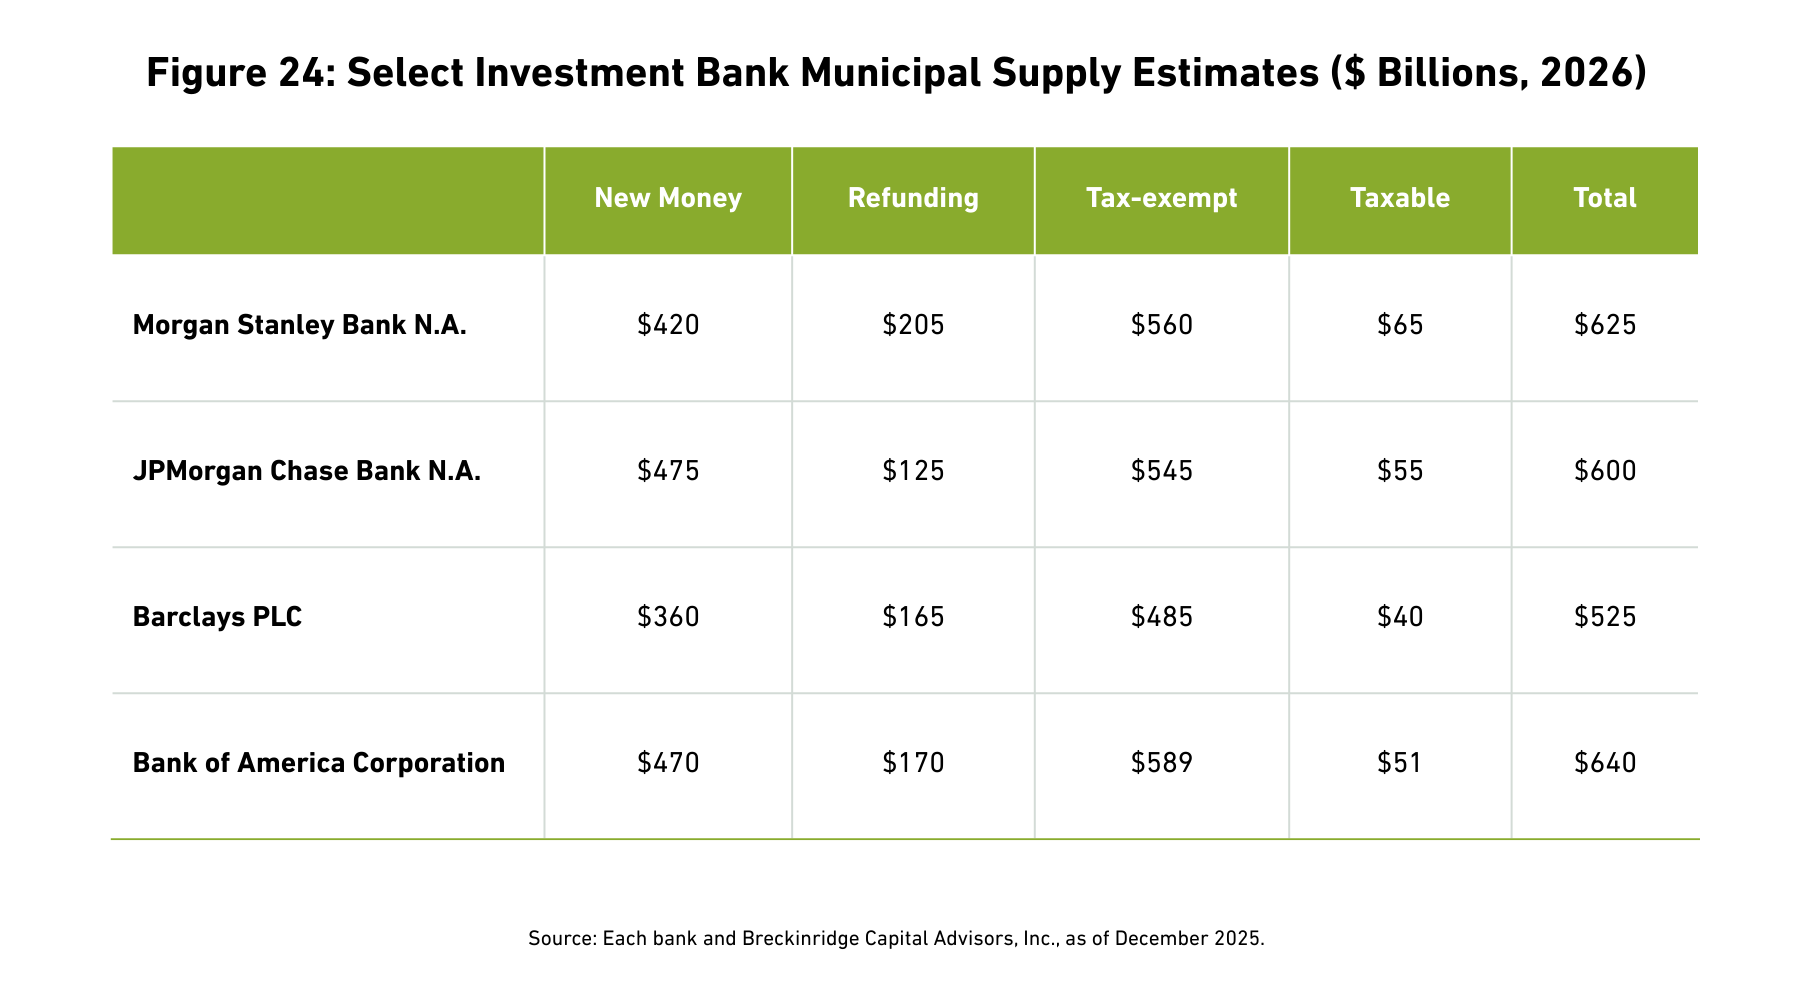
Additionally, if the economy weakens and issuers delay projects, the impact for supply could be limited. The Federal Reserve would likely lower interest rates, spurring more refundings. Supply estimates from major investment banks support the idea that issuance will grow, a bit, next year (See Figure 24).
VALUATIONS
Given our view that upward ratings migration may have peaked, we believe there is potential for wider and more volatile credit spreads in 2026. Spreads remain at the lower end of their post-Great Financial Crisis (GFC) range, and they were remarkably stable during the latter half of 2025 (See Figure 25).

From a sector perspective, local government debt may provide less value relative to essential service revenue bonds in 2026. As discussed above, the school district sector is experiencing headwinds. States are likely to be stingier with municipal aid given the austere Medicaid and ACA-subsidy environment. A property tax backlash is brewing in some regions. Opportunistic purchases of well-run hospital systems, transportation names, and housing bonds may be possible during weeks of heavy supply.
M/T ratios remain somewhat low heading into 2026 (See Figure 26). However, we anticipate an uptick in ratio volatility in the coming months, for several reasons. First, there is a lack of consensus at the Fed over whether (and how much) to cut interest rates. Second, we could be wrong about a modest supply expansion. If supply breaks records again next year, a persistent back-up in ratios is quite possible. The uncertainty should favor a bit more tactical buying in tax-efficient accounts. For example, there may be more opportunities for crossover purchases (buying taxable Treasuries or municipals in tax-efficient accounts when the after-tax math warrants).
In terms of duration, we favor a neutral approach for portfolios, given mixed economic data and the Fed’s unsettled view on interest rates.35 However, the yield curve steepened in 2025, and in our view, there remains incrementally more value in the 10- and 15-year parts of the curve relative to two- and five-year maturities (See Figure 27).

Importantly, tax-free municipal yields remain at the higher end of their range over the past 15 years. For investors in high tax brackets, we believe high-grade exempt municipals continue to complement risk taking elsewhere in client portfolios (See Figure 28).
[1] The Municipal/Treasury (M/T) ratio compares yields of municipals bonds with those of U.S. Treasury bonds of the same maturity. M/T ratios can show the relative value of municipal bonds compared with taxable bonds, by indicating when yields for municipal bonds exceed the after-tax yields on taxable bonds.
[2] Half of states budgeted for a 0 percent increase in general fund spending growth in fiscal year 2026 (FY26). National Conference of State Legislatures (NCSL) Staff, “State Budgets in Transition as Revenue Slows and Surpluses Shrink,” National Conference of State Legislatures, November 11, 2025.
[3] Connecticut: from Aa3 to Aa2 from Moody’s Investors Service (Moody’s), Illinois: from A3 to A2 from Moody’s, New Jersey: from A to A+ from S&P Global Ratings (S&P) and from A1 to Aa3 from Moody’s.
[4] Note that 24 states are projecting lower general fund spending in FY26 compared to FY25. The median annual growth rate in state general fund budgets was 0 percent for FY26. See the National Association of State Budget Officers’ Spring Fiscal Survey of the States, 2025.
[5] Breckinridge analysis of Bloomberg U.S. Municipal Bond Index, November 2025.
[6] Breckinridge analysis of FY24 audited financial statements, per Merritt Research Services for over 7,000 cities, counties, and school districts, November 2025.
[7] Breckinridge analysis of Federal Reserve data.
[8] Breckinridge analysis of Bureau of Transportation data, through September 2025.
[9] Seasonally adjusted figures. Breckinridge analysis of Bureau of Transportation data, through August 2025.
[10] Aviation Week Network’s 2026 Commercial Fleet & MRO forecast.
[11] Moody’s maintains a negative outlook on U.S. ports on tariff and lower container volume. However, we are a bit more confident in the sector. We note that, per audited financial statements, the median days cash on hand for several of the largest ports was 1.072 days in FY24 (inclusive of Port of Los Angeles, Long Beach Harbor Dept., Corpus Christi, Port of Houston, Hawaii Harbor, South Carolina Ports Authority, and Georgia Ports).
[12] “U.S. Mortgage Revenue Bond Program Medians: Credit Stability Reinforced by Strong Management During Program Expansion,” Standard & Poor’s, October 2025. The ratio of MBS to whole loans for S&P-rated single family loan pools was 76:24 in FY24.
[13] The term impaired refers to bonds with a missed a payment, where a reserve fund has been used, a covenant has been violated, or similar. See Municipal Market Analytics definitions as of November 2025.
[14] The term "safe sector" is associated with traditional, essential service municipal bonds like local general obligation debt, water-sewer revenue bonds, and dedicated tax obligations, among others. Notice of default dated June 2, 2025. Available via Electronic Municipal Market Access (EMMA) website.
[15] “2026 K-12 School District Outlook – Negative as total sector funding stalls while expense growth persists,” Moody’s Investors Service, November 2025.
[16] Monthly Kaufman Hall National Hospital Flash Reports, data through September 2025. The median hospital margin was 1.9% February 2024 through January 2025. It has been 2.6% since then (through September 2025).
[17] “Medicaid Implementation Dates for the 2025 Budget Reconciliation Law,” Kaiser Family Foundation,” August 22, 2025.
[18] At the time of this publication, several competing bills were floating around Congress. See: “This House GOP centrist is plotting a new health care bill aimed at winning over Trump,” Politico, November 21, 2025.
[19] For example, Northwestern University, Columbia University, Cornell University, Brown University, and the University of Virginia, among others. See Ben Unglesbee, Laura Spitalniak, and Natalie Schwartz “Tracking the Trump administration’s deals with colleges.” October 22, 2025.
[20] Notably, a recent article suggests the long-term employment advantage to a college degree might be waning. See Alexander Cline and Baris Kaymak, “Are Young College Graduates Losing Their Edge in the Job Market?” Federal Reserve Bank of Cleveland, November 24, 2025.
[21] Dan Walters, “Bay Area transit measure will test voters’ taste for higher sales taxes,” CallMatters.com, October 22, 2025.
[22] Lilly Kersh, “Voter Revolt Could Reshape Public Transit in North Texas,” Governing.com, November 7, 2025; “Governor Signs Bill Authorizing Bay Area Voters to Consider 2026 Transit Measure,” Metropolitan Transportation Commission, October 13, 2025.
[23] Cory Sharber, “SEPTA CEO calls Pennsylvania State Budget ‘Disappointing’ After Transit Funding Left Out,” WHYY Philadelphia, Nov. 13, 2025.
[24] The current funding is set to expire on September 30, 2026, per the Infrastructure Investment and Jobs Act. See “Roadmap to Reauthorization”.
[25] “Corpus Christi, TX Utility System Revenue Debt Rating Outlook Revised to Negative from Stable, Standard & Poor’s, October 24, 2025; “Miami Cat-5 storm would test economy and insurance market even with federal aid,” Moody’s Investors Service, September 2025.
[26] DeCesaro and Labowitz, “The Trump Administration is Quietly Curbing the Flow of Disaster Funding,” Carnegie Endowment for International Peace, September 19, 2025.
[27] Webster and Lerner, “Los Angeles wildfires bring wider spreads, downgrade for DWP,” The Bond Buyer, January 2014, 2025. .
[28] “Property Tax Relief and Reform,” Tax Foundation.
[29] Cheyenne Haslett and Jordain Carney, “Trump wants a health care deal. He’s leaving the details to Congress.” Politico.com, December 4, 2025.
[30] We believe the most impacted issuers are certain local governments, k-12 schools, ports, higher education providers, and hospitals. Regions with significant federal employment still remain at risk, as well. A recent executive order, Ensuring Continued Accountability in Federal Hiring, commits the federal government to trimming the workforce by four employees for each new person hired/.
[31] Breckinridge analysis of Federal Reserve Data. The Household sector, a proxy for SMAs, purchased a net $359 billion in municipal bonds in Q1 and Q2 2025. Banks and insurers sold a net $2.7 billion. Per the Fed Flow of Funds, Table F. 212.
[32] We note that a 1 percent increase in the share household non-cash assets held in munis translates into an additional $1.1 trillion in municipal holdings, per the Fed Flow of Funds, Table. 101, Q2-2025.
[33] Amanda Albright and Elizabeth Rembert, “Harvard, MIT Lead Elite Colleges’ $4 billion Debt Spree After Trump Threat,” Bloomberg, May 28, 2025.
[34] SchoolBondFinder.com. The 2025 bond referenda passage rate is 75%, nearly identical to 2023 and 2024.
[35] Nick Timiraos, “Fed Officials Spar Over Whether Rate Cuts Risk Credibility on Inflation,” Wall Street Journal, December 12, 2025.
BCAI-12192025-5byn0amf (12/22/2025)
DISCLAIMERS:
The content is intended for investment professionals and institutional investors.
This material provides general information and should not be construed as a solicitation or offer of services or products or as legal, tax or investment advice. Nothing contained herein should be considered a guide to security selection, asset allocation or portfolio construction.
All information and opinions are current as of the dates indicated and are subject to change. Breckinridge believes the data provided by unaffiliated third parties to be reliable but investors should conduct their own independent verification prior to use. Some economic and market conditions contained herein have been obtained from published sources and/or prepared by third parties, and in certain cases have not been updated through the date hereof.
There is no assurance that any estimate, target, projection or forward-looking statement (collectively, “estimates”) included in this material will be accurate or prove to be profitable; actual results may differ substantially. Breckinridge estimates are based on Breckinridge’s research, analysis and assumptions. Other events that were not considered in formulating such projections could occur and may significantly affect the outcome, returns or performance.
Not all securities or issuers mentioned represent holdings in client portfolios. Some securities have been provided for illustrative purposes only and should not be construed as investment recommendations. Any illustrative engagement or sustainability analysis examples are intended to demonstrate Breckinridge’s research and investment process.
Yields and other characteristics are metrics that can help investors in valuing a security, portfolio or composite. Yields do not represent performance results but they are one of several components that contribute to the return of a security, portfolio or composite. Yields and other characteristics are presented gross of advisory fees.
All investments involve risk, including loss of principal. No investment or risk management strategy, including diversification, can guarantee positive results or risk elimination in any market. Periods of elevated market volatility can significantly impact the value of securities. Investors should consult with their advisors to understand how these risks may affect their portfolios and to develop a strategy that aligns with their financial goals and risk tolerances.
Active investing generally involves more risks than laddered strategies because active managers may take on greater market risk to outperform their index. There is no guarantee that either passive or active investing will achieve their objectives. Active strategies also tend to have higher management fees and operating costs than passive strategies. Investors should consider all the differences and risks before making any investment decisions. Active management does not guarantee a profit or protect against a loss.
Past performance is not indicative of future results. Breckinridge makes no assurances, warranties or representations that any strategies described herein will meet their investment objectives or incur any profits. Performance results for Breckinridge’s investment strategies include the reinvestment of interest and any other earnings, but do not reflect any brokerage or trading costs a client would have paid. Results may not reflect the impact that any material market or economic factors would have had on the accounts during the time period. Due to differences in client restrictions, objectives, cash flows, and other such factors, individual client account performance may differ substantially from the performance presented.
Actual client advisory fees may differ from the advisory fee used to calculate net performance results. Client returns will be reduced by the advisory fees and any other expenses incurred in the management of their accounts. For example, an advisory fee of 1 percent compounded over a 10-year period would reduce a 10 percent return to a 9 percent annual return. Additional information on fees can be found in Breckinridge’s Form ADV Part 2A.
Index results are shown for illustrative purposes and do not represent the performance of any specific investment. Indices are unmanaged and investors cannot directly invest in them. They do not reflect any management, custody, transaction or other expenses, and generally assume reinvestment of dividends, income and capital gains. Performance of indices may be more or less volatile than any investment strategy.
Fixed income investments have varying degrees of credit risk, interest rate risk, default risk, and prepayment and extension risk. In general, bond prices rise when interest rates fall and vice versa.
Equity investments are volatile and can decline significantly in response to investor reception of the issuer, market, economic, industry, political, regulatory or other conditions.
There is no guarantee that integrating sustainability factors, including those associated with climate risks, will improve risk-adjusted returns, lower portfolio volatility over any specific time period, or outperform the broader market or other strategies that do not utilize sustainability factors when selecting investments. The consideration of sustainability factors may limit investment opportunities available to a portfolio. In addition, sustainability data often lacks standardization, consistency and transparency and for certain companies such data may not be available, complete or accurate.
When considering sustainability factors, Breckinridge's investment team will include those factors that they believe are material. However, the investment team may conclude that other attributes outweigh these considerations when making investment decisions. Breckinridge can change its sustainability analysis methodology at any time.
Breckinridge’s sustainability analysis is based on third party data and Breckinridge analysts’ internal analysis. Analysts will review a variety of sources such as corporate sustainability reports, data subscriptions, and research reports to obtain available metrics for internally developed frameworks. Qualitative information is obtained from company reports, engagement discussion with corporate management teams, among others.
Breckinridge believes the data provided by unaffiliated third parties, including rating agencies, to be reliable but investors should conduct their own independent verification prior to use. Some economic and market conditions contained herein have been obtained from published sources and/or prepared by third parties, and in certain cases have not been updated through the date hereof. All information contained herein is subject to revision. Any third-party websites included in the content has been provided for reference only, and does not necessarily indicate an endorsement.
BLOOMBERG® is a trademark and service mark of Bloomberg Finance L.P. and its affiliates (collectively “Bloomberg”). Bloomberg does not approve or endorse this material or guarantees the accuracy or completeness of any information herein, or makes any warranty, express or implied, as to the results to be obtained therefrom and, to the maximum extent allowed by law, neither shall have any liability or responsibility for injury or damages arising in connection therewith.
The S&P500 Index (“Index”) and associated data is a product of S&P Dow Jones Indices LLC, its affiliates and/or their licensors and has been licensed for use by Breckinridge. © 2025 S&P Dow Jones Indices LLC, its affiliates and/or their licensors. All rights reserved. Redistribution or reproduction in whole or in part are prohibited without written permission of S&P Dow Jones Indices LLC. For more information on any of S&P Dow Jones Indices LLC’s indices please visit www.spdji.com. S&P® is a registered trademark of Standard & Poor’s Financial Services LLC (“SPFS”) and Dow Jones® is a registered trademark of Dow Jones Trademark Holdings LLC (“Dow Jones”). Neither S&P Dow Jones Indices LLC, SPFS, Dow Jones, their affiliates nor their licensors (“S&P DJI”) make any representation or warranty, express or implied, as to the ability of any index to accurately represent the asset class or market sector that it purports to represent and S&P DJI shall have no liability for any errors, omissions, or interruptions of any index or the data included therein.