Investing
Commentary published on April 12, 2023
March 2023 Market Commentary
Summary
- U.S. Treasury Curve: U.S. Treasury yields fell across the curve, and the curve was less inverted (See Figure 1).
- Municipal Market Technicals: With monthly bond issuance 30 percent lower than March 2022, municipal bonds earned one of the highest monthly returns in more than a decade.
- Corporate Market Technicals: Investment grade (IG) corporate bond issuance was $100 billion, down $54 billion from the prior month. IG bond fund inflows fell to $3 billion.
- Securitized Trends: Asset-Backed Securities (ABS) and Mortgage-Backed Securities (MBS) had positive total returns and negative excess returns, based on Bloomberg data.
(The following commentary is a summary of discussions among members of the Breckinridge Capital Advisors Investment Committee as they reviewed monthly activity in the markets and investment returns. The members of the Investment Committee under the leadership of Chief Investment Officer Ognjen Sosa, CAIA, FRM, are Co-Head of Portfolio Management, Matthew Buscone; Senior Portfolio Manager Sara Chanda; Co-Head of Research, Nicholas Elfner; Co-Head of Portfolio Management, Jeffrey Glenn, CFA; Head of Trading, Benjamin Pease; and Co-Head of Research, Adam Stern, JD.)
Market Review
Concerns arose about the U.S. Financial sector, following government take-over of two regional banks. The events sparked a flight to quality that benefited highly-rated corporate and municipal bonds. Treasury yields fell sharply, per Bloomberg (See Figure 1). The curve was less inverted by month end.

The Federal Reserve (Fed), demonstrating continued resolve to slow inflation, increased the fed funds interest rate by 25 basis points (bps) to a target range of 4.75 percent to 5.00 percent at its March 21 and 22 meeting. Fed fund futures indicated a terminal fed funds rate of 5.1 percent by year-end, down from 5.4 percent at the end of February.
As the market priced in rate cuts by the summer, a disconnect reemerged between market yields and the Fed dot plot, based on media reports of market sentiment and Fed meeting minutes.
The Fed also cut its expectations for real gross domestic product (GDP) growth to 0.4 percent for the year. In addition, in a reversal of its COVID pandemic-related quantitative easing program, the Fed continues quantitative tightening efforts, allowing Treasury bonds and MBS to mature without replacing them.
Banking sector concerns emerged in early March. Asset sales by some banks to meet accelerating depositor withdrawals severely weakened their liquidity positions. In response, regulators assumed responsibility for operating Silicon Valley Bank and Signature Bank of New York.
Fed Chairman Powell said that events in the Banking sector, “are likely to result in tighter credit conditions for households and businesses, which would in turn affect economic outcomes.” If realized, the credit tightening likely would contribute to the Fed’s efforts to cool economic growth and inflation. Chairman Powell said it was “too soon to tell” how monetary policy might be managed in light of the potential conditions.
Volatility in March increased, as measured by the ICE/Bank of America Merrill Lynch MOVE Index,1 which measures bond market volatility expectations (See Figure 2). After spiking to over at 5.07 percent on March 8, the 2-year Treasury yield ended March near 4.03 percent. The 10-year closed the month at 3.47 percent.

The Bloomberg U.S. Treasury Bond Index2 gained nearly 2.9 percent for March and 3 percent for the first quarter. The Bloomberg U.S. Aggregate Bond Index3 was 2.5 percent higher for March and nearly 3 percent in the quarter. The S&P 500 Index4 added 3.5 percent in March and 7 percent for the quarter ended March 31.
Our base case continues to call for a no growth to mild recession scenario for the rest of 2023 and early 2024. Increased bank regulation, pressure on interest margins, and deposit outflows from regional banks are a negative for bank credit fundamentals and will accelerate implementation of tighter lending standards that may contribute to a slowdown of economic growth.
Municipal Market Review
Municipal bond yields tracked Treasuries and fell over the month (See Figure 3). Two-year yields fell 57bps, five-years by 42bps, 10-years by 32bps, and 30-years by 26bps.
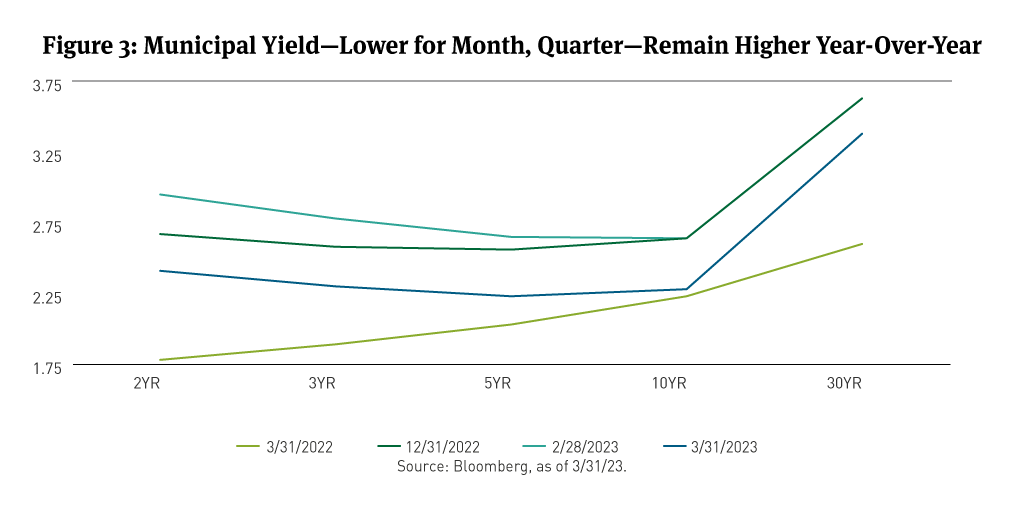
The historically uncharacteristic curve inversion from two to 10 years (2s/10s curve) persisted, although it decreased to 11bps.
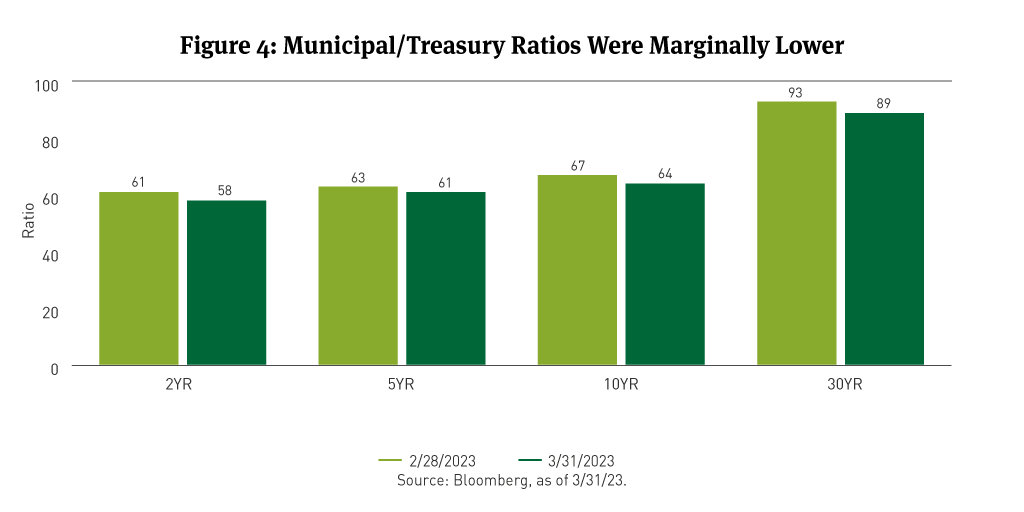
Muni/Treasury (M/T) Ratios improved from mid-February levels, closing the month at 58, 61,64, and 89 for 2, 5, 10, and 30 years, respectively (See Figure 4).
Municipal bond returns, as measured by the Bloomberg Municipal Bond Index, were the highest in 15 years for the month of March, which is a month typically associated with lower performance amid outflows to cover tax payments. The positive return completes a volatile quarter for month-to-month total returns (See Figure 5). In our view, perhaps the wide-ranging returns reflected shifting investor sentiment, with economic data wavering between appearances that inflation was declining and, then, that it was persistent.

The Bloomberg Managed Money Short/Intermediate (1-10) Index5 gained 2.2 percent and the Bloomberg 1-10 Year Municipal Bond Blended Index6 added 1.8 percent. Longer-maturity bonds outperformed shorter-maturity issues. Lower-rated bonds outperformed higher quality.
March returns were supported by the ongoing low issuance trend, a characteristic of the municipal market during the last 24 months. Borrowing costs in the higher interest rate environment are contributing, as are broadly healthy financial positions among many municipal issuers, in our view.
The Bond Buyer reported that municipal bond issuance in March was $31.8 billion, down 30 percent year-over-year (Y/Y) but higher month-over-month (M/M). Tax-exempt municipal bond issuance was about 25 percent lower Y/Y, while taxable municipal bond issuance was down approximately 31 percent for the same period, after having been 54 percent lower Y/Y during February. Lipper data showed municipal bond mutual fund outflows of nearly $1.4 billion in March.
Corporate Market Review
Investment grade (IG) corporate bond spreads were 14bps wider, per Bloomberg data, ending March at 138bps. For March, the Bloomberg U.S. Corporate Investment Grade (IG) Index7 gained almost 2.8 percent on a total return basis, with a negative excess return of 42bps compared with duration-matched Treasuries.
At 138bps, the IG Corporate Index option-adjusted spread continues to suggest the pricing in of a soft landing for the U.S. economy rather than an economic recession, in our view based on historical spread data. March spread widening primarily reflected volatility associated with news from Banking, the largest sector in the IG corporate markets.
In our view, until the Government and financial regulators restore full confidence in the U.S. Banking system, Bank issuers will be focused primarily on their own balance sheets, shoring up liquidity, and considering capital raises as conditions settle. As lending standards tighten further, controllable lending activity from the Banking sector likely will slow materially, impacting credit creation and economic growth.
Per Bloomberg, the best-performing corporate sectors for the month ended March 31, 2023, were Restaurants, Wirelines, Food & Beverage, Pharmaceuticals, and Aerospace/Defense. The worst-performing were Life Insurance, Real Estate Investment Trusts, Brokerage & Asset Managers, Gaming, and Airlines.
Based on Bloomberg data, corporate bonds with longer maturities delivered the best total and excess returns. The highest rated bonds fared the best across the IG quality spectrum.
IG corporate supply for March was $100 billion, per Bloomberg data. IG fund flows in March were about $3 billion, well off the strong pace of the prior two months, per Emerging Portfolio Fund Research.
Securitized Market Review
In March, securitized markets delivered positive total returns and negative excess returns.
The Bloomberg MBS Index8 had a positive total return of 1.95 percent and a negative excess return of 1.11 percent. The most favorable total returns were among the 3 to 4.5 percent coupon conventional9 and Ginnie Mae10 securities. Excess returns were least negative among 5 and 5.5 percent coupon conventional issues and 4 and 5 percent coupon Ginnie Mae securities.
Bloomberg data showed Agency Commercial MBS (CMBS) earned a positive total return of 2.10 percent in March and a negative excess return of 91bps. CMBS had a positive total return of 1.09 percent and a negative excess return of 1.70 percent. Non-Agency CMBS total return was positive 20bps and excess return was negative 2.38 percent.
Within the ABS sector, securities backed by auto loans and credit cards earned positive total returns of 1.01 and 1.41, respectively, while excess returns were negative 54bps and 46bps, respectively, per Bloomberg.
[1] The MOVE Index measures U.S. interest rate volatility by tracking the movement in U.S. Treasury yield volatility implied by current prices of one-month over-the-counter options on 2-year, 5-year, 10-year and 30-year Treasuries. Historically, the index rises as concerns grow that interest rates are moving higher. You cannot invest directly in an index.
[2] The Bloomberg U.S. Treasury Bond Index is an unmanaged index of prices of U.S. Treasury bonds with maturities of 1 to 30 years. You cannot invest directly in an index.
[3] The Bloomberg U.S. Aggregate Bond Index is a broad-based benchmark that measures the investment-grade, U.S.-dollar-denominated, fixed-rate taxable bond market, including Treasuries, government-related and corporate securities, mortgage-backed securities (agency fixed-rate and hybrid adjustable-rate mortgage pass-throughs), asset-backed securities, and commercial mortgage-backed securities. You cannot invest directly in an index.
[4] The S&P 500 Index consists of 500 stocks chosen for market size, liquidity, and industry group representation. Itis a market-value-weighted index with each stock’s weight in the index proportionate to its market value. You cannot invest directly in an index.
[5] The Bloomberg Municipal Managed Money Short/Intermediate Index measures the performance of the publicly traded municipal bonds that cover the USD-denominated short/intermediate term tax-exempt bond market, including state and local general obligation bonds, revenue bonds, insured bonds, and pre-refunded bonds. It is rules-based, and market-value weighted. You cannot invest directly in an index.
[6] The Bloomberg Municipal 1-10 Year Blend 1-12 Year Index measures the performance of short and intermediate components of the Municipal Bond Index — an unmanaged, market value-weighted index which covers the U.S. investment grade, tax-exempt bond market. You cannot invest directly in an index.
[7] The Bloomberg U.S. Corporate Bond Index is an unmanaged market-value-weighted index of investment-grade corporate fixed-rate debt issues with maturities of one year or more. You cannot invest directly in an index.
[8] The Bloomberg MBS Index tracks agency mortgage-backed pass-through securities (both fixed-rate and hybrid ARM) guaranteed by Ginnie Mae (GNMA), Fannie Mae (FNMA), and Freddie Mac (FHLMC). The index is constructed by grouping individual pools into aggregates or generics based on program, coupon, and vintage. You cannot invest directly in an index.
[9] Conventional MBS are issued by the Federal National Mortgage Association and the Federal Home Loan Mortgage Corporation.
[10] Ginnie Mae MBS are issued by the Government National Mortgage Association.
# BCAI-04062023-2ja8faxz (4/12/2023)
DISCLAIMER:
This material provides general and/or educational information and should not be construed as a solicitation or offer of Breckinridge services or products or as legal, tax or investment advice. The content is current as of the time of writing or as designated within the material. All information, including the opinions and views of Breckinridge, is subject to change without notice.
Not all securities or issuers mentioned represent holdings in client portfolios. Some securities have been provided for illustrative purposes only and should not be construed as investment recommendations.
Past performance is not a guarantee of future results. Any index results shown are for illustrative purposes and do not represent the performance of any specific investment. Indices are unmanaged and investors cannot directly invest in them. They do not reflect any management, custody, transaction or other expenses, and generally assume reinvestment of dividends, income and capital gains. Performance of indices may be more or less volatile than any investment strategy.
All investments involve risk, including loss of principal. Diversification cannot assure a profit or protect against loss. No investment or risk management strategy can guarantee positive results or risk elimination in any market. Fixed income investments have varying degrees of credit risk, interest rate risk, default risk, and prepayment and extension risk. In general, bond prices rise when interest rates fall and vice versa. This effect is usually more pronounced for longer-term securities. Income from municipal bonds can be declared taxable because of unfavorable changes in tax laws, adverse interpretations by the IRS or state tax authorities, or noncompliant conduct of a bond issuer.
Separate accounts may not be suitable for all investors.
Certain third parties require us to include the following language when using their information:
BLOOMBERG® is a trademark and service mark of Bloomberg Finance L.P. and its affiliates (collectively “Bloomberg”). Bloomberg does not approve or endorse this material or guarantees the accuracy or completeness of any information herein, or makes any warranty, express or implied, as to the results to be obtained therefrom and, to the maximum extent allowed by law, neither shall have any liability or responsibility for injury or damages arising in connection therewith.
The S&P500 Index (“Index”) and associated data is a product of S&P Dow Jones Indices LLC, its affiliates and/or their licensors and has been licensed for use by Breckinridge. © 2023 S&P Dow Jones Indices LLC, its affiliates and/or their licensors. All rights reserved. Redistribution or reproduction in whole or in part are prohibited without written permission of S&P Dow Jones Indices LLC. For more information on any of S&P Dow Jones Indices LLC’s indices please visit www.spdji.com. S&P® is a registered trademark of Standard & Poor’s Financial Services LLC (“SPFS”) and Dow Jones® is a registered trademark of Dow Jones Trademark Holdings LLC (“Dow Jones”). Neither S&P Dow Jones Indices LLC, SPFS, Dow Jones, their affiliates nor their licensors (“S&P DJI”) make any representation or warranty, express or implied, as to the ability of any index to accurately represent the asset class or market sector that it purports to represent and S&P DJI shall have no liability for any errors, omissions, or interruptions of any index or the data included therein.