Investing
Commentary published on March 8, 2023
February 2023 Market Commentary
Summary
- U.S. Treasury Curve: U.S. Treasury yields increased across the curve, and the curve’s inversion remained (See Figure 1).
- Municipal Market Technicals: Issuance decreased to $18.3 billion. Continued low levels of new issue supply supported municipal bond performance relative to Treasuries.
- Corporate Market Technicals: Investment grade (IG) corporate fixed-rate bond issuance surpassed $150 billion. IG bond fund inflows were about $16 billion.
- Securitized Trends: Securitized sector total returns were negative. Asset-backed securities (ABS) and Commercial Mortgage-Backed Securities (CMBS) delivered positive excess returns, based on Bloomberg (BBG) data.
(The following commentary is a summary of discussions among members of the Breckinridge Capital Advisors Investment Committee as they reviewed monthly activity in the markets and investment returns. The members of the Investment Committee under the leadership of Chief Investment Officer Ognjen Sosa, CAIA, FRM, are Co-Head of Portfolio Management, Matthew Buscone; Senior Portfolio Manager Sara Chanda; Co-Head of Research, Nicholas Elfner; Co-Head of Portfolio Management, Jeffrey Glenn, CFA; Head of Municipal Trading, Benjamin Pease; and Co-Head of Research, Adam Stern, JD.)

Market Review
The majority of economic data reported in February suggested to most investors that the Federal Reserve (Fed) will continue to increase the fed funds interest rate to control inflation. The prospect of higher rates caused investors to reassess strategies in light of uncertain inflation and monetary policy expectations.
With the current fed funds target range at 4.5 percent to 4.75 percent as of the end of February, fed fund futures indicate the Fed’s terminal rate will approximately 5.4 percent. The implied terminal rate is 50 basis points (bps) higher than it was in January.
Market expectations shifted much higher during February and came closer to the Fed’s projections. Based on the futures, the market is expecting three more 25bps hikes before a pause and then a cut at year end.
Inflation remained entrenched with personal consumption expenditures (PCE) monthly readings released in the last full week of February showing a 0.6 percent increase for headline and core, both beating expectations, per the Bureau of Economic Analysis. Annual figures also were higher than estimates, with headline and core PCE data at 5.4 percent and 4.7 percent, respectively.
Consumer strength persists, with increasing personal income and spending and sustained labor market strength, as jobless claims continue to trend lower.
In somewhat of a contrast, the second estimate for fourth quarter gross domestic product (GDP) was 2.7 percent, down from the initial 2.9 percent reading and slightly below estimates. In addition, with mortgage rates hitting 6.64 percent, existing home sales showed a 0.7 percent decline over the month, marking 12 consecutive months of slippage and the lowest sales since 2010.
Treasury Bond yields pushed higher across the curve amid heightened volatility as measured by the ICE/Bank of America Merrill Lynch MOVE Index,1 a measure of market expectations for bond volatility (See Figure 2). The 2-year closed at 4.81 percent. The 10-year closed the month at 3.92 percent. BBG U.S. Treasury Bond Index2 was 2.3 percent lower on the month. The 3-month/10-year Treasury yield curve inversion, historically an indicator of future recessionary conditions, was -85bps, 33bps more than at year-end. The BBG U.S. Aggregate Bond Index3 was 2.6 percent lower. The S&P 500 Index4 dropped 2.6 percent.

Municipal Market Review
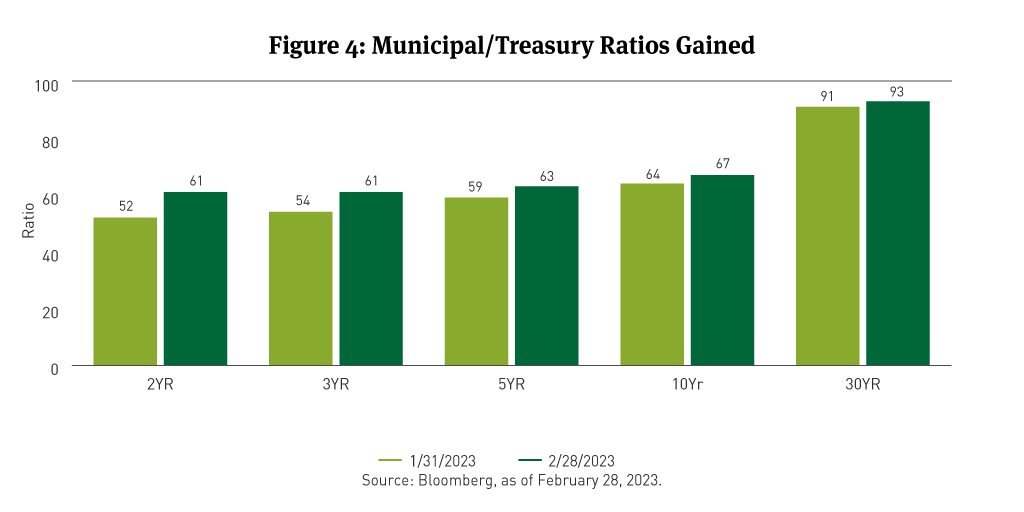
High quality municipal bonds slightly outperformed Treasuries in February, as yields rose (See Figure 3) and Muni/Treasury (M/T) Ratios moved higher across the curve (See Figure 4). Shorter maturity yields rose the most, with two-year yields up almost 80bps, five-years by 60bps, 10-years by 40bps, and 30-years by over 30bps.

Like the Treasury curve, the municipal yield curve remains inverted from two to 10 years. The 2-year/10-year (2s/10s) curve sloped negatively at 31bps remains an historical rarity in the municipal bond market.
Lower new issue supply this year is a continuing trend from last year, with issuers reluctant to borrow due to higher costs for capital expenditures. The Bond Buyer reported that municipal bond issuance in February was $18.3 billion, down 20 percent month-over-month (M/M) and 42 percent year-over-year (Y/Y). Tax-exempt municipal bond issuance was 20 percent lower Y/Y, while taxable municipal bond issuance was nearly 54 percent for the same period. Lipper data showed municipal bond mutual fund outflows of $1.3 billion in February.
The BBG Managed Money Short/Intermediate (1-10) Index5 fell 2.24 percent and the BBG 1-10 Year Municipal Bond Blended Index6 fell 1.75 percent. In the increasingly volatile market, shorter-maturity bonds outperformed longer-maturity issues. Bonds rated BBB underperformed higher quality, while bonds rated A outpaced both AAAs and AAs. The reversal of returns in February almost completely eradicated January gains, bringing year-to date returns to near flat.
Corporate Market Review
IG corporate bond spreads were 7bps wider, per BBG data, ending February at 124bps. The BBG U.S. Corporate Investment Grade (IG) Index7 fell 3.2 percent on a total return basis, with a negative excess return of 54bps compared with duration-matched Treasuries.
At 124bps, the IG Corporate Index option-adjusted spread continues to suggest the pricing in of a soft landing for the U.S. economy rather than an earnings or economic recession, in our view based on historical spread data. February spread widening reflected more supply hitting the market and some disappointing inflation data.
Credit fundamentals are weakening with corporate profits slowing. Fundamentals will face pressure due to slowing U.S. and global growth. Net leverage increased modestly over the trailing 12-month period and should be expected to rise further. The weaker macroeconomic backdrop may drive an increase in credit agency downgrades from currently moderate levels, with relatively fewer upgrades moving forward.
We view spread valuations as a weakness given our stall-speed outlook for corporate profits and economic growth. With that said, a 5.51 percent yield-to-worst on the IG Corporate Index at month end may continue to attract fund flows and keep spreads tighter than fundamentals would suggest near term.
Per BBG, the best-performing corporate sectors were Airlines, Sovereigns, Foreign Local Governments, Packaging, and Lodging. The worst-performing were Cable Satellite, Railroads, Wirelines, Health Insurance, and Restaurants.
Corporate bonds in the shorter maturity range delivered the best total and excess returns. Bonds rated in the A category fared the best across the IG quality spectrum followed by bonds rated AA.
IG corporate supply for February was nearly $150 billion, per BBG data. Merger and acquisition (M&A) funding contributed to the tally and by the end of the month the market was satiated, and deals began to price at wider concessions. The strong positive turn for IG fund flows in January continued in February, with about $16 billion of inflows, per Emerging Portfolio Fund Research.
Securitized Market Review
In February, securitized markets reflected investor concerns about interest rate expectations. The BBG Mortgage-backed securities (MBS) Index8 return had a negative total and excess returns of 2.46 return and 29bps, respectively. The most favorable total and excess returns typically were among the 5 to 6 percent conventional9 and Ginnie Mae10 coupon securities. BBG data showed CMBS earned a negative total return of 1.87 percent and a positive excess return of 24bps. Agency CMBS had a negative total return of 2.24 and a positive excess return of 13bps. Non-Agency CMBS total returns were a negative 1.54 and excess return was 34bps.
ABS sector total and excess returns were negative 85bps and positive 26bps, respectively, per BBG. Credit card loan ABS outperformed auto loan ABS on the basis of total (negative 0.46 percent versus negative 1.06 percent) and excess returns (positive 21bps versus positive 5 bps).
#326186 (3/8/2023)
[1] The MOVE Index measures U.S. interest rate volatility by tracking the movement in U.S. Treasury yield volatility implied by current prices of one-month over-the-counter options on 2-year, 5-year, 10-year and 30-year Treasuries. Historically, the index rises as concerns grow that interest rates are moving higher.
[2] The Bloomberg U.S. Treasury Bond Index is an unmanaged index of prices of U.S. Treasury bonds with maturities of 1 to 30 years. You cannot invest directly in an index.
[3] The Bloomberg U.S. Aggregate Bond Index is a broad-based benchmark that measures the investment-grade, U.S.-dollar-denominated, fixed-rate taxable bond market, including Treasuries, government-related and corporate securities, mortgage-backed securities (agency fixed-rate and hybrid adjustable-rate mortgage pass-throughs), asset-backed securities, and commercial mortgage-backed securities. You cannot invest directly in an index.
[4] The S&P 500 Index consists of 500 stocks chosen for market size, liquidity, and industry group representation. It is a market-value-weighted index with each stock’s weight in the index proportionate to its market value. You cannot invest directly in an index.
[5] The Bloomberg Municipal Managed Money Short/Intermediate Index measures the performance of the publicly traded municipal bonds that cover the USD-denominated short/intermediate term tax-exempt bond market, including state and local general obligation bonds, revenue bonds, insured bonds, and pre-refunded bonds. It is rules-based, and market-value weighted. You cannot invest directly in an index.
[6] The Bloomberg Municipal 1-10 Year Blend 1-12 Year Index measures the performance of short and intermediate components of the Municipal Bond Index — an unmanaged, market value-weighted index which covers the U.S. investment grade, tax-exempt bond market. You cannot invest directly in an index.
[7] The Bloomberg U.S. Corporate Bond Index is an unmanaged market-value-weighted index of investment-grade corporate fixed-rate debt issues with maturities of one year or more. You cannot invest directly in an index.
[8] The Bloomberg MBS Index tracks agency mortgage-backed pass-through securities (both fixed-rate and hybrid ARM) guaranteed by Ginnie Mae (GNMA), Fannie Mae (FNMA), and Freddie Mac (FHLMC). The index is constructed by grouping individual pools into aggregates or generics based on program, coupon, and vintage. You cannot invest directly in an index.
[9] Conventional MBS are issued by the Federal National Mortgage Association and the Federal Home Loan Mortgage Corporation.
[10] Ginnie Mae MBS are issued by the Government National Mortgage Association.
DISCLAIMER:
This material provides general and/or educational information and should not be construed as a solicitation or offer of Breckinridge services or products or as legal, tax or investment advice. The content is current as of the time of writing or as designated within the material. All information, including the opinions and views of Breckinridge, is subject to change without notice.
There is no assurance that any estimate, target, projection or forward-looking statement (collectively, “estimates”) included in this material will be accurate or prove to be profitable; actual results may differ substantially. Breckinridge estimates are based on Breckinridge’s research, analysis and assumptions. Other events that were not considered in formulating such projections could occur and may significantly affect the outcome, returns or performance.
Not all securities or issuers mentioned represent holdings in client portfolios. Some securities have been provided for illustrative purposes only and should not be construed as investment recommendations. Any illustrative engagement or ESG analysis examples are intended to demonstrate Breckinridge’s research and investment process.
Past performance is not a guarantee of future results. Breckinridge makes no assurances, warranties or representations that any strategies described herein will meet their investment objectives or incur any profits. Any index results shown are for illustrative purposes and do not represent the performance of any specific investment. Indices are unmanaged and investors cannot directly invest in them. They do not reflect any management, custody, transaction or other expenses, and generally assume reinvestment of dividends, income and capital gains. Performance of indices may be more or less volatile than any investment strategy.
Performance results for Breckinridge’s investment strategies include the reinvestment of interest and any other earnings, but do not reflect any brokerage or trading costs a client would have paid. Results may not reflect the impact that any material market or economic factors would have had on the accounts during the time period. Due to differences in client restrictions, objectives, cash flows, and other such factors, individual client account performance may differ substantially from the performance presented.
All investments involve risk, including loss of principal. Diversification cannot assure a profit or protect against loss. Fixed income investments have varying degrees of credit risk, interest rate risk, default risk, and prepayment and extension risk. In general, bond prices rise when interest rates fall and vice versa. This effect is usually more pronounced for longer-term securities. Income from municipal bonds can be declared taxable because of unfavorable changes in tax laws, adverse interpretations by the IRS or state tax authorities, or noncompliant conduct of a bond issuer.
Breckinridge believes that the assessment of ESG risks, including those associated with climate change, can improve overall risk analysis. When integrating ESG analysis with traditional financial analysis, Breckinridge’s investment team will consider ESG factors but may conclude that other attributes outweigh the ESG considerations when making investment decisions.
There is no guarantee that integrating ESG analysis will improve risk-adjusted returns, lower portfolio volatility over any specific time period, or outperform the broader market or other strategies that do not utilize ESG analysis when selecting investments. The consideration of ESG factors may limit investment opportunities available to a portfolio. In addition, ESG data often lacks standardization, consistency and transparency and for certain companies such data may not be available, complete or accurate.
Breckinridge’s ESG analysis is based on third party data and Breckinridge analysts’ internal analysis. Analysts will review a variety of sources such as corporate sustainability reports, data subscriptions, and research reports to obtain available metrics for internally developed ESG frameworks. Qualitative ESG information is obtained from corporate sustainability reports, engagement discussion with corporate management teams, among others. A high sustainability rating does not mean it will be included in a portfolio, nor does it mean that a bond will provide profits or avoid losses.
The effectiveness of any tax management strategy is largely dependent on each investor’s entire tax and investment profile, including investments made outside of Breckinridge’s advisory services. As such, there is a risk that the strategy used to reduce the tax liability of the investor is not the most effective for that investor. Breckinridge is not a tax advisor and does not provide personal tax advice. Investors should consult with their tax professionals regarding tax strategies and associated consequences.
Federal and local tax laws can change at any time. These changes can impact tax consequences for investors, who should consult with a tax professional before making any decisions.
Separate accounts may not be suitable for all investors.
Some information has been taken directly from unaffiliated third-party sources. Breckinridge believes the data provided by unaffiliated third parties to be reliable but investors should conduct their own independent verification prior to use. Some economic and market conditions contained herein have been obtained from published sources and/or prepared by third parties, and in certain cases have not been updated through the date hereof. All information contained herein is subject to revision. Any third-party websites included in the content has been provided for reference only.
Certain third parties require us to include the following language when using their information:
BLOOMBERG® is a trademark and service mark of Bloomberg Finance L.P. and its affiliates (collectively “Bloomberg”). Bloomberg does not approve or endorse this material or guarantees the accuracy or completeness of any information herein, or makes any warranty, express or implied, as to the results to be obtained therefrom and, to the maximum extent allowed by law, neither shall have any liability or responsibility for injury or damages arising in connection therewith.